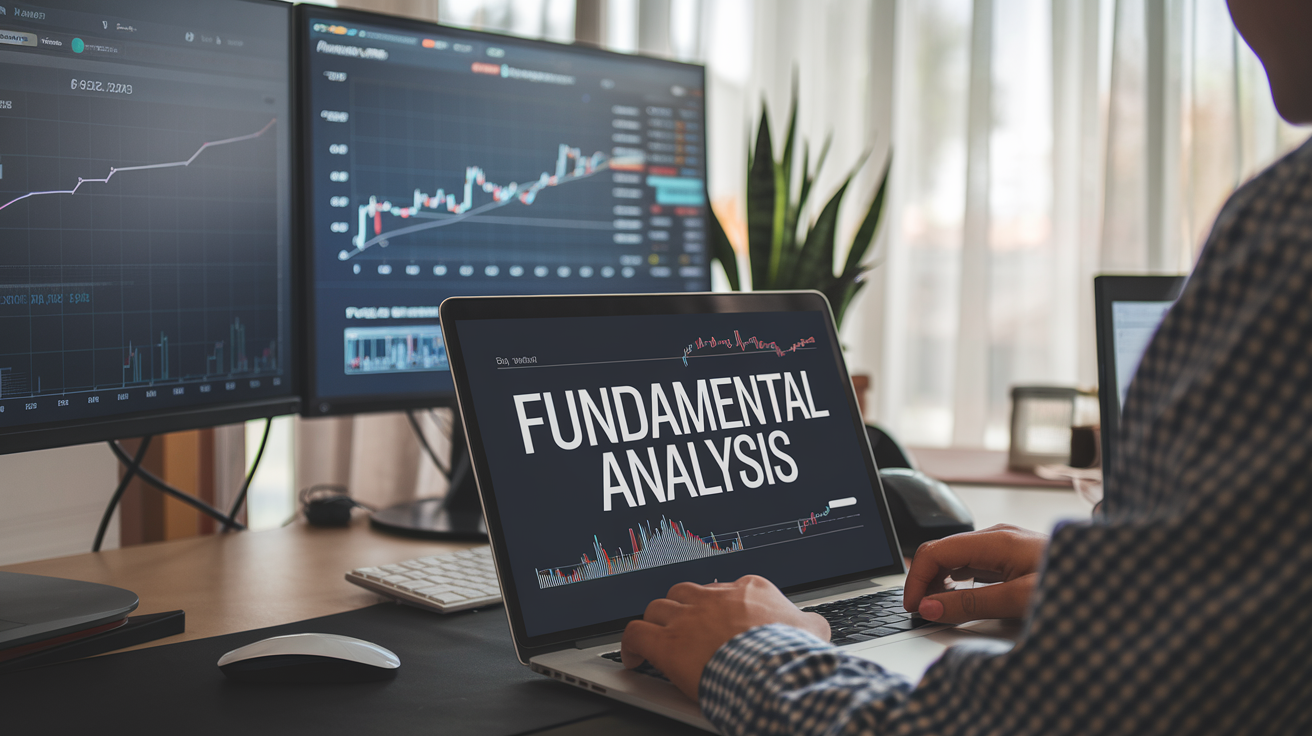
Fundamental Analysis: Principles and Methods for Asset Valuation
Fundamental analysis represents a comprehensive method of evaluating financial assets based on studying economic, financial, and industry factors. Unlike technical analysis , which focuses on charts and price patterns, the fundamental approach investigates the causes of price movements — economic processes that determine the real value of assets.
The main goal of fundamental analysis is to determine an asset's fair value and compare it with the current market price. If the market price is below fair value, the asset is considered undervalued and represents an investment opportunity. If higher — the asset is overvalued and may be a candidate for selling or shorting.
This method is particularly valuable for long-term investors seeking to build a portfolio of quality assets. Warren Buffett, one of the greatest investors of our time, built his empire precisely on fundamental analysis principles, identifying companies with sustainable competitive advantages that compound wealth over decades. I also recommend studying macroeconomics and its fundamentals for a complete picture.
Levels of Fundamental Analysis
Fundamental analysis encompasses several research levels, from the global economy to specific companies. The macroeconomic level studies the overall state of the economy: GDP dynamics, unemployment levels, inflation, and central bank policies.
The central bank interest rate is one of the key macroeconomic factors. Rate increases make borrowing more expensive, slow economic activity, and usually negatively affect the stock market. Rate cuts stimulate the economy and support asset price growth.
The industry level analyzes specific economic sectors: supply and demand dynamics, competitive environment, technological changes, and regulatory factors. For example, the transition to green energy radically changes prospects for the oil and gas sector while creating opportunities in renewable energy.
Company Analysis: Financial Indicators
At the company level, fundamental analysis studies financial statements: income statement, balance sheet, and cash flow statement. These documents reveal the company's true financial condition, its ability to generate profits, and service debt obligations.
The P/E ratio (price-to-earnings) shows how much investors are willing to pay per unit of company profit. High P/E may indicate overvaluation or high growth expectations. Low P/E may signal undervaluation or business problems requiring further investigation.
The P/B ratio (price-to-book) compares market capitalization with the book value of assets. A value below one theoretically means the company can be bought for less than its asset value — a potentially attractive investment opportunity.
ROE (return on equity) measures the efficiency of shareholder capital utilization. Companies with consistently high ROE demonstrate the ability to generate profits on invested funds. Debt load shows the ratio of borrowed to equity funds — a critical indicator of financial stability.
Dividend Analysis
Dividend yield is an important indicator for income-oriented investors. It's calculated as the ratio of annual dividends to the current stock price. A stable dividend history indicates company maturity and management confidence in future cash flows.
The dividend payout ratio shows what share of profits the company distributes to shareholders. Too high a ratio (above 80%) may indicate risk of dividend cuts if profits decline. Too low suggests potential for future payment increases as earnings grow.
Dividend history analysis identifies companies with consistent payment growth — so-called dividend aristocrats. These companies have increased dividends for decades, demonstrating business model stability and commitment to shareholder interests.
Fundamental Analysis Across Different Markets
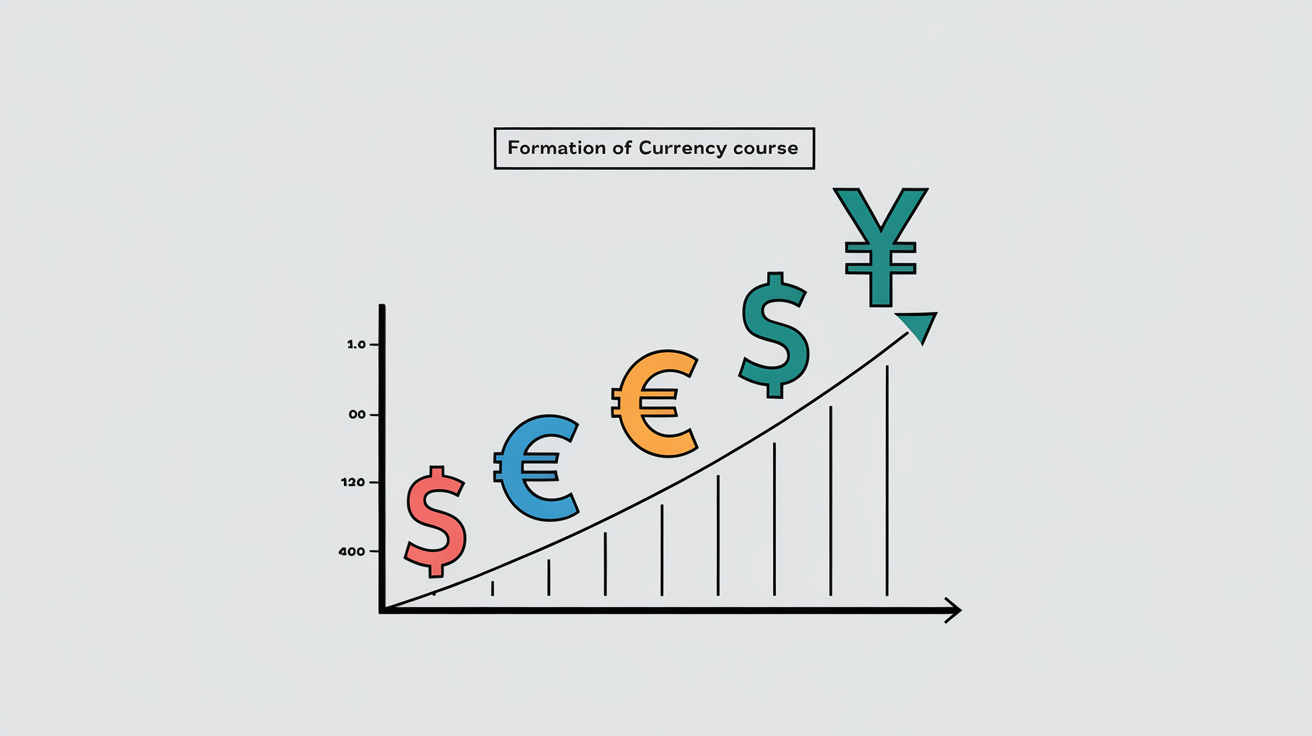
In the forex market , fundamental analysis focuses on comparing different countries' economies. Central bank interest rate decisions, trade balance, political stability — these factors determine relative currency strength and form long-term trends.
In commodity markets, supply and demand balance plays a key role. Oil inventories, agricultural crop yields, geopolitical risks in extraction regions — these factors directly affect commodity prices. Volume analysis complements the fundamental picture. To understand this topic more deeply, I recommend studying the economic calendar .
In cryptocurrency markets , fundamental analysis includes evaluating technology, development team, adoption level, regulatory environment, and project competitive advantages. The absence of traditional financial indicators requires adapting analysis methods. For an advanced understanding, study news trading.
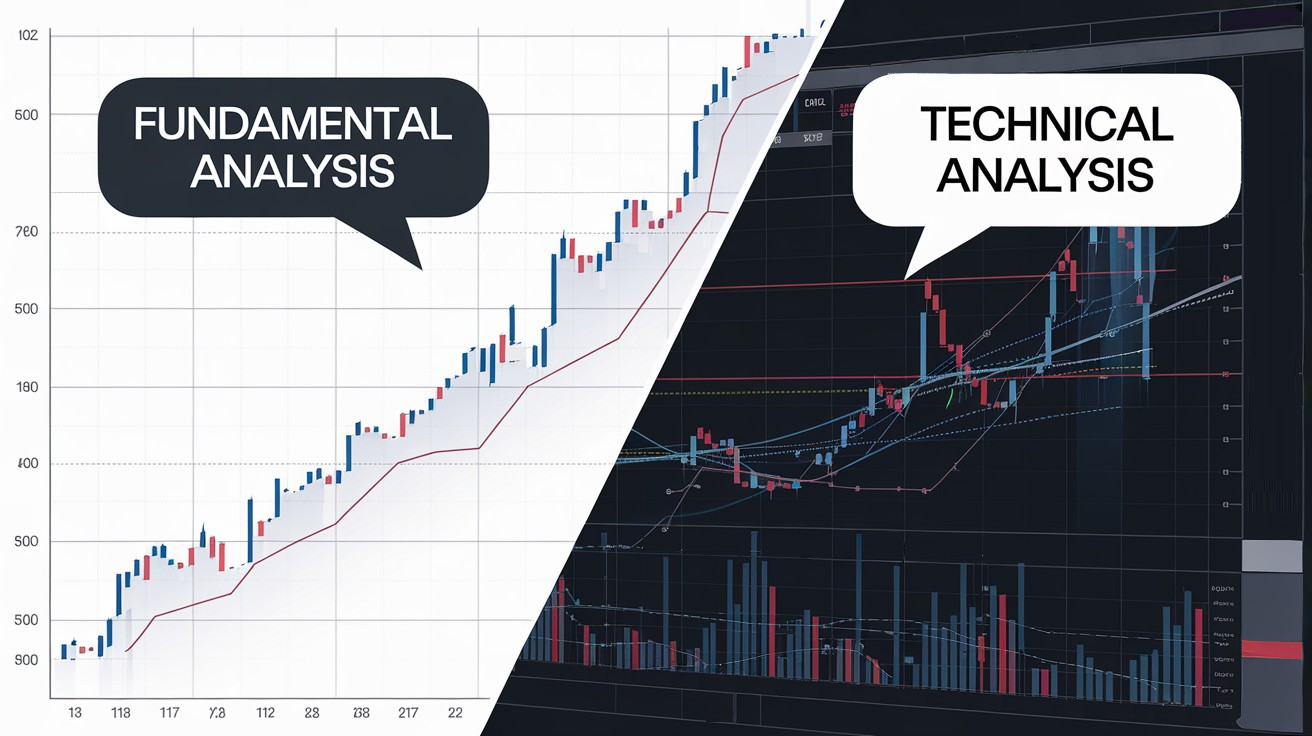
Fundamental vs Technical Analysis
Fundamental and technical analysis don't contradict each other but complement one another. Fundamental analysis answers "what to buy" — identifying quality assets with growth potential. Technical analysis answers "when to buy" — determining optimal entry points for execution.
For long-term investors, fundamental analysis takes priority. They seek companies with sustainable competitive advantages capable of generating profits for decades. Short-term price fluctuations matter less to them than fundamental business quality.
For active traders, technical analysis proves more practical. It allows quick assessment of market dynamics, identification of support and resistance levels , and use of candlestick patterns for position entry.
Limitations of Fundamental Analysis
Fundamental analysis has significant limitations. It requires considerable time and expertise for correct data interpretation. Financial statements can be distorted by aggressive accounting or intentional fraud — the Enron and Wirecard stories demonstrate these risks.
Markets can remain irrational longer than investors can remain solvent. Undervalued assets may stay undervalued for years, while overvalued ones continue rising. Keynes' famous quote "markets can remain irrational longer than you can remain solvent" warns against blind faith in fundamental valuations.
Information asymmetry creates additional complications. As Richard Wyckoff noted, large institutional investors have access to information and analytical resources unavailable to retail traders. Smart Money concepts help understand large player actions.
Risk Management in Investing
Even quality fundamental analysis doesn't guarantee success without competent risk management . Portfolio diversification reduces the impact of errors in individual asset valuations. The rule "don't put all eggs in one basket" remains relevant.
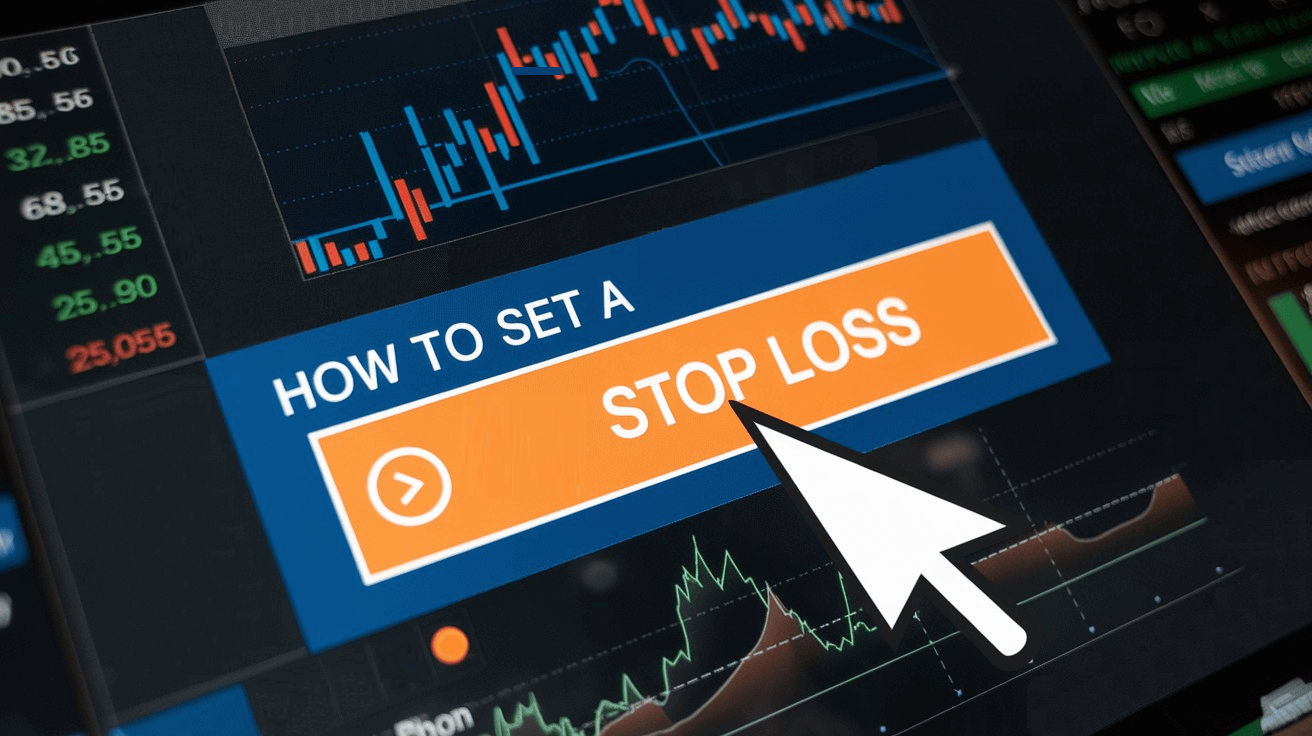
Setting stop-losses protects capital from catastrophic losses. Even a fundamentally attractive asset can decline due to unforeseen circumstances. Loss limitation is a mandatory condition for long-term market survival.
Position size should match confidence level in the analysis and acceptable risk. Portfolio concentration in a few positions increases potential returns but also multiplies risks. Psychological stability allows adhering to strategy during market turbulence.
Common Investor Mistakes
Blind trust in financial statements is a common mistake. Companies are interested in presenting results in the best light. Critical analysis, comparison with competitors, and verification of alternative information sources reduce the risk of falling into the trap of distorted data.
Ignoring macroeconomic indicators leads to losses. Even an excellent company will suffer during economic recession or industry crisis. Understanding the economic cycle and its impact on various sectors is a necessary element of fundamental analysis.
Attachment to a position despite changing fundamentals is a psychological trap. If the original investment thesis is no longer valid, holding the position becomes hope instead of analysis. Willingness to admit mistakes and lock in losses is a sign of a mature investor who will survive long-term.
Conclusion
Fundamental analysis is simultaneously art and science. It requires understanding macroeconomic principles, ability to read financial statements, and skill in assessing company management quality. Successful application of fundamental analysis gives investors a competitive advantage: the ability to identify undervalued assets with long-term growth potential.
However, fundamental analysis is not a magic wand guaranteeing success. Markets remain complex and unpredictable systems where crowd psychology, macroeconomic shocks, and unforeseen events can destroy even the most well-reasoned theories. Therefore, proper risk management, portfolio diversification, and willingness to adapt to changing conditions are critically important. To consolidate the material, also study The Federal Reserve and Central Banks .
Those willing to invest time studying fundamental investing principles, develop a systematic approach to asset analysis, and maintain disciplined adherence to their strategy have all the chances for long-term investment success. The combination of quality analysis, strict discipline, and capital management transforms investing from a gamble into a systematic, reproducible activity with positive mathematical expectation.
Frequently Asked Questions
Fundamental analysis is an asset valuation method based on studying economic, financial, and industry factors. Its goal is to determine an asset's fair value and identify undervalued or overvalued instruments.
Main indicators include: macroeconomic (GDP, inflation, interest rates), corporate (revenue, profit, P/E, P/B), and industry factors (demand dynamics, competitive environment, regulatory changes).
Fundamental analysis studies economic factors and fair asset value for long-term investments. Technical analysis focuses on charts, patterns, and volumes for short-term trading.
Fundamental analysis applies to stock markets, forex, commodity markets, and cryptocurrency markets. Methods are adapted to each market's specifics.
Typical mistakes: blind trust in financial statements, ignoring macroeconomic factors, lack of diversification, underestimating market sentiment impact on short-term dynamics.
About the Author
Author: Igor Arapov — independent researcher in trading psychology and behavioral finance, practising trader since 2013, founder of arapov.trade, author of a trading book series (Open Library ), (ORCID: 0009-0003-0430-778X ).