Technical Analysis of Markets: Methods and Forecasting Principles
Technical analysis represents a methodology for studying financial markets through the lens of price charts and statistical indicators. Unlike fundamental analysis that evaluates economic factors and intrinsic asset value, technical analysis focuses exclusively on price behavior and market participant actions. This method rests on the conviction that all significant information is already reflected in price quotes.
The popularity of technical analysis stems from its universality and visual clarity. Traders apply identical tools across forex markets, stock exchanges, cryptocurrency platforms, and commodity markets. Charts reveal crowd psychology — the fear, greed, hope, and despair of millions of participants whose collective actions shape price movements and create tradeable opportunities.
Fundamental Principles of Technical Analysis
Three axioms form the foundation of the technical approach to markets. The first states that price discounts everything — economic data, political events, market sentiment, and expectations are already embodied in current quotes. Traders need not analyze news flow since the market has already processed it, reflecting the result in price movement.
The second principle asserts that price movements are not random. Trends form under the influence of collective market participant behavior and tend to persist until opposing forces emerge. Recognizing trends and trading in their direction constitutes the essence of successful trading methodology.
The third axiom maintains that history repeats itself. Trader and investor psychology remains unchanged across decades. Fear of losses and greed in pursuit of profit generate recurring behavioral patterns reflected in identical chart formations. Patterns that worked a century ago continue working today because human nature doesn't change.
Support and Resistance Levels
Support and resistance levels form the structural backbone of technical analysis. A support level represents a price zone where buyer concentration is sufficient to halt decline. Here demand absorbs supply, and price gains upward momentum. Traders place buy orders near support zones, anticipating a bounce.
A resistance level functions as a mirror image — a zone where sellers outnumber buyers in both count and capital. Supply absorbs demand, halting price advancement. Repeated testing of a level without breakout strengthens its significance in market participants' perception.
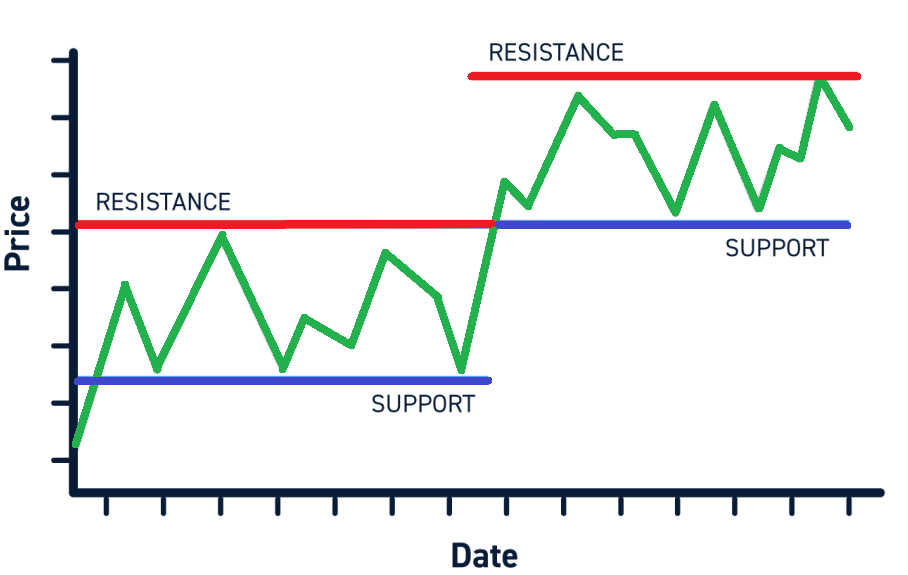
Horizontal levels are constructed from historical extremes — points where price reversed in the past. Dynamic levels are formed by moving averages and shift over time. In an uptrend, the moving average acts as dynamic support; in a downtrend, as resistance.
Trend Lines and Channels
Trend lines connect sequential lows in an uptrend or highs in a downtrend. They visualize market direction and serve as dynamic support or resistance levels. Price touching a trend line provides an opportunity for entry in the direction of the primary movement.
A price channel forms from two parallel trend lines. The lower channel boundary in an uptrend represents a buying zone; the upper boundary serves for profit-taking or short position initiation. Channel breakout signals either trend acceleration or reversal depending on breakout direction.
Constructing trend lines requires practice and discipline. A line is considered valid with a minimum of three touches. More contact points without breakout indicate a stronger level. However, excessively frequent testing gradually weakens the line as buyers or sellers deplete their resources.
The Role of Volume in Analysis
Trading volume reflects the intensity of trader participation in price movement. High volume during price increase confirms buyer strength and uptrend sustainability. Rising prices on low volume raise suspicion — possibly a correction within a downtrend or manipulation by large players.
Volume analysis helps confirm level breakouts. Resistance breakout on high volume likely proves genuine — real demand stands behind it. Breakout on low volume more often proves false, with price returning to the previous range.
Volume indicators — OBV, A/D Line, VWAP — transform raw volume data into analytical signals. OBV accumulates volumes based on candle direction, revealing hidden accumulation or distribution. VWAP displays volume-weighted average price and is used by institutional traders for fair value assessment.
Chart Patterns
Patterns are recurring chart formations reflecting market participant psychology. They divide into two categories: reversal patterns signaling trend change, and continuation patterns indicating temporary consolidation before movement resumption.
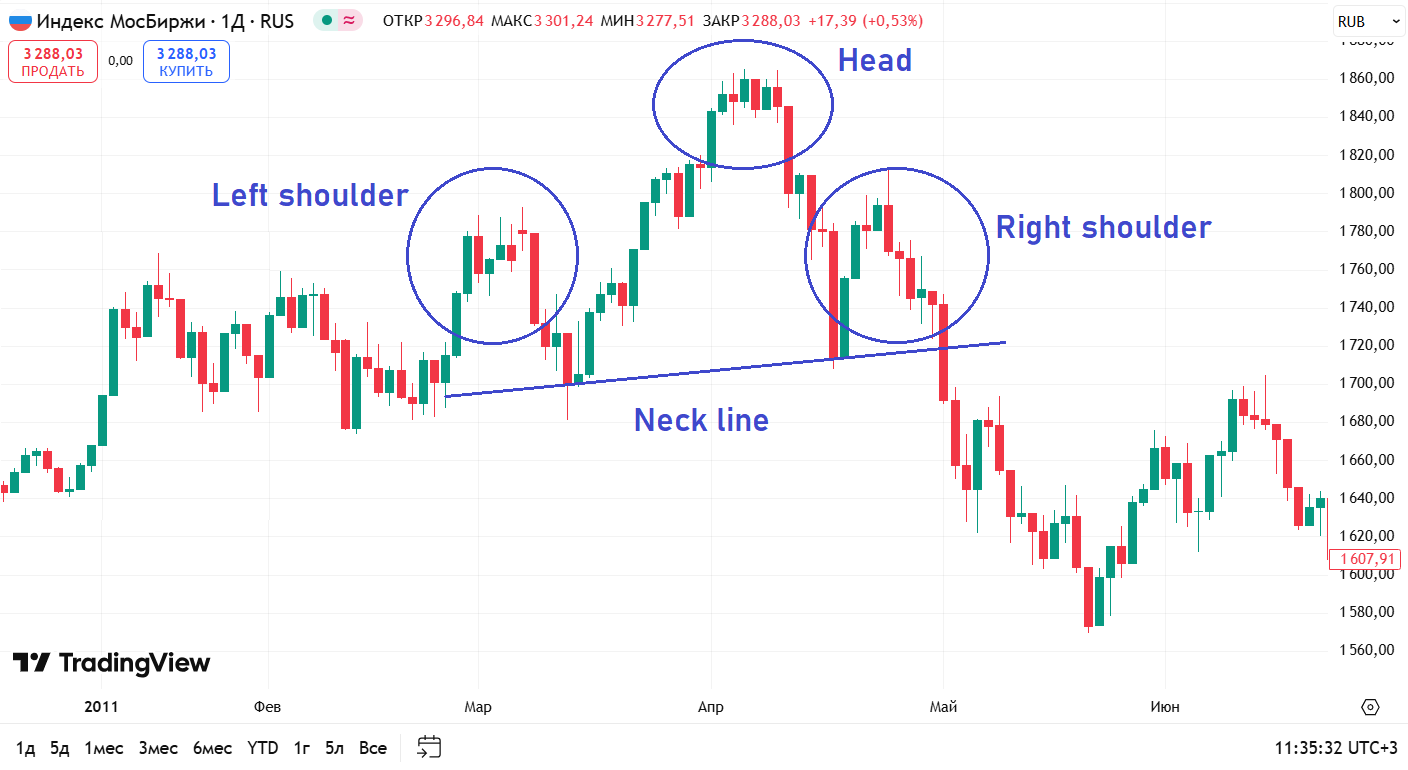
Head and shoulders is a classic reversal pattern forming at uptrend peaks. Three sequential peaks where the center exceeds the sides create the characteristic silhouette. Neckline breakout — the horizontal connecting lows between peaks — confirms reversal and opens downside potential.
Double top and double bottom signal price inability to exceed the previous extreme. Two peaks at the same level form an M-shaped figure — a bearish signal. Two bottoms at the same level create a W-shaped formation — a bullish signal. Intermediate level breakout activates the pattern.
Flags and pennants are continuation patterns arising after impulsive movements. A flag represents a sloped channel against the trend; a pennant is a narrowing triangle. Both patterns indicate a pause before primary movement continuation. Breakout in the direction of the preceding impulse confirms the signal.
Technical Indicators
Indicators are mathematical transformations of price data that visualize hidden market characteristics. They divide into trend-following (determining direction), oscillators (measuring strength and speed), and volatility and volume indicators. Each category solves specific analytical tasks.
Moving averages are fundamental trend indicators. Simple moving average (SMA) calculates the arithmetic mean of prices over a period. Exponential (EMA) assigns greater weight to recent prices, responding faster to changes. Fast and slow average crossover generates entry signals.
Trading Indicators RSI and MACD are popular oscillators. RSI measures the ratio of upward to downward movements, identifying overbought (above 70) and oversold (below 30) conditions. MACD shows moving average convergence and divergence, generating signals on line crossovers. Bollinger Bands measure volatility through standard deviation from the mean.
Application Across Different Markets
The forex market is characterized by high liquidity and round-the-clock trading. Technical analysis proves particularly effective here thanks to the enormous data volume and clarity of chart formations. Fibonacci levels , Pivot Points, and oscillators are widely applied for currency pair analysis.
Stock markets demonstrate more pronounced long-term trends. Individual company stocks are subject to corporate news influence, but indices respond well to technical analysis. The 50 and 200-day moving averages serve as key reference points for institutional investors making allocation decisions.
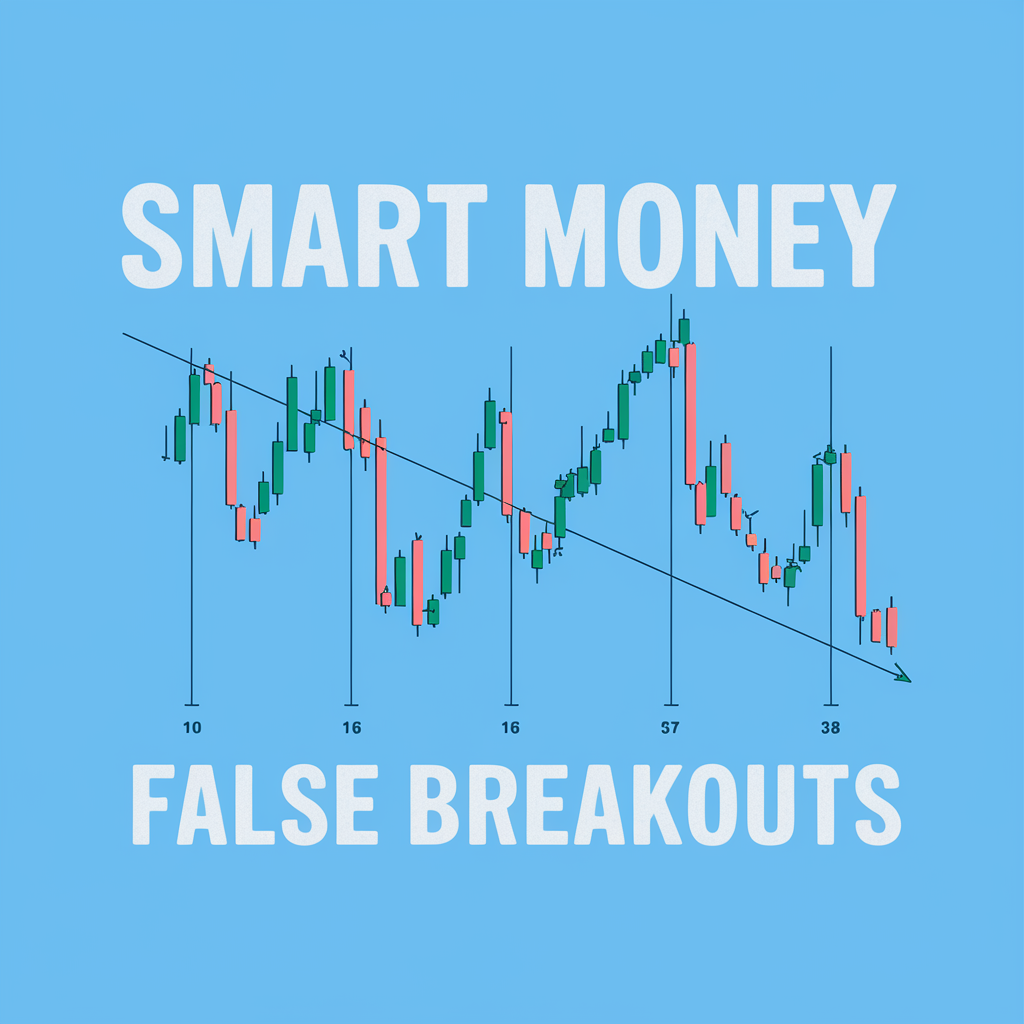
Cryptocurrency markets are distinguished by extreme volatility. Technical analysis here requires adaptation: RSI overbought levels shift, and breakouts frequently accompany sharp movements. Volume analysis and Smart Money concepts help identify large player actions.
Building a Trading Strategy
An effective strategy unites multiple technical analysis tools into a coherent system. Trend indicators determine trading direction, support and resistance levels define entry zones, oscillators optimize timing. Volume confirms signal validity and prevents false entries.
Timeframe selection depends on trading style. Scalpers work on minute charts, day traders on hourly, swing traders on daily. Multi-timeframe analysis improves accuracy: the higher timeframe determines trend, the lower identifies entry points.
Risk management forms an integral part of any strategy. Stop-loss placement beyond the nearest support or resistance level protects capital. Position size calculation ensures potential loss doesn't exceed acceptable capital percentage. Risk-to-reward ratio should be at least 1:2.
Method Advantages and Limitations
Technical analysis is accessible and universal. It requires no economics degree and applies to any market with sufficient liquidity. Charts visually display the market situation, while indicators automate part of the analytical work. Modern platforms provide powerful analysis tools.
However, the method has limitations. Technical analysis doesn't account for fundamental factors — unexpected news can invalidate any chart forecast. Indicators lag since they're calculated from historical data. In low liquidity conditions, patterns frequently generate false signals.
Interpretation subjectivity presents another limitation. Two traders viewing the same chart may reach opposite conclusions. Overcoming subjectivity requires rule formalization: clear entry criteria, exit rules, and position management protocols. Psychological discipline transforms analysis into a profitable system.
Modern Technologies in Analysis
Trading platforms like MetaTrader, TradingView, and NinjaTrader provide hundreds of built-in indicators and charting tools. Traders create custom indicators using Pine Script or MQL programming languages, adapting analysis to specific strategies.
Algorithmic trading automates strategy execution. Trading bots analyze indicators and patterns in real-time, opening and closing positions without human intervention. This eliminates the emotional factor and ensures execution discipline.
Artificial intelligence and machine learning open new horizons. Neural networks recognize complex patterns invisible to the human eye. Algorithms analyze terabytes of data, identifying statistical regularities. However, technology doesn't guarantee profit — it merely expands the trader's analytical arsenal.
Conclusion
Technical analysis remains an indispensable tool for traders seeking competitive advantage in financial markets. Its universality, applicability across all asset classes, and decades of proven effectiveness make this methodology the foundation of successful trading for millions of market participants worldwide.
Mastering technical analysis demands consistent practice and iron discipline. Understanding the fundamental principles—that price discounts everything, that trends exist and repeat, that history rhymes—builds the correct trading mindset. Indicators, chart patterns, and support/resistance levels provide concrete signals for entry and exit decisions. The basic concepts are described in the article - candlestick patterns .
The key to success lies not in discovering the perfect indicator or pattern, but in systematically applying your methodology with rigorous risk management. Combine multiple confirming techniques to strengthen signals, avoid overtrading, and remember that no tool guarantees perfect results. Technical analysis demands respect but not blind faith—use it as a navigation instrument helping you cut through market noise and make informed decisions about position entry and exit. The traders who prosper are those who view technical analysis as a language revealing market structure, not as a crystal ball predicting the future.
Frequently Asked Questions
Technical analysis is a method of forecasting price movements based on historical price data, trading volumes, and chart patterns. It helps identify trends and determine entry and exit points for positions.
Three fundamental principles: price discounts everything (all information is reflected in quotes), price movements are not random (prices follow trends and patterns), history repeats itself (market psychology creates recurring models).
Main tools include support and resistance levels, trend lines, chart patterns (triangles, head and shoulders), technical indicators (RSI, MACD, moving averages), and volume analysis.
Technical analysis studies price charts and statistical indicators, ignoring intrinsic asset value. Fundamental analysis evaluates economic indicators, financial statements, and macroeconomic factors.
Technical analysis is universal and applies to forex, stock markets, cryptocurrencies, commodities, and indices. Methods are adapted to the volatility and liquidity of specific markets.
About the Author
Author: Igor Arapov — independent researcher in trading psychology and behavioral finance, practising trader since 2013, founder of arapov.trade, author of a trading book series (Open Library ), (ORCID: 0009-0003-0430-778X ).