Understanding Trend Channels in Market Analysis
A trend channel stands as one of the cornerstone instruments in technical analysis, employed by market participants worldwide to visualize and interpret price dynamics. This analytical framework enables traders to identify boundaries within which asset prices tend to oscillate, providing clear reference points for trade planning. The underlying concept rests on a fundamental market observation: prices rarely move randomly but instead follow discernible patterns constrained by the invisible forces of supply and demand.
The practical value of channel analysis lies in its ability to transform seemingly chaotic price fluctuations into an organized structure. When a trader identifies clear movement boundaries, they gain valuable orientation for decision-making. The lower boundary indicates zones of potential demand where buyers historically demonstrate activity. The upper boundary marks areas of supply where sellers typically take profits or initiate short positions. Understanding these dynamics significantly enhances trade execution quality. To understand this topic more deeply, I recommend studying the anatomy of a trend.
Anatomy of a Price Channel
Every price channel comprises two parallel lines that delineate the trajectory of price movement. The support line traverses the lower extremes of the chart, representing levels where buying pressure exceeds selling pressure. At these points, market participants perceive prices as attractive for accumulation, triggering upward rebounds in quotations.
The resistance line connects upper extremes and symbolizes the barrier where supply begins overwhelming demand. Sellers become active at these marks, considering current prices elevated or sufficient for profit-taking. The interaction between these two forces creates the characteristic wave-like movement within the channel structure.
Channel reliability correlates directly with the number of touch points. The minimum requirement stands at two points for each line, though three or more touches substantially increase the statistical significance of boundaries. Seasoned analysts also consider the formation timeframe: long-term structures on weekly charts possess greater predictive power than short-term formations on minute intervals.
Classification of Trend Channels
Market practice distinguishes three fundamental channel varieties, each reflecting a specific state of equilibrium between bulls and bears. Grasping these distinctions proves critical for selecting appropriate trading tactics.
Ascending Channel
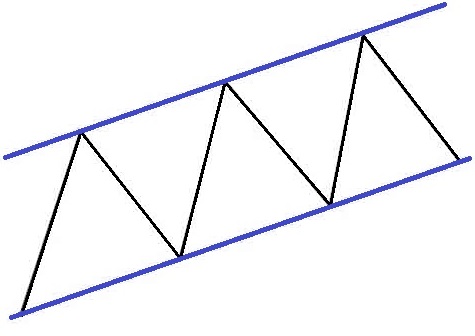
An ascending channel features positive slope on both boundaries and indicates buyer dominance. In this configuration, each successive high exceeds its predecessor, while lows similarly rise in sequence. This pattern signals sustained bullish market sentiment and creates favorable conditions for long positions.
Descending Channel
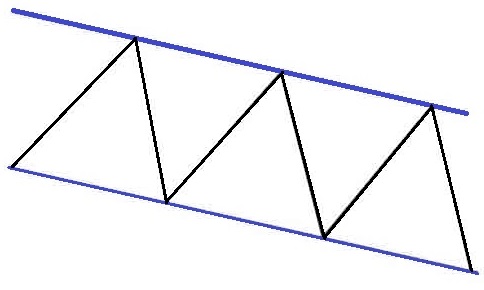
A descending channel displays opposite dynamics: boundaries slope downward, with highs and lows declining progressively. Such structure indicates seller predominance and bearish participant sentiment. Within this pattern, priority shifts toward short positions aligned with overall directional movement.
Horizontal Channel
A horizontal channel, also termed consolidation or ranging market, forms when boundaries align horizontally. Bull and bear forces exist in relative equilibrium, with price oscillating within a confined range without pronounced directionality. Such periods often precede impulsive movements and demand particular caution during trading.
Channel Construction Methodology
Proper trend channel construction demands systematic approach and careful analysis of price extremes. The working algorithm depends on identified trend type and involves sequential execution of specific steps.
When working with uptrends, initially identify two consecutive lows where the second positions higher than the first. These points connect via a straight line forming the support boundary. Subsequently, locate the high between these lows and draw a parallel resistance line through it. Ensuring strict parallelism between boundaries represents a key criterion for construction validity.
For downtrends, logic mirrors inversely. Starting points become two consecutive highs with declining trajectory. The connecting line forms resistance. A parallel support line passes through the intermediate low. Channel validation occurs through parallelism verification and presence of additional touch points. Before proceeding, please review the key levels.
Horizontal channel construction involves identifying horizontal levels of extreme concentration. Traders seek zones where price repeatedly reversed and draw horizontal lines through them. Quality horizontal channels feature clear boundaries with multiple confirmations.
Strategic Trading Approaches
Trend channels unlock two fundamentally different profit scenarios: working within the range and trading channel breakouts. Selection between them depends on market context, personal trader preferences, and risk tolerance.
Range Trading
Classical range trading strategy involves opening positions when price reaches one of the boundaries. In ascending channels, priority goes to purchases near the support line with targets at resistance. Descending channels create conditions for short sales from the upper boundary with profit-taking near the lower.
Waiting for confirmation signals before position entry proves critically important. Reversal candlestick patterns (pin bars, engulfing patterns, hammers), oscillator readings (RSI in overbought or oversold zones), and volume spikes substantially increase successful trade probability. Isolated boundary touches without additional filters frequently lead to false breakouts and losses.
Breakout Strategies
Price exit beyond channel boundaries often signals market paradigm shift or acceleration of existing trend. Breakout trading involves awaiting candle close beyond the channel boundary followed by entry in breakout direction. Level retest serves as additional filter: price return to the broken line before movement continuation.
Volume analysis plays key role in breakout validation. Genuine breakouts accompany significant trading activity increases, while false ones characterize by low volumes and quick range return. ATR indicator usage helps assess volatility and establish adequate stop-losses.
Practical Application Aspects
Trend channel effectiveness largely depends on adhering to practical principles. Timeframe selection significantly impacts signal quality: higher timeframes generate more reliable patterns while filtering short-term market noise.
Integrating channels with other analytical tools substantially improves forecast accuracy. Fibonacci levels , moving averages, and momentum indicators organically complement channel analysis. Signal convergence from multiple independent sources forms confluence zones: areas with elevated reversal or continuation probability.
Capital management remains the cornerstone of successful trading. Stop-losses position beyond channel boundaries accounting for current instrument volatility. Optimal reward-to-risk ratio stands at minimum two-to-one, ensuring positive system expectancy even with moderate winning trade percentage.
Common Mistakes and Prevention Methods
Beginning traders frequently commit characteristic errors when working with price channels. Subjective line drawing without relying on objective extremes leads to distorted market perception. Each boundary must base on actual price reversal points rather than analyst wishful thinking.
Ignoring macroeconomic context poses serious position threats. Important economic releases can instantly destroy technical constructions. Before opening trades, checking the event calendar and avoiding entries immediately before significant data publications proves advisable.
Excessive trading without clear confirmations systematically destroys trading accounts. Each boundary touch does not constitute automatic action signal: patient waiting for additional filters remains essential. Discipline and adherence to predetermined rules distinguish professionals from gamblers. I also recommend studying the triangle figure for a complete picture.
Market-Specific Application Features
Trend channel universality allows application across any financial venue, though each market possesses its specifics. The Forex currency market characterizes by high major pair liquidity, facilitating clear channel structure formation. Optimal results achieve on four-hour and daily charts.
Stock markets offer broad instrument spectrum with varying volatility. Large company shares form more predictable channels, while second-tier securities tend toward sharp fluctuations. Accounting for corporate reporting and dividend events enhances analysis effectiveness.
Cryptocurrency segment distinguishes by elevated volatility, leading to wider channel formation. False breakouts occur more frequently here, requiring more conservative entry parameters and reinforced risk management. Volume indicators gain particular significance for signal filtration.
Concluding Recommendations
Trend channels represent time-tested analytical tools accessible to traders of any preparation level. Their visual clarity combines with practical effectiveness under proper application conditions. Systematic construction approach, patient confirmation waiting, and strict risk management form profitable trading foundation.
Starting channel mastery on demonstration accounts while gradually honing pattern identification and position entry skills proves recommended. Maintaining trading journal with all trade records allows identifying individual strategy strengths and weaknesses. Continuous learning and adaptation to changing market conditions guarantee long-term trading success.
FAQ: Frequently Asked Questions About Trend Channels
A trend channel is a technical analysis tool consisting of two parallel lines that contain price movement. The lower line (support) connects local lows, while the upper line (resistance) connects highs. Channels help determine trend direction and identify optimal entry points.
There are three main types: ascending channel (bullish trend with rising highs and lows), descending channel (bearish trend with declining extremes), and horizontal channel (range-bound sideways movement within a defined price band).
For an ascending channel: identify two consecutive lows (second higher than first), connect them with a support line, then draw a parallel resistance line through the high between them. For descending channels, use the same approach but start with highs.
Two primary strategies: range trading within the channel (buying at support, selling at resistance) and breakout trading (entering after a candle closes beyond the channel boundary with volume confirmation). Experienced traders often combine both approaches.
Higher timeframes provide more reliable signals: daily (D1), weekly (W1), and monthly (MN). They filter market noise and reveal significant price movements. Lower timeframes (M5, H1) suit scalping but require additional confirmation.
About the Author
Author: Igor Arapov — independent researcher in trading psychology and behavioral finance, practising trader since 2013, founder of arapov.trade, author of a trading book series (Open Library ), (ORCID: 0009-0003-0430-778X ).