Understanding Timeframes and Their Critical Importance
A timeframe represents the time interval over which a single candlestick or bar forms on a price chart. On a one-minute chart, each element displays price movement over sixty seconds; on a daily chart, it represents an entire trading day. Before proceeding, please familiarize yourself with the basics of technical analysis .
The choice of time interval defines the entire character of your trading: trade frequency, volume of information to analyze, stress levels, and potential profitability. A trader on a five-minute chart executes dozens of operations daily, while an investor on weekly charts might open one position per month.
Proper timeframe utilization allows filtering market noise — chaotic fluctuations that carry no useful information. Noise is maximum on lower intervals and minimum on higher ones. Understanding this principle helps avoid false signals and make informed decisions.
Professional traders rarely limit themselves to a single timeframe. They analyze markets across multiple levels, gaining a comprehensive picture of what is happening. This approach is called multi-timeframe analysis and significantly improves trading decision accuracy. I also recommend studying the trading basics for a complete picture.
Classification of Time Intervals
All timeframes divide into three categories, each corresponding to a specific trading style and requiring particular skills.
Short-term intervals cover the range from M1 to M30. Minute charts are used in scalping — an aggressive trading style with numerous quick trades. The five-minute timeframe remains most popular among scalpers due to its balance between speed and signal readability. Fifteen-minute and thirty-minute intervals suit intraday trading with moderate activity.
Medium-term timeframes include hourly H1 and four-hour H4. The hourly chart is considered optimal for beginners: it provides sufficient time for analysis while generating adequate trading opportunities. The four-hour interval proves effective for swing trading — a style involving positions held from several days to weeks.
Long-term intervals are represented by daily D1, weekly W1, and monthly MN charts. The daily chart forms the analytical foundation for most professionals. Weekly and monthly timeframes serve for identifying global trends and macroeconomic analysis. Position traders and investors work predominantly at these levels.
Matching Timeframe to Trading Style
Each trading style imposes specific requirements for time interval selection. Mismatch between strategy and timeframe represents one of the main reasons for beginner failures.
Scalping demands working on intervals from M1 to M15. Traders execute dozens of trades per day, capturing small profit from each. This style assumes constant presence at the monitor, instant reaction to changes, and high stress tolerance. Commissions and spreads significantly impact final results.
Intraday or day trading utilizes M15-H1 intervals. Positions open and close within a single trading session. Traders analyze markets several times daily, requiring less intensity compared to scalping. This style suits those who can dedicate several hours daily to trading.
Swing trading operates on H4 and D1. Positions are held from several days to several weeks. Traders seek medium-term movements and do not react to short-term fluctuations. This approach is compatible with regular employment or studies, requiring market analysis only once or twice daily.
Position trading uses weekly and monthly charts. Trades are held for months, sometimes years. Traders follow global trends and fundamental factors. Minimal time for analysis, minimal stress, but requires significant capital to comfortably weather drawdowns. In addition, it's useful to understand market charts.
Multi-Timeframe Analysis: Key to Precise Entries
Professional market approach involves analyzing several time intervals simultaneously. This methodology allows seeing the complete picture and making more informed decisions.
The higher timeframe determines the global direction of movement. If an uptrend is observed on the daily chart, it is logical to look for long position entries. Trading against the higher timeframe trend is possible but requires increased caution and experience.
The middle timeframe identifies key levels and zones of interest. On the four-hour chart, support and resistance levels, consolidation areas, and trend continuation or reversal patterns become visible.
The lower timeframe serves to determine the exact entry moment. After the higher timeframe shows direction and the middle one identifies the zone of interest, the trader moves to the fifteen-minute or thirty-minute chart to find a specific signal.
The classic timeframe ratio involves a multiplier of four to six between levels. For example, the D1-H4-H1 or H4-H1-M15 combination provides a logical analytical structure without information overload.
Trading Sessions and Optimal Trading Time
The forex market operates around the clock five days per week, but activity distributes unevenly. Understanding trading session specifics helps choose optimal working times.
The Asian session is characterized by moderate volatility. Pairs with the Japanese yen, Australian and New Zealand dollars trade actively. Movements are calm, trends develop smoothly. Suits traders preferring a measured pace.
The European session brings significant activity increases. London remains the world largest financial center, and European venue openings often set the direction for the entire day. Euro, pound, and franc demonstrate maximum liquidity.
The American session features the highest volatility, especially during overlap with the European session. The period from 3:00 PM to 7:00 PM GMT is considered most active for most currency pairs. US data releases cause sharp movements.
Scalpers and intraday traders optimally work during session overlaps. Swing traders can analyze markets at any convenient time, focusing on daily candle closes.
Volatility Impact on Timeframe Selection
Volatility is a key parameter to consider when choosing a time interval. It reflects the amplitude of price fluctuations over a specific period.
Highly volatile markets provide more trading opportunities on lower timeframes. Cryptocurrencies with their sharp movements trade effectively on M15-H1. However, high volatility requires adequate risk management and readiness for quick decisions.
Low volatility periods make lower timeframes ineffective. Price moves slowly, spreads consume potential profit. During such times, it is sensible to switch to higher intervals or refrain from trading altogether.
The ATR indicator helps objectively assess volatility. ATR values above average signal increased market activity. Traders use this metric to adapt stop-losses and target levels to current conditions.
Common Timeframe Mistakes and How to Avoid Them
Beginning traders often make characteristic errors that reduce trading effectiveness and lead to losses.
Chaotic switching between timeframes destroys discipline. A trader sees a losing position, moves to a higher timeframe hoping to see a favorable picture, then returns to the lower one. This approach breeds confusion and emotional decisions.
Ignoring higher timeframes removes context. A buy signal on M15 is meaningless if a powerful downtrend develops on D1. Always begin analysis from higher intervals.
Mismatch between timeframe and strategy leads to losses. Attempting to scalp on daily charts or invest on minute charts is doomed to failure. Each strategy is designed for a specific time horizon.
Trading on a timeframe incompatible with personal schedule creates tension. If work prevents constant market monitoring, scalping is technically impossible. Choose an interval compatible with your lifestyle.
Recommendations for Beginning Traders
Newcomers should avoid extreme values on the time scale. Minute charts require lightning-fast reactions and deep understanding of market microstructure. Monthly intervals assume capital capable of withstanding significant drawdowns.
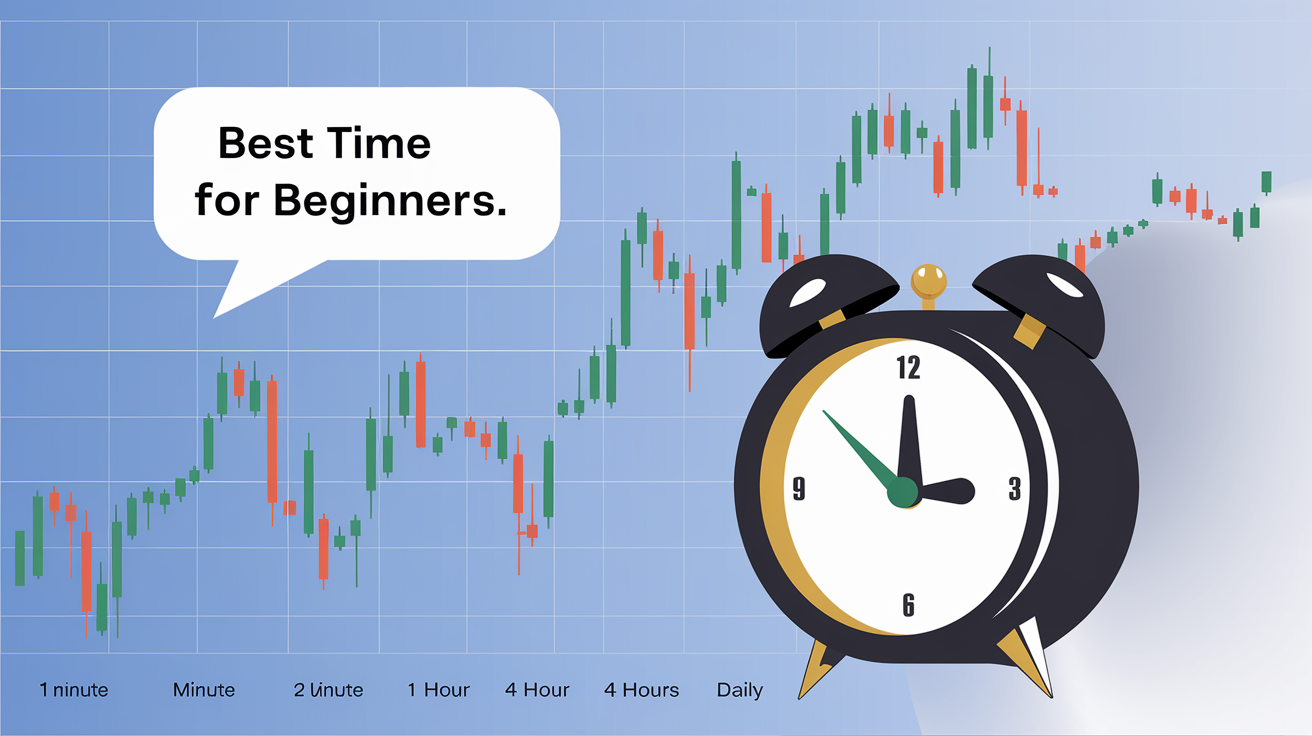
The hourly timeframe represents an optimal starting point for most beginners. It provides sufficient time to analyze each candle, generates understandable signals, and forms stable patterns. Trade count is moderate, allowing thorough work on each one.
The four-hour interval suits those combining trading with other activities. Market analysis two to three times daily suffices for successful trading. Signals are more reliable than on lower timeframes.
The daily chart minimizes time investment. Fifteen to thirty minutes daily is sufficient. This approach builds correct habits and teaches patience — a quality essential for every successful trader.
Conclusion
The timeframe is a fundamental element of any trading system, defining how you interact with markets. Proper time interval selection creates the foundation for consistent results. To consolidate the material, also study the trading rules.
Key principles remain unchanged: matching timeframe to trading style, using multi-timeframe analysis, accounting for volatility and personal schedule. Avoid chaotic switching and trading against higher timeframe trends.
Beginners should master H1 and H4, gradually expanding their arsenal. Demo account testing allows understanding each timeframe characteristics without financial losses. Discipline and consistency matter more than finding the perfect time interval.
Frequently Asked Questions
A timeframe is the time interval over which one candlestick or bar forms on a chart. For example, on H1 each candle shows price movement over one hour, on D1 — over one day.
Beginners should use H1 or H4 timeframes. These provide enough time for analysis, contain less market noise, and generate more reliable signals.
A single timeframe shows only part of the picture. Higher timeframes determine the global trend, middle ones identify zones of interest, lower ones provide entry points. Combining them gives complete market understanding.
Scalpers use M1, M5, and M15. These intervals allow catching short impulses and making many trades per day, but require quick reactions and high concentration.
High volatility creates more opportunities on lower timeframes but also more risk. During low volatility, switching to higher timeframes provides more reliable signals.
About the Author
Author: Igor Arapov — independent researcher in trading psychology and behavioral finance, practising trader since 2013, founder of arapov.trade, author of a trading book series (Open Library ), (ORCID: 0009-0003-0430-778X ).