Wyckoff Method: Understanding Institutional Trading Behavior
The Foundation of Wyckoff Analysis
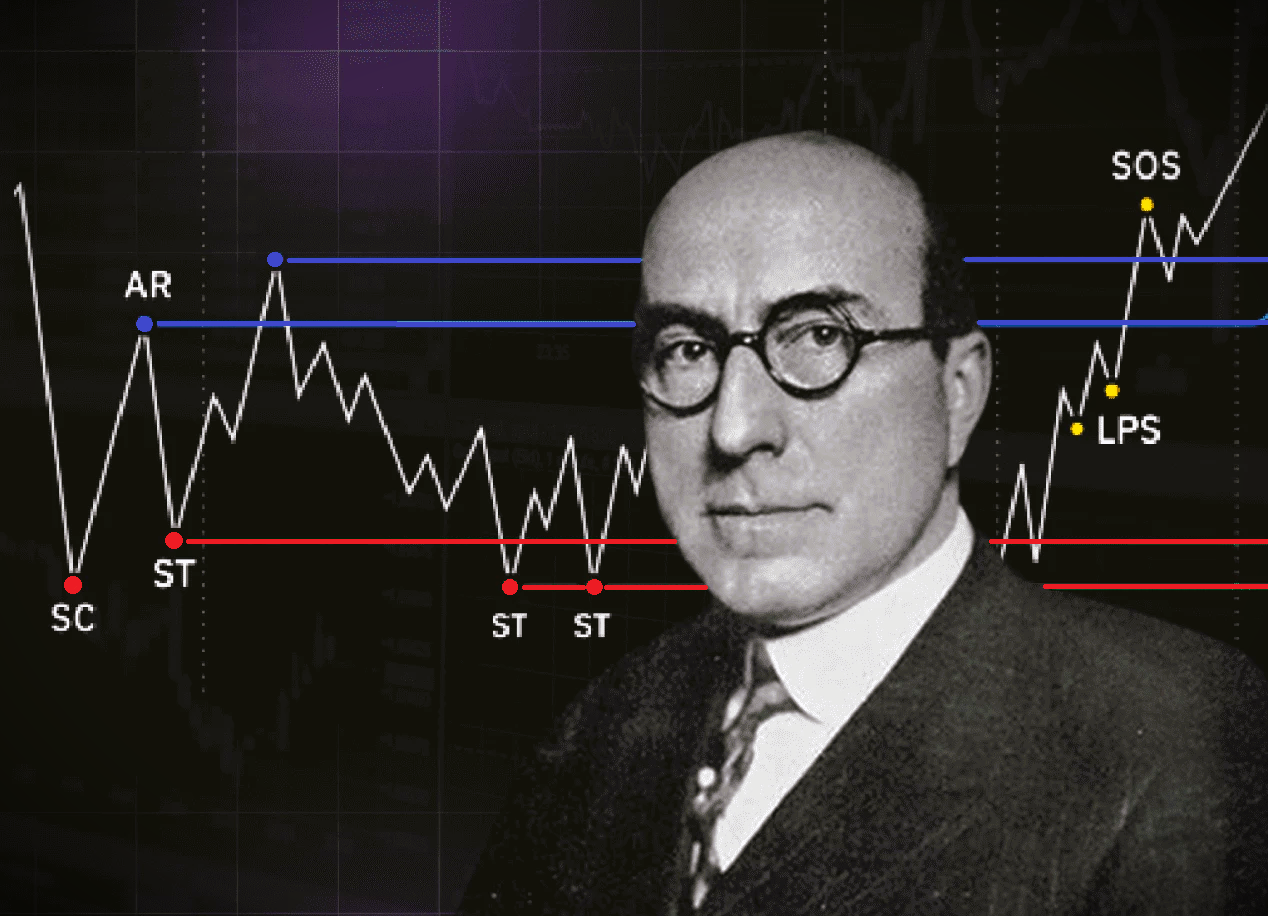
Richard Wyckoff developed his market analysis methodology during the early twentieth century through direct observation of Wall Street's most successful operators. His approach reveals the underlying mechanics of price movement through the lens of supply and demand dynamics. Today's traders apply these principles across stocks, forex, and cryptocurrency markets with remarkable consistency. The methodology's enduring relevance stems from its focus on timeless market mechanics rather than temporary patterns.
The central premise recognizes an inherent imbalance between market participants. Institutional traders command vast resources and informational advantages compared to retail participants. However, their primary constraint lies in managing enormous position sizes that cannot be executed instantaneously without adverse price impact. This necessity forces large operators to accumulate and distribute positions gradually over extended periods while concealing their intentions from the broader market. To understand this topic more deeply, I recommend studying the strategies of major players.
Three foundational principles form the theoretical framework of Wyckoff analysis. The Law of Supply and Demand establishes that price moves in the direction of the dominant force until equilibrium is reached. The Law of Cause and Effect links the duration of preparation phases to the magnitude of subsequent price movements. The Law of Effort versus Result identifies divergences between trading activity and price response, signaling potential exhaustion of the current trend.
Understanding Accumulation Dynamics
The accumulation process unfolds quietly beneath the surface of market awareness. Following an extended decline, price transitions into horizontal movement that appears as market indecision to most observers. In reality, large operators methodically build substantial positions during this period by absorbing selling pressure from discouraged holders. Each wave of liquidation meets hidden demand that maintains price within a defined trading corridor.
Genuine accumulation exhibits progressively diminishing volatility and declining trading volumes over time. Emotional participants exit the market, exhausted by the absence of clear directional movement. Patient institutional buyers continue acquiring positions while avoiding sudden moves that might attract unwanted attention. The narrowing price range creates compression energy that eventually fuels the subsequent impulse.
The spring frequently marks the completion of the accumulation process. Price briefly penetrates below the established support zone, creating the illusion of continued bearish momentum. This maneuver serves multiple functions simultaneously: triggering protective stop orders, attracting fresh sellers, and providing large operators final opportunities to accumulate at favorable prices. Rapid reversal back into the range accompanied by notable volume expansion confirms the completion of the accumulation phase.
The secondary test validates the reliability of the preceding formation. Price returns toward the spring zone but on significantly reduced trading activity. The absence of aggressive selling pressure demonstrates that supply has been exhausted through prior buying waves. Formation of a higher low relative to the spring point confirms readiness for upward movement and creates favorable entry opportunities for position traders.
The markup phase begins with decisive price movement beyond the upper boundary of the accumulation range. The breakout accompanied by substantial volume expansion confirms institutional participation. Subsequent price action demonstrates sequential higher highs and higher lows, forming the characteristic staircase pattern of healthy uptrends. Each pullback terminates above the previous swing low, maintaining bullish market structure.
Distribution and Downtrend Formation
Distribution represents the mirror image of accumulation occurring at market tops. After sustained price advances, quotations enter a consolidation phase at elevated levels. Superficially, the situation resembles healthy consolidation before trend continuation. However, informed participants gradually transfer their holdings to late buyers attracted by prior gains. Each rally attempt meets hidden supply that prevents further price appreciation.

The upthrust develops during the final stages of distribution as a trap for optimistic buyers. Price briefly exceeds the upper range boundary, generating enthusiasm and fresh buying interest. Late participants establish positions at unfavorable prices, providing liquidity for institutional sellers. Sharp reversal back into the range accompanied by expanding selling volume signals distribution completion.
The sign of weakness manifests through impulsive decline on elevated trading activity. Price rapidly reaches or penetrates the lower range boundary, demonstrating seller dominance. Subsequent bounce occurs on diminished volume and fails to reach the previous high. Formation of a lower high confirms the shift in market balance toward bearish control.
The markdown phase demonstrates sequential decline in price extremes according to bearish structure. Each bounce terminates below the previous swing high, creating the descending staircase pattern. Volume expands on impulsive decline waves and contracts notably during corrective rallies. Short positions are established on bounces toward previously broken support levels now functioning as resistance.
Volume Analysis in Wyckoff Methodology
Volume analysis serves as the primary confirmation tool for price movements within the Wyckoff framework. Price changes lacking corresponding volume validation often prove false or temporary. Expanding volume during directional price movement demonstrates broad participation and confirms trend strength. Contracting activity during continued movement warns of potential reversal.
The volume profile visualizes trading activity distribution across different price levels. Zones of maximum volume concentration form value areas representing balance between opposing market forces. Price departure from value areas typically triggers impulsive movement in the breakout direction. Return into the value zone suggests false breakout conditions.
Volume delta reveals the predominance of aggressive buying or selling during each trading period. Positive values indicate dominance of market-order buyers executing at asking prices. Negative readings suggest selling pressure through market orders. Divergence between price direction and delta sign warns of potential trend reversal.
Cluster analysis details trade distribution within each price candle. Large prints at specific levels indicate institutional interest. Volume accumulation near candle extremes often precedes continuation in the corresponding direction. Absence of significant transactions may suggest manipulative price action lacking genuine commitment.
Practical Trading Strategies
Trading from accumulation requires identification of horizontal ranges following extended price declines. Traders await spring formation with subsequent return into the trading corridor. Long position entry follows pullback confirmation through rising trading volumes. Protective stops are placed below spring lows with modest buffer to avoid premature stopout.
Working with distribution phases demands recognition of weakening uptrend characteristics at market tops. Horizontal range formation after advances suggests potential position distribution. The upthrust confirms institutional selling intentions. Short positions are established after price returns into the range on elevated selling volume.
Breakout trading applies when price decisively exits consolidation zones. Genuine breakouts are accompanied by substantial volume expansion and volatility increase. Retest of the broken level with decreasing activity creates optimal entry with tight protective stops. Stop orders are placed beyond the range boundary on the opposite side of the breakout.
Wyckoff Method in Cryptocurrency Markets
Digital assets demonstrate pronounced Wyckoff patterns due to concentrated ownership among limited large holders. Whales establish characteristic accumulation zones before significant pump movements, allowing attentive traders to position ahead of major impulses. The methodology effectively identifies institutional footprints across various market capitalizations.
Manipulative activity becomes especially visible on low-liquidity altcoins with modest market caps. Sharp price movements on anomalous volume often indicate artificial liquidity creation to attract retail participants. Wyckoff's volume concept helps distinguish organic accumulation from manipulative schemes and avoid large operator traps.
Multi-timeframe analysis substantially improves trading signal accuracy. Higher timeframe structure determines priority trading direction and overall context. Lower timeframes refine entry points within the larger structural framework. Signal confluence across multiple intervals significantly increases trade success probability.
Common Mistakes and Recommendations
Premature accumulation identification represents a common beginner error. Not every market consolidation concludes with upward breakout and trending behavior. Traders must await confirming signals including the spring and subsequent volume expansion on upward price movement. Hasty action leads to entries on false formations and consecutive losses.
Ignoring higher timeframe context regularly produces losing trades. Local accumulation within a global downtrend rarely produces sustained substantial rallies. Priority always favors the direction established on higher timeframes when selecting trade direction.
Underestimating volume confirmation importance substantially reduces trading effectiveness. Breakouts without accompanying activity expansion often prove false and reverse. Every trading signal requires mandatory validation from volume-based indicators to increase trade reliability. I recommend that beginners first study volumes in trends .
Capital management determines long-term trading profitability regardless of methodology. Risk per trade is limited to two percent of account equity. Reward-to-risk ratio maintains minimum three-to-one proportion. Stop orders are moved to breakeven after reaching intermediate profit targets.
The Wyckoff methodology remains a relevant market analysis tool over a century after its creation. Understanding the mechanics of institutional and retail participant interaction enables informed trading decisions. Combination with modern volume analysis tools substantially amplifies the effectiveness of this classical approach to market understanding.
Conclusion
The Wyckoff Method reveals the hidden logic of markets, demonstrating how institutional players manipulate prices through phases of accumulation, distribution, and neutral activity. Understanding these cycles transforms market perception—what appears as chaos to most traders becomes an orderly sequence for the prepared analyst.
Practical application requires patience and discipline. Recognizing accumulation and distribution phases enables entry with maximum probability of success while avoiding false breakouts and market traps. Analyzing volume, price ranges, and behavior at key levels provides objective signals for trade execution. To reinforce the material, also study the market auction .
Combining Wyckoff methodology with modern technical analysis and sound risk management creates a powerful trading system. Practice identifying characteristic patterns on demo accounts, respect the logic of major operators, and maintain unwavering discipline to your strategy. Success belongs to traders who understand that markets represent a perpetual battle between institutions and retail participants—and the advantage goes to those capable of reading the footprints left by big money.
Frequently Asked Questions
The Wyckoff Method is an analytical framework for understanding institutional market behavior through price and volume analysis. It helps traders identify accumulation and distribution phases where large operators build or liquidate positions, enabling retail traders to align with smart money movements.
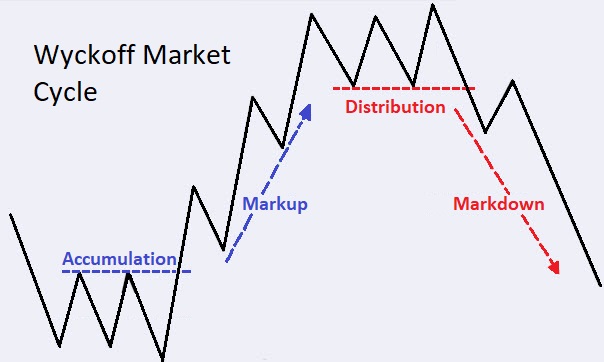
Wyckoff identifies four market cycle phases: Accumulation (smart money building positions), Markup (uptrend phase), Distribution (smart money exiting positions), and Markdown (downtrend phase). Each phase displays distinct characteristics in price structure and volume behavior.
A Spring is a false breakdown below support in an accumulation range designed to trigger stop losses and attract sellers. Smart money uses this liquidity to complete position building. Price quickly reverses back into the range with increasing volume, confirming accumulation completion.
Volume confirms price movements in Wyckoff analysis. Rising volume on price advances indicates trend strength, while declining volume suggests weakness. Volume profile reveals value areas, and delta volume shows buying or selling dominance to validate trading signals.
The Wyckoff Method works exceptionally well on cryptocurrency markets due to concentrated ownership among large holders. Whales create distinct accumulation zones before major rallies. The methodology helps traders distinguish organic accumulation from manipulation and avoid common traps.
About the Author
Author: Igor Arapov — independent researcher in trading psychology and behavioral finance, practising trader since 2013, founder of arapov.trade, author of a trading book series (Open Library ), (ORCID: 0009-0003-0430-778X ).