Price Action represents a method of analyzing financial markets that focuses on studying price movement without using technical indicators. This approach enables traders to make informed decisions relying exclusively on information contained within price charts. The method helps identify market tendencies, determine key price zones, and forecast potential reversals. In this material, we will thoroughly examine the essence of Price Action, fundamental analysis principles, popular candlestick patterns, and effective trading strategies.
What is Price Action?
Price Action literally translates to price movement — it is a chart analysis technique that studies price behavior in the past and present to forecast future dynamics. The fundamental concept of this method is based on the assertion that price reflects all available market information: economic data, news background, and actions of institutional and retail participants. Traders practicing Price Action work with clean charts, rejecting indicators such as MACD, RSI, or moving averages.
The method's versatility allows application across all types of financial markets: the Forex currency market, stock exchanges, cryptocurrency platforms, and commodity markets. Price Action is effective on any timeframe — from minute charts for scalping to monthly ones for strategic investing. The method helps understand market psychology, identify buyer and seller sentiments, and find optimal points for executing trades.
Key Elements of Price Action
The Price Action method relies on several fundamental components that form the foundation of the analytical process. Understanding these elements enables traders to correctly interpret charts and find high-probability trading opportunities.
Support and Resistance Levels
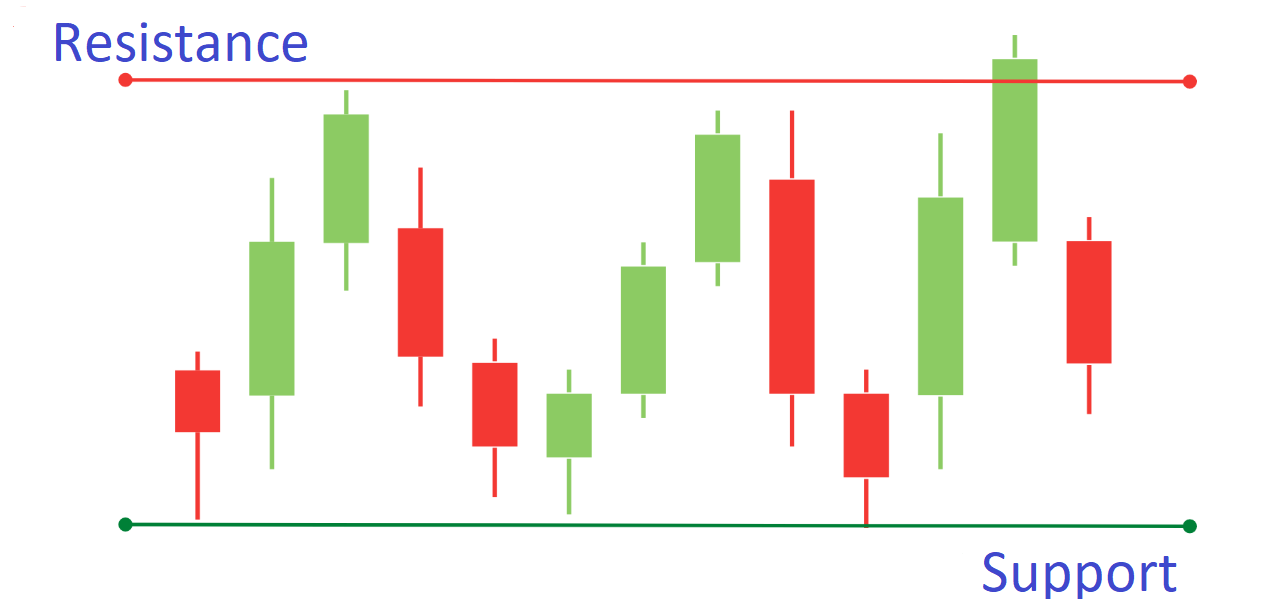
Support and resistance levels represent horizontal price zones where the market demonstrates characteristic behavior. Support is an area where buyer activity exceeds seller pressure, halting price decline. Resistance is a zone where sellers dominate buyers, preventing further price appreciation.
These levels form based on historical price behavior. When quotes repeatedly bounce from a certain price mark, it acquires significance in market participants' perception. Traders use levels to find entry points, place protective orders, and take profits. An important feature: after a breakout, support can transform into resistance and vice versa — this phenomenon is called level polarity change.
Price Action Candlestick Patterns
Candlestick patterns represent characteristic combinations of Japanese candles that reflect market sentiment and indicate potential reversals or trend continuation. They constitute the central element of Price Action as they visualize market participant actions at specific moments in time.
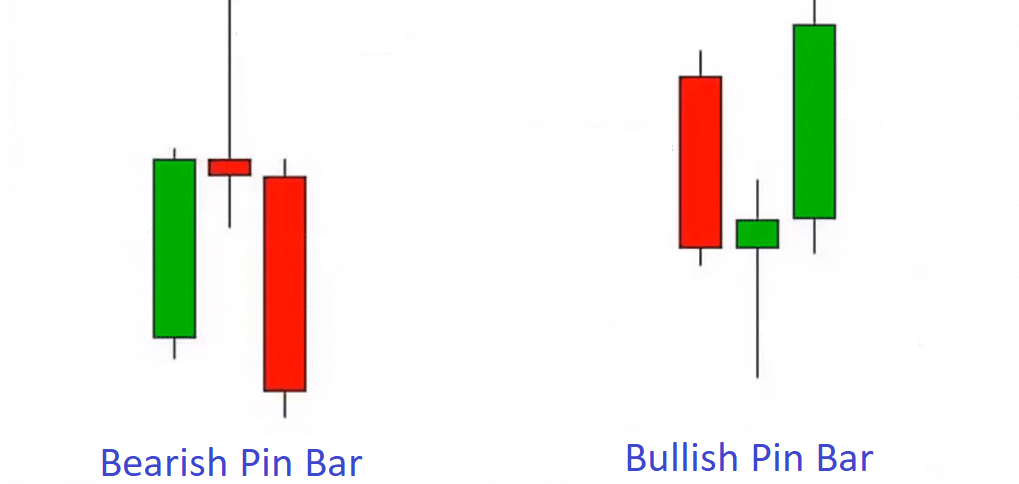
Pin Bar
Pin bar is one of the most common reversal patterns. It is characterized by a long wick, small body, and short opposite wick. The long wick demonstrates that price was rejected by the market at a certain level. A bullish pin bar forms at the bottom of a move with a long lower wick, indicating buyer strength. A bearish pin bar appears at tops with a long upper wick, signaling seller pressure.
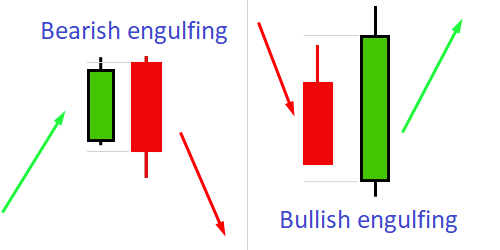
Engulfing Pattern
The engulfing pattern consists of two candles where the second completely covers the body of the first. Bullish engulfing forms when a rising candle covers the preceding falling one — this is a buy signal. Bearish engulfing occurs in the opposite situation and indicates potential decline. The pattern is most effective near key levels or after prolonged trend movement.
Inside Bar
Inside bar is a candle whose range is completely positioned within the range of the previous mother candle. The pattern indicates market consolidation and often precedes impulsive movement. Traders enter positions upon breakout of the mother candle's high or low. Inside bar is particularly effective in trending markets and near significant price levels.
Trend Identification
Trend identification is a critically important skill for a Price Action trader. An uptrend is characterized by a sequence of higher highs and higher lows, reflecting buyer dominance. A downtrend demonstrates the opposite picture with declining extremes. Sideways movement or ranging is characterized by horizontal price oscillation without a clear direction.
To determine trends, traders analyze chart structure, identifying sequences of swing highs and swing lows. Price Action also helps identify early signs of trend reversal — for example, when lower highs begin forming in an upward movement.
Price Action Trading Strategies
Level Trading
Support and resistance levels form the foundation of Price Action trading. Traders use them to find entry points on bounces or breakouts. When trading bounces, positions are opened when price touches a level and shows reversal signs through a characteristic candlestick pattern. When trading breakouts, entry is executed after confident level penetration with strong momentum.
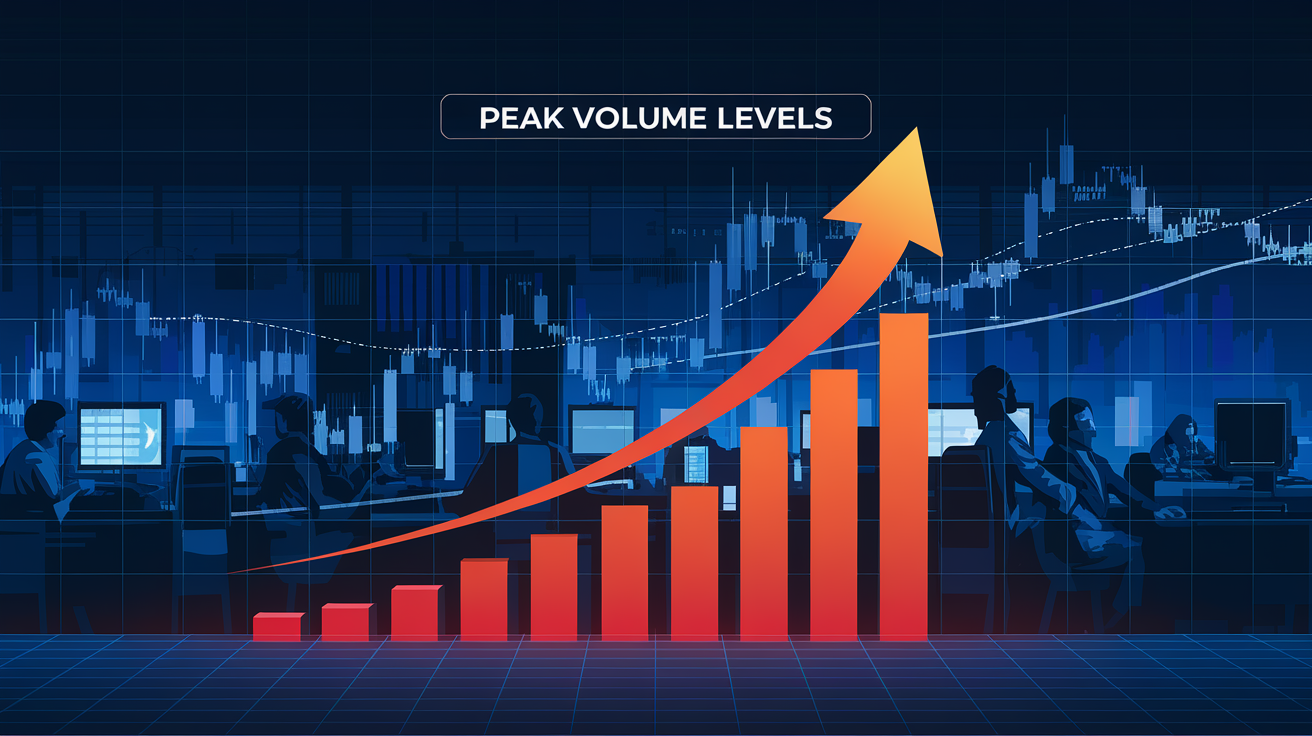
To improve signal accuracy, traders combine levels with other analysis elements. For example, a pin bar at a significant support level substantially increases the probability of a successful bounce. Additional confirmation can come from increased trading volumes during pattern formation.
Trend Trading
Trend following is recognized as one of the most reliable strategies. Traders seek entry points in the direction of the main movement, using corrections and pullbacks. In an uptrend, long positions are opened on pullbacks to support levels or correction zones where confirming patterns form. Similarly, in a downtrend, sales are executed on pullbacks to resistance.
Extreme structure analysis is applied to determine trend strength. A trend is considered strong while the sequence of rising (or falling) highs and lows is maintained. Appearance of opposite signs may signal movement weakening or approaching reversal.
Breakout Trading
Breakout strategy is based on entering positions when price overcomes a significant level or consolidation boundary. Inside bar is often used for breakout trading: the trader sets pending orders above and below the mother candle, awaiting impulsive range exit. Stop-loss is placed beyond the opposite side of the pattern.
Distinguishing true breakouts from false ones is important. A false breakout occurs when price temporarily overcomes a level but quickly returns. Experienced traders use false breakouts as signals to enter in the opposite direction, placing stop-loss beyond the false movement extreme.
Practical Application of Price Action
Effective use of Price Action requires consideration of multiple factors: selecting appropriate timeframes, analyzing market context, confirming signals, and competent risk management. Scalpers work on minute charts, swing traders prefer four-hour and daily timeframes, long-term investors analyze weekly charts.
Before opening a position, it is necessary to evaluate the overall market structure. In a strong downtrend, bullish patterns are less reliable since the main pressure comes from sellers. Using higher timeframes to determine global direction and lower ones for precise entry improves trading decision quality. Market volatility and news background should also be considered.
Advantages and Limitations of the Method
Unquestionable advantages of Price Action include analysis simplicity without the need to study complex indicators, universal applicability across any markets and timeframes, understanding participant psychology through price formations, and absence of signal lag. The method allows seeing the real market picture and major players' actions through candlestick patterns.
At the same time, Price Action has certain limitations. Pattern interpretation is subjective and depends on trader experience. Beginners find it difficult to distinguish significant signals from market noise. Without considering context, patterns often produce false signals. The method requires substantial practice and continuous analysis skill improvement.
Recommendations for Successful Trading
To achieve stable results when trading with Price Action, follow proven principles. Begin mastering the method on a demo account, analyzing historical data and practicing pattern recognition. Keep a trading journal, recording all trades with detailed descriptions of entry conditions, results, and conclusions. Focus on significant levels where price demonstrated characteristic behavior multiple times.
Always analyze market context before making trading decisions. Use an economic calendar to track important events that could cause sharp volatility. Maintain strict discipline, entering trades only with clear confirmed signals. Limit risk per trade to one to two percent of trading capital and maintain a risk-to-reward ratio of at least 1:2.
Conclusion
Price Action represents a powerful analytical tool that enables traders to find profitable opportunities based on pure price movement. By mastering support and resistance levels, candlestick patterns, and trend analysis principles, you will gain a solid foundation for trading any financial markets. The method requires practice and discipline, but with a systematic approach, it becomes an effective tool for consistent trading profits.
Frequently Asked Questions
Price Action is a technical analysis method based on studying price movement without using indicators. Traders analyze clean price charts, candlestick patterns, support and resistance levels to make trading decisions. The method helps understand market psychology and actions of major players.
Main Price Action patterns include: pin bar (candle with long wick signaling reversal), engulfing (candle completely covers the previous one), inside bar (candle within previous candle's range), doji (market indecision). These patterns are most effective at key support and resistance levels.
Support and resistance levels are identified by historical points where price repeatedly reversed or consolidated. Support is a zone where buyers stop price decline. Resistance is a zone where sellers prevent price growth. Significant levels are confirmed by multiple touches and high trading volumes.
Price Action advantages: simplicity of analysis without complex indicators, universality for any markets and timeframes, understanding market participant psychology, no signal lag (unlike indicators), ability to see major players' actions through candlestick formations.
To filter false signals: trade patterns only at significant support/resistance levels, wait for signal candle closure, analyze context (trend, volatility), use volume confirmation, avoid trading during major news events, combine multiple timeframes for analysis.
About the Author
Author: Igor Arapov — independent researcher in trading psychology and behavioral finance, practising trader since 2013, founder of arapov.trade, author of a trading book series (Open Library ), (ORCID: 0009-0003-0430-778X ).