Types of Engulfing Patterns
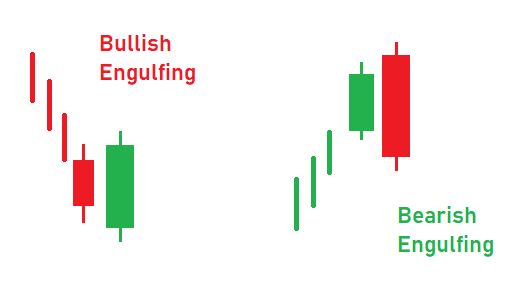
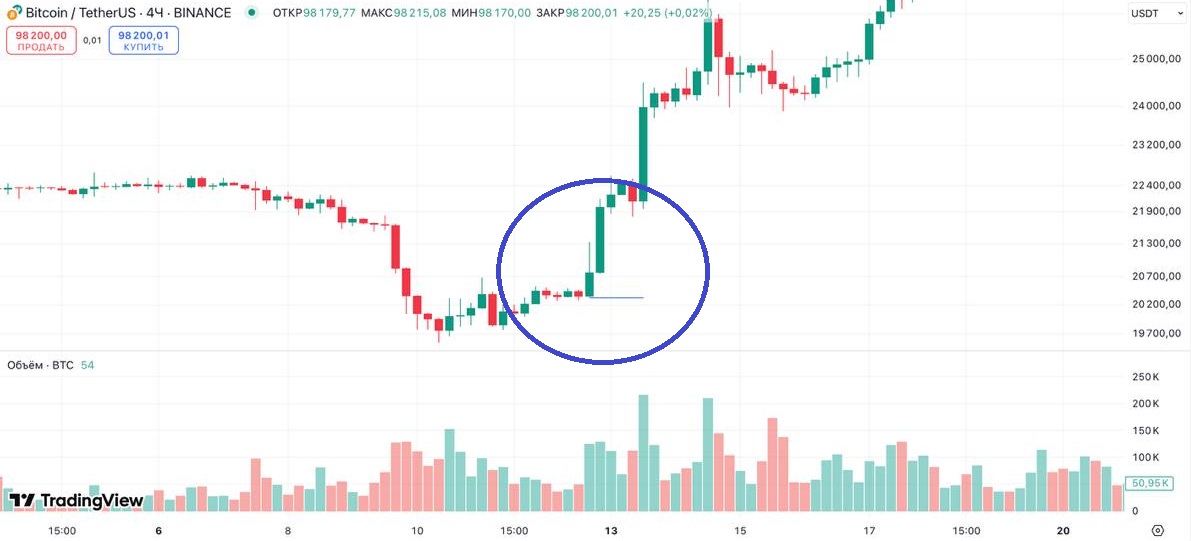
Bullish Engulfing forms at the end of a downtrend. The first candle is bearish, reflecting continued decline. The second candle is bullish, opening below the first candle's low and closing above its high. Buyers demonstrate strength by absorbing all seller pressure from the previous period.
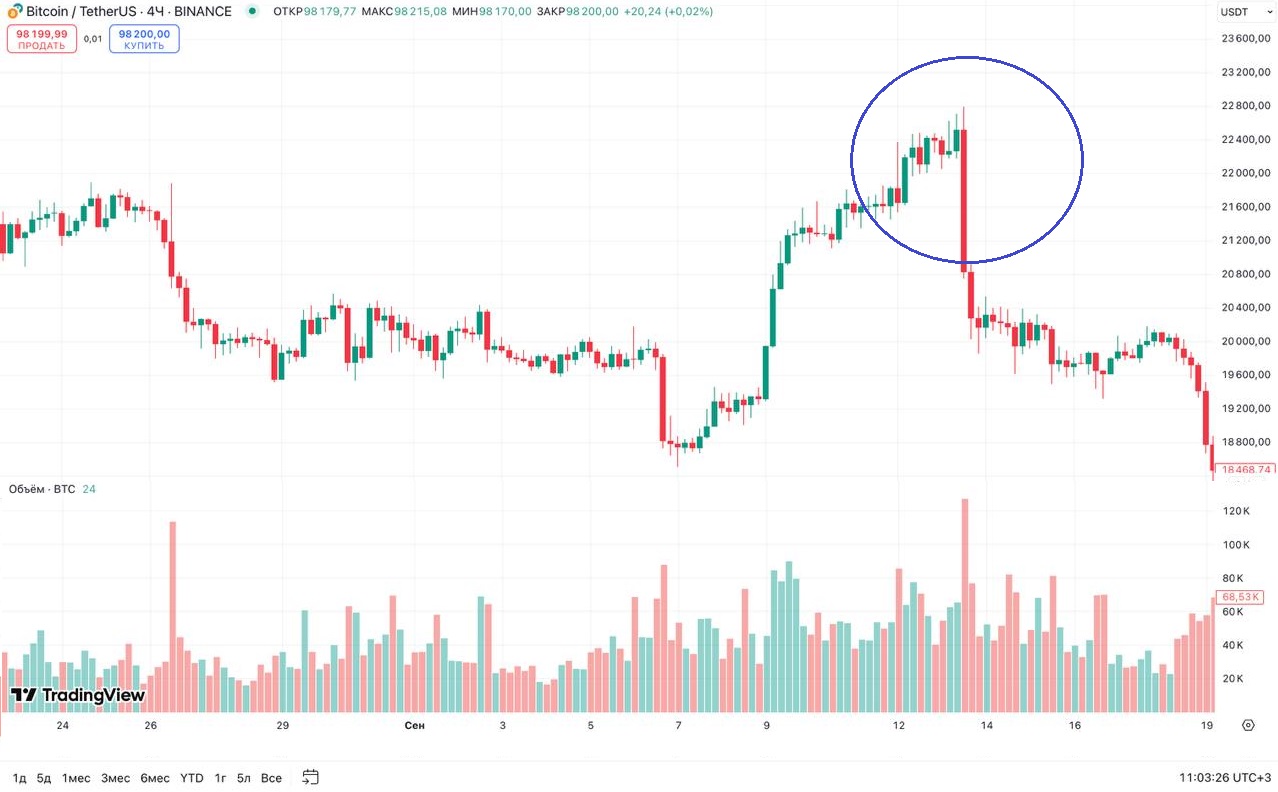
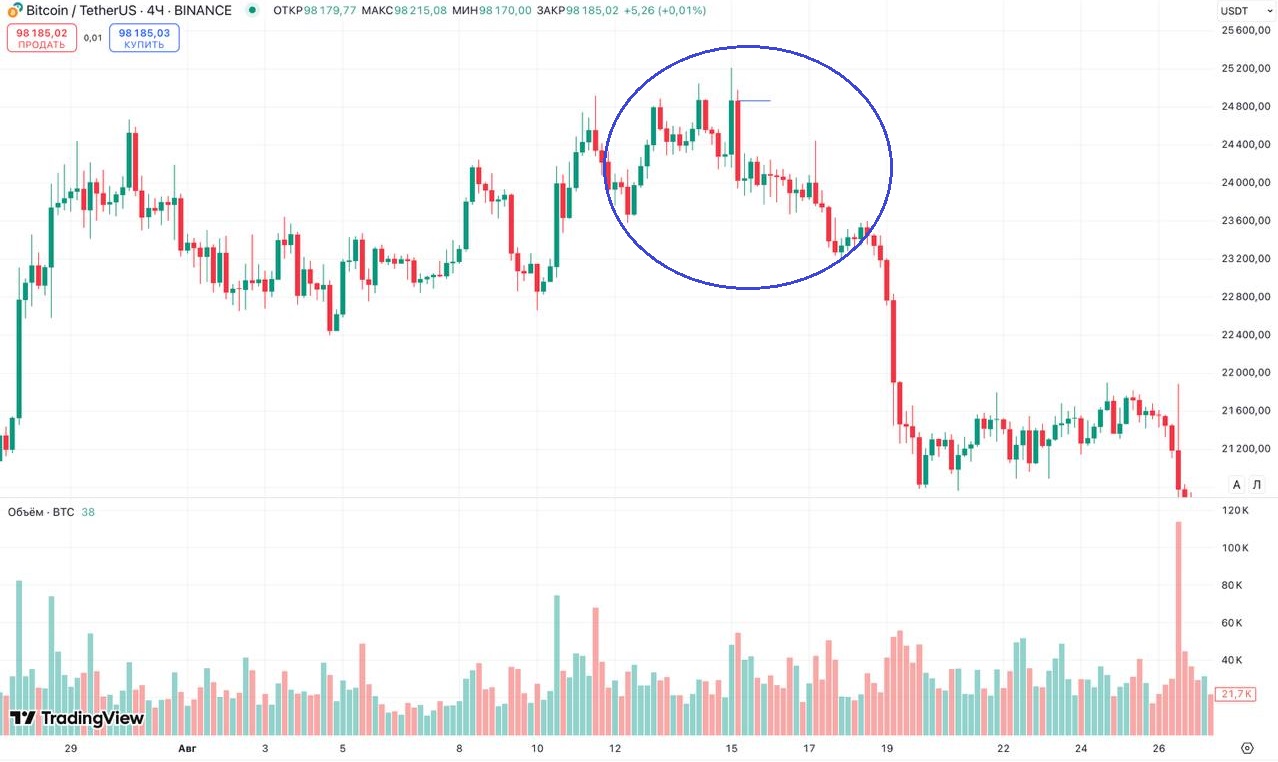
Bearish Engulfing appears at the top of an uptrend. The first candle is bullish, symbolizing continued growth. The second candle is bearish, opening above the first candle's high and closing below its low. Sellers seize initiative, completely suppressing the buying impulse.
Understanding the difference between engulfing the candle body and engulfing the entire candle including shadows is important. Classic definition requires body engulfment — the distance between open and close. Shadow engulfment strengthens the signal but isn't mandatory for market entry.
Conditions for Quality Pattern Formation
Not every engulfing deserves trader attention. A quality pattern forms when several conditions are met. First — presence of a pronounced preceding trend. Bullish engulfing loses meaning in sideways movement where no downtrend exists to reverse.
Second condition — significant size of the second candle. Minimal exceeding of the first candle's body generates a weak signal. Strong engulfing is characterized by the second candle substantially exceeding the first in size. Some traders require at least 1.5 times exceeding.
Third condition — location at key support and resistance levels . A pattern in the middle of a price range has low probability of working out. Engulfing at a historically significant level multiplies the reversal signal strength.
Fourth condition — global trend context. A reversal pattern against a strong trend has lower success probability. Engulfing in the direction of the main movement on a higher timeframe works more reliably.
Volume Confirmation of Signal
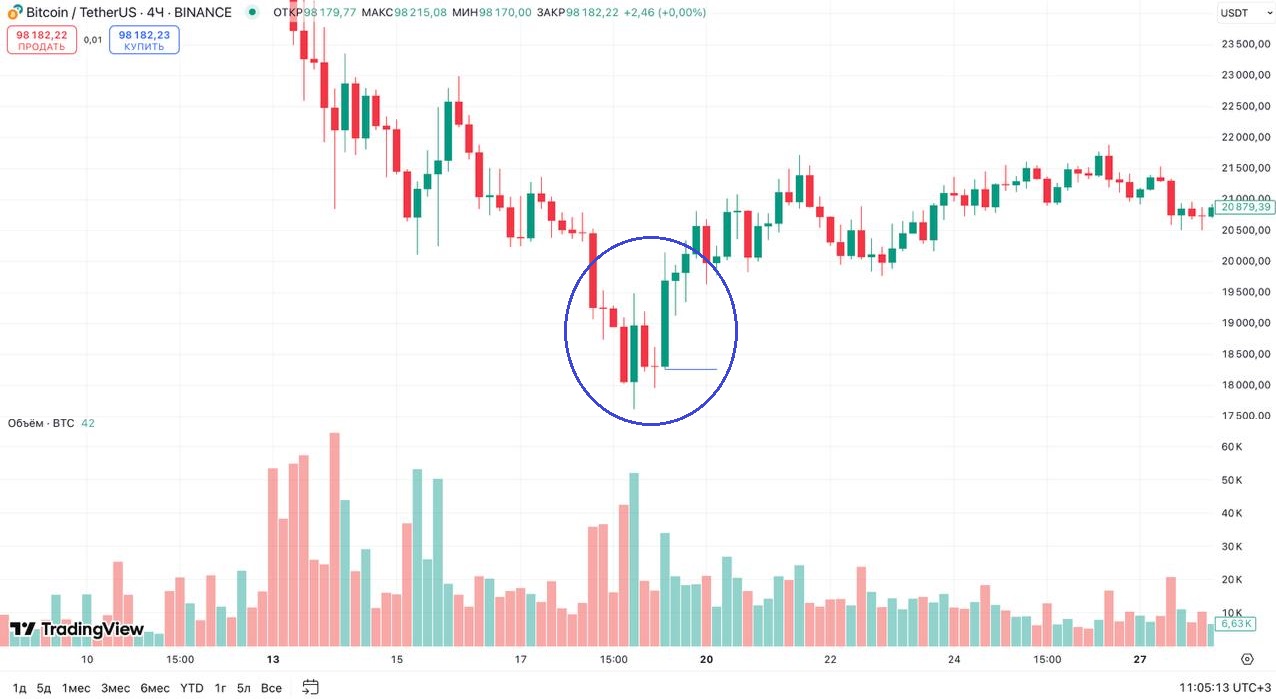
Volume confirmation is critically important for assessing engulfing reliability. A volume spike on the second candle indicates active participation of large players. They aggressively enter the market, reversing the direction and creating momentum for the new trend.
Low volume on the second candle is a warning sign. Possibly this is a correction within a continuing trend rather than its reversal. Volume profile analysis helps identify accumulation and distribution zones that confirm or refute the engulfing signal.
Volume indicators — OBV, A/D Line — provide additional information about movement strength. Divergence between price and volume indicator before engulfing formation strengthens reversal expectation. Convergence confirms the new market direction's strength.
Indicator Confirmation of Pattern
Technical indicators serve as filters for false signals and increase entry accuracy. RSI in oversold zone (below 30) before bullish engulfing strengthens upward reversal probability. RSI in overbought zone (above 70) before bearish engulfing confirms downward reversal potential.
MACD provides information about momentum and its changes. Divergence between price extremes and MACD readings often precedes reversals. MACD line crossover in the direction corresponding to engulfing serves as additional signal confirmation.
Stochastic oscillator helps assess price position relative to recent range. Exit from overbought or oversold zones simultaneously with engulfing formation creates a powerful combined signal for market entry.
Market Entry Strategy
The conservative approach involves entry after the confirming candle closes — the third one. If it continues movement in the engulfing direction, the signal is confirmed. This method reduces false signal risk but reduces potential profit.
The aggressive approach allows entry immediately after the second candle closes. This provides a better entry point and greater profit-to-risk ratio but increases false breakout probability. Aggressive entry is justified with multiple confirmations present.
A compromise option — entry on pullback after pattern formation. Price often returns to the middle of the engulfing candle, providing a more favorable entry point. However, pullback doesn't always occur, and traders risk missing the movement.
Protective Order Placement
Stop-loss for bullish engulfing is placed below the second candle's low. For bearish engulfing — above the second candle's high. This is logical placement: if price breaks through the engulfing candle's extreme in the opposite direction, the pattern is invalidated. To consolidate this material, also study Order Block.
The ATR indicator (Average True Range) helps adapt stop-loss to current volatility. During high volatility periods, stop is set further to avoid knockout by random fluctuation. With low volatility, stop can be tightened.
Take-profit is calculated based on Risk/Reward ratio. Minimum acceptable ratio is 1:2: potential profit twice exceeds risk. First target — nearest Fibonacci level or historical extreme.
Timeframes and Application Markets
The Engulfing pattern is universal and works on any financial instruments. In the Forex market , it's effective on major pairs with high liquidity. The cryptocurrency market generates numerous engulfings due to high volatility.
Timeframe selection affects signal reliability. Engulfing on daily or weekly chart carries significantly more weight than on five-minute chart. Lower timeframes contain more market noise and generate false signals more frequently.
Optimal approach — multi-timeframe analysis. Identify engulfing on higher timeframe, then look for entry point on lower. This aligns strategic direction with tactical trade execution.
Common Trader Mistakes
The main mistake is trading every engulfing without context consideration. A pattern in the middle of range, without volume and indicator confirmation, rarely leads to reversal. Selectivity is key to successful trading with this formation.
Another common mistake — too close stop-loss. Traders seeking to minimize risk place stop at the candle's very extreme. Market noise knocks out position before expected movement begins. Safety margin is necessary.
Ignoring global trend also leads to losses. Bullish engulfing within powerful downtrend often proves to be correction rather than reversal. Smart Money concepts help understand large market participant actions.
Signal Strengthening Factors
Several factors transform ordinary engulfing into high-probability signal. Coincidence with Fibonacci level (38.2%, 50%, 61.8%) significantly increases reliability. Engulfing at psychologically round level attracts more participant attention.
Engulfing of several previous candles represents a powerful signal. When the second candle covers not one but two-three previous ones, this demonstrates exceptional strength of the new direction. Such formations occur less frequently but work out with high probability.
Combination with other candlestick patterns strengthens the signal. Engulfing following a pin bar or doji forms a multi-level reversal structure. Disciplined risk management and psychological stability transform pattern knowledge into consistent profits.
Frequently Asked Questions
The Engulfing pattern is a reversal candlestick formation where the second candle completely covers the body of the previous one. Bullish engulfing signals an upward reversal after a downtrend, bearish engulfing signals a downward reversal after an uptrend.
True engulfing forms at key support or resistance levels and is accompanied by increased trading volume. The second candle significantly exceeds the first in size, and additional indicators confirm the reversal.
The pattern works on all timeframes, but the most reliable signals appear on H1, H4, D1 and higher. Lower timeframes contain more market noise and false signals.
For bullish engulfing, stop-loss is placed below the second candle's low. For bearish engulfing — above the second candle's high. Using ATR for calculating safe distance is recommended.
RSI shows exit from overbought or oversold zones, MACD shows divergence or zero line crossover, volume shows activity spike on the second candle.
About the Author
Author: Igor Arapov — independent researcher in trading psychology and behavioral finance, practising trader since 2013, founder of arapov.trade, author of a trading book series (Open Library ), (ORCID: 0009-0003-0430-778X ).