Trading Indicators: Complete Guide to RSI and MACD
Trading indicators are mathematical tools that transform market data into visual signals for decision-making. They help traders separate emotions from trading and rely on calculations rather than intuition. In the financial markets where millions of transactions occur every second, indicators serve as reliable guides through the complex structure of price movements.
Modern technical analysis fundamentally relies on various indicator types. They process historical data about price, volume, and time, revealing patterns invisible to casual chart observation. However, it's essential to understand: indicators don't predict the future — they help interpret the present situation and evaluate the probability of different market scenarios.
Classification of Trading Indicators
Indicators are categorized based on the problems they solve. Trend indicators — moving averages , ADX, Parabolic SAR — determine the direction of dominant movement. They smooth price fluctuations and show where the market is heading overall. However, trend indicators generate numerous false signals in sideways markets, requiring combination with other tools.
Oscillators — RSI, Stochastic, CCI — fluctuate between fixed values and identify zones of market extremes. When the market reaches overbought or oversold conditions, oscillators warn of a probable reversal. These tools are invaluable in ranging markets but may give premature signals during strong trends.
Volume indicators — Volume, OBV, A/D Line — analyze market participant activity. Volume confirms the strength of price movement: rising prices with increasing volume indicate a sustainable trend, while movement on declining volume suggests weakness. Volatility indicators — ATR, Bollinger Bands — measure the amplitude of fluctuations and help adapt trading strategy to current market conditions.
RSI: Anatomy of an Oscillator
RSI (Relative Strength Index) was developed by Welles Wilder in 1978. The indicator measures the ratio between average gains and losses over a specific period, converting the result into a value from zero to one hundred. The standard calculation period is 14 candles, although traders adapt this parameter to their trading style.
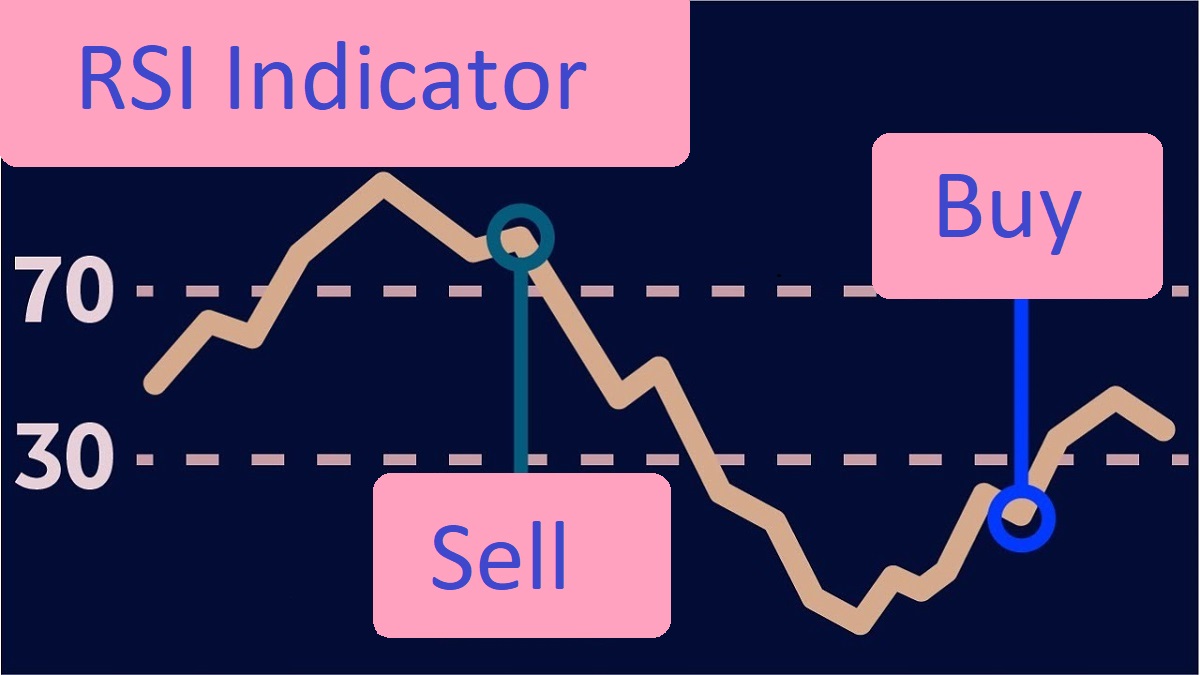
The RSI formula accounts for the average values of positive and negative price changes. When buyers dominate, RSI rises; when sellers prevail, it declines. Values above 70 are traditionally interpreted as overbought — a condition where the asset trades above fair value. Values below 30 indicate oversold — probable undervaluation of the asset.
The key concept in working with RSI is divergence — a discrepancy between price direction and indicator readings. Bullish divergence forms when price makes new lows while RSI shows higher lows — this warns of a possible upward reversal. Bearish divergence occurs at new price highs against falling RSI — a signal of potential downward reversal.
MACD: The Versatile Indicator
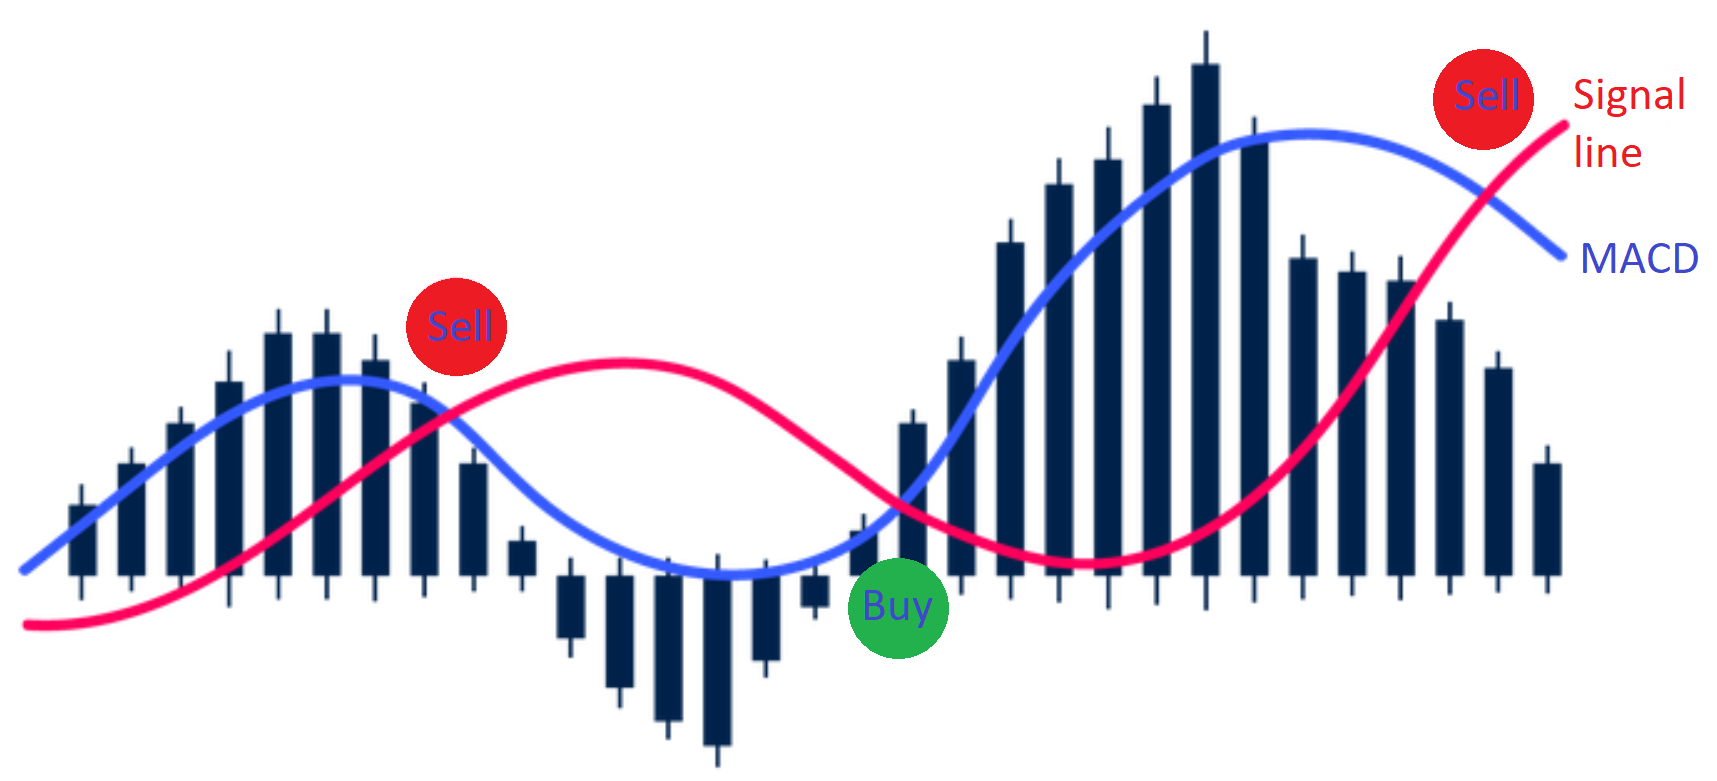
MACD (Moving Average Convergence Divergence) was created by Gerald Appel in the late 1970s. The indicator combines properties of a trend tool and an oscillator, making it a universal solution for various market conditions. MACD consists of three components: the MACD line, signal line, and histogram.
The MACD line is calculated as the difference between two exponential moving averages — fast (typically EMA 12) and slow (EMA 26). When the short average is above the long one, the MACD line is positive — the market is rising. Negative values indicate seller dominance. The signal line is a nine-period EMA of the MACD line, smoothing its fluctuations.
The MACD histogram visualizes the difference between the MACD line and signal line. Expanding histogram indicates trend strengthening, narrowing suggests weakening. The histogram crossing the zero line coincides with the MACD and signal line crossover — this is the key moment for generating trading signals.
Practical Application of RSI
Trading overbought and oversold zones requires patience and discipline. Simply reaching RSI values of 70 or 30 is not an automatic signal to act. Professional traders wait for the indicator to reverse from an extreme zone: a sell signal forms when RSI drops below 70 after being above this level; a buy signal appears when RSI rises above 30.
In trending markets, overbought and oversold levels shift. In a strong uptrend, RSI can remain above 70 for extended periods without generating reversal signals. In such conditions, levels 40 and 80 work more effectively: buy on RSI bounce from 40, sell on reversal from 80. Similarly, in downtrends, levels 20 and 60 apply.
RSI divergences represent powerful predictive signals. Classic bullish divergence requires formation of two consecutive price lows where the second low is lower than the first, while corresponding RSI lows show the opposite — the second is higher than the first. This configuration signals seller exhaustion and probable reversal. Hidden bullish divergence — the reverse situation — indicates trend continuation.
MACD Trading Strategies
The crossover of MACD and signal lines generates basic trading signals. When the MACD line crosses the signal line from below — it's a buy signal; crossing from above — a sell signal. However, not all crossovers are equally reliable. Signals forming far from the zero line are usually stronger than those occurring near it.
The MACD zero line serves as an important level. MACD line crossing above zero confirms uptrend formation; falling below zero confirms downtrend. Traders use these crossovers as a filter: opening only long positions with positive MACD and short positions with negative. This approach increases the percentage of profitable trades by trading in the direction of the main trend.
MACD divergences work similarly to RSI divergences but often provide earlier signals. Discrepancy between price highs and MACD histogram peaks warns of weakening upward momentum. Professionals combine MACD divergences with support and resistance levels to improve entry accuracy.
Combining RSI and MACD
The synergy of two indicators creates a reliable trading system. RSI identifies extreme zones, MACD confirms trend direction. The ideal buy signal: RSI exits oversold territory simultaneously with a bullish MACD line crossover. Signal alignment significantly increases the probability of a successful trade.
Filtering signals through two indicators eliminates most false entries. If RSI shows oversold conditions but MACD remains in negative territory without reversal signs — the signal is ignored. Similarly, a bullish MACD crossover in RSI overbought zone requires special caution. This approach demands patience — signals form less frequently, but their quality is higher.
The practical combination strategy begins with determining market context. On the daily chart, the main trend direction is identified using MACD. Then on the four-hour timeframe, entry points are sought using RSI in the direction of the daily trend. This multi-timeframe analysis accounts for interests of different market participant groups and increases trading decision reliability.
Configuring Indicators for Different Markets
The forex market is characterized by high liquidity and moderate volatility. Standard RSI (14) and MACD (12, 26, 9) settings work effectively on most currency pairs. For scalping on minute charts, periods are shortened: RSI with period 7-9, MACD with parameters 6, 13, 5. Such settings speed up indicator response but increase false signals.
The cryptocurrency market features extreme volatility. Here, RSI overbought and oversold levels shift to 80 and 20 respectively. Crypto assets can remain overbought for weeks during bull rallies. MACD generates more noise on cryptocurrencies, so traders increase the signal line period to 12-15 to filter false crossovers.
The stock market demonstrates more sustainable trends. Indices and blue chips respond to indicators more predictably than volatile assets. On weekly stock charts, RSI with period 21 works effectively — it filters short-term noise and identifies significant reversals. MACD on the stock market is often used with extended EMA periods to capture long-term trends.
Volatility Indicators as RSI and MACD Complement
Bollinger Bands form a dynamic channel around a moving average. Upper and lower bands are positioned at two standard deviations from the middle line. When price touches the upper band with overbought RSI — it's an amplified sell signal. Touching the lower band with oversold RSI — a buy signal. Bollinger Bands narrowing warns of an upcoming volatility surge.
ATR (Average True Range) measures the average amplitude of price movements. This indicator doesn't generate trading signals directly but helps calculate stop-loss and take-profit sizes. With high ATR, stops widen; with low ATR, they narrow. Combining ATR with RSI and MACD signals creates an adaptive risk management system.
Common Mistakes When Working with Indicators
Over-optimization of parameters is a common trap. Traders find ideal settings on historical data, but these parameters rarely work in real-time. Markets constantly change, and a strategy showing excellent historical results may fail in the future. The optimal approach is using standard or near-standard settings with focus on risk management.
Ignoring market context leads to losing trades. An RSI oversold signal in a downtrend often proves to be a trap — price continues falling. Indicators must be applied considering the current market phase, identified through price structure analysis or trend tools. Smart Money concepts help understand the actions of major market participants.
Overloading charts with indicators creates information noise. Multiple tools generate conflicting signals that paralyze decision-making. Professional traders limit themselves to two or three complementary indicators. The combination of RSI, MACD, and a volume indicator covers the main aspects of analysis without redundancy.
Integrating Indicators into a Trading Plan
Indicators are effective only as part of a comprehensive trading system. They determine entry points but don't replace capital management and psychological preparation . A trading plan includes clear entry rules based on indicator signals, position sizing depending on risk, and an action protocol for adverse developments.
Keeping a trading journal allows you to evaluate indicator effectiveness in your strategy. Record every trade noting RSI and MACD signals, market context, and outcome. Statistical analysis reveals patterns: perhaps bullish RSI divergences work better than bearish ones, or MACD signals are more reliable on certain timeframes. Such insights allow fine-tuning the trading system.
Backtesting on historical data is a mandatory step before applying a strategy on a live account. Test indicator performance across different market conditions: trending moves, consolidations, high and low volatility periods. Only a strategy showing stable results across different market phases deserves application with real money.
Conclusion
RSI and MACD are not magical tools that predict the future, but mathematical helpers that reveal patterns in the past and present market. Their power unfolds only within a comprehensive trading system, supplemented by analysis of levels, price patterns, and risk management. Indicators work best when a trader understands their nature, limitations, and proper application.
Successful trading requires discipline and consistency. Start with simple strategies using RSI and MACD on daily charts, where signals are less noisy. Backtest on historical data, then practice on a demo account. Record each trade, analyze statistics, and refine your approach. After several months of focused work, you'll develop the intuition to use these tools effectively in live trading.
Remember: the market is a dynamic environment where no permanent solution exists. Indicators that work brilliantly in one scenario can disappoint in another. Your task as a trader is to adapt, learn, and continuously develop. By combining knowledge of RSI and MACD with understanding of market psychology and practical experience, you'll take a significant step toward professional trading.
Frequently Asked Questions
RSI (Relative Strength Index) is an oscillator that measures the speed and magnitude of price changes. Values above 70 indicate overbought conditions, below 30 indicate oversold conditions. Traders use RSI to find reversal points and confirm divergence signals.
MACD consists of the MACD line (difference between EMA 12 and EMA 26), signal line (EMA 9 of the MACD line), and histogram. When the MACD line crosses the signal line from below, it generates a buy signal; crossing from above indicates a sell signal.
Moving averages (SMA, EMA), ADX index, Parabolic SAR, and Ichimoku are effective for trend identification. These indicators help determine price direction and assess the strength of the current trend.
Yes, combining RSI and MACD increases trading signal accuracy. RSI identifies overbought and oversold zones, while MACD confirms trend direction. When signals from both indicators align, the probability of a successful trade increases significantly.
RSI and MACD are universal and apply to forex, stock markets, cryptocurrencies, and commodities. Period settings are adapted to the volatility of the specific market and chosen timeframe.
About the Author
Author: Igor Arapov — independent researcher in trading psychology and behavioral finance, practising trader since 2013, founder of arapov.trade, author of a trading book series (Open Library ), (ORCID: 0009-0003-0430-778X ).