Moving Averages (MA) represent one of the fundamental tools in technical analysis , actively employed by traders across global financial markets. This indicator enables identification of market trend direction, pinpointing optimal moments for opening and closing positions, and significantly reducing the impact of market noise on trading decisions. In this comprehensive material, we will examine the mechanics of moving averages, explore various indicator types, master effective trading strategies, and analyze real-world examples of their application across different markets.
What is a Moving Average?
A moving average is a technical indicator that calculates the averaged value of a financial instrument's price over a specified time interval. The primary purpose of this indicator lies in smoothing random price fluctuations and visualizing the prevailing market direction. The indicator derives its name from its calculation principle: with each new candle, the calculation window shifts, and the average value is recalculated.
The versatility of moving averages allows their application across various financial venues — from the Forex currency market to cryptocurrency exchanges and stock markets. Traders employ MA across any timeframe: from minute charts for scalping to monthly charts for long-term investing. The indicator performs equally effectively on highly liquid assets such as major currency pairs and on less liquid instruments.
Main Types of Moving Averages
Several varieties of moving averages exist, each possessing unique characteristics and application areas. Understanding the differences between MA types enables traders to select the optimal variant for specific trading situations and market work styles.
Simple Moving Average (SMA)
SMA is calculated by summing closing prices over a selected number of periods and dividing by their count. For instance, a ten-day SMA adds the closing prices of the last ten trading sessions and divides the result by ten. The calculation formula is straightforward: SMA = (P1 + P2 + ... + Pn) / n, where P represents the closing price and n represents the number of periods.
Due to the equal weighting of all price values, simple moving average provides the smoothest line, making it an ideal tool for analyzing long-term tendencies. The 200-day SMA is considered the classic indicator of global trend direction in stock markets — price crossing this level is often viewed as a paradigm shift. However, a significant disadvantage of SMA is its inertia: the indicator responds slowly to sharp price movements.
Exponential Moving Average (EMA)
EMA utilizes an exponential smoothing coefficient that assigns increased weight to recent price data. The calculation formula is: EMA = (Current Price × k) + (Previous EMA × (1 - k)), where coefficient k = 2 / (n + 1). This approach ensures more responsive indicator reaction to current market changes.
Exponential moving average excels in short-term trading and working on volatile markets, including cryptocurrencies . Popular EMA periods for day trading are 9 and 21, for swing trading — 20 and 50. Many professional traders prefer EMA precisely for its ability to more quickly reflect changes in market conditions.
Weighted and Smoothed Moving Averages
Weighted Moving Average (WMA) applies a linear weight scale: the most recent price receives the maximum coefficient, the previous one less by one unit, and so forth. Smoothed Moving Average (SMMA) accounts for an extended array of historical data, providing maximum price series smoothing. Both variants are used less frequently than SMA and EMA but find application in specific trading systems.
Applying Moving Averages in Trading
Moving averages provide traders with an entire arsenal of analytical capabilities. Proper utilization of the indicator enables making informed trading decisions based on objective market data.
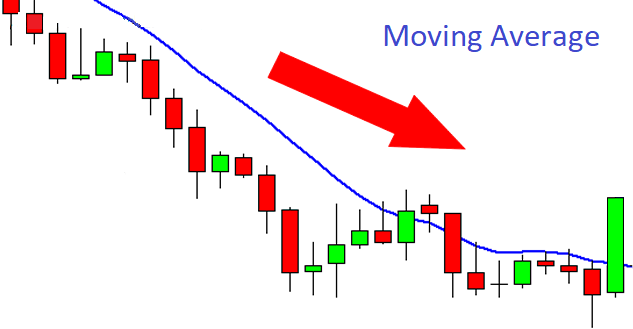
Identifying Market Trend
The basic method of MA application involves determining current trend direction. When asset quotes are positioned above the moving average, the market is in an upward phase. Price location below the MA line indicates a downward tendency. For comprehensive analysis, combining multiple moving averages is recommended: short-term for tracking local dynamics and long-term for understanding the global picture.
Professional traders often employ a combination of 20-day, 50-day, and 200-day moving averages. This configuration allows simultaneous visualization of short-term, medium-term, and long-term trends, substantially enhancing market analysis quality.
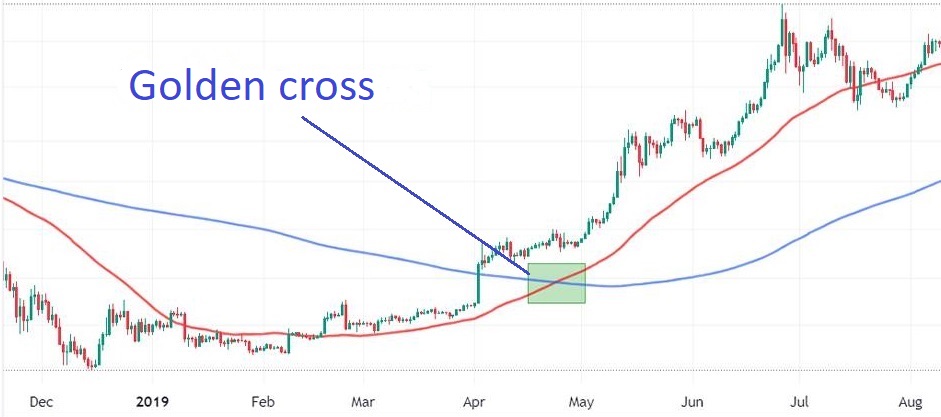
Crossover Signals: Golden Cross and Death Cross
Crossovers of moving averages with different periods generate some of the most reliable trading signals. A Golden Cross forms when a short-term MA crosses a long-term one from below — this is a classic buy signal, heralding the beginning of a bullish trend. A Death Cross occurs with the reverse crossover — from above — and signals a potential reversal into a bearish phase.
The classic combination for identifying crossovers is the 50-day and 200-day SMA. However, understanding that crossover signals are not absolute and require confirmation from additional analytical tools, such as technical indicators RSI or MACD, is essential.
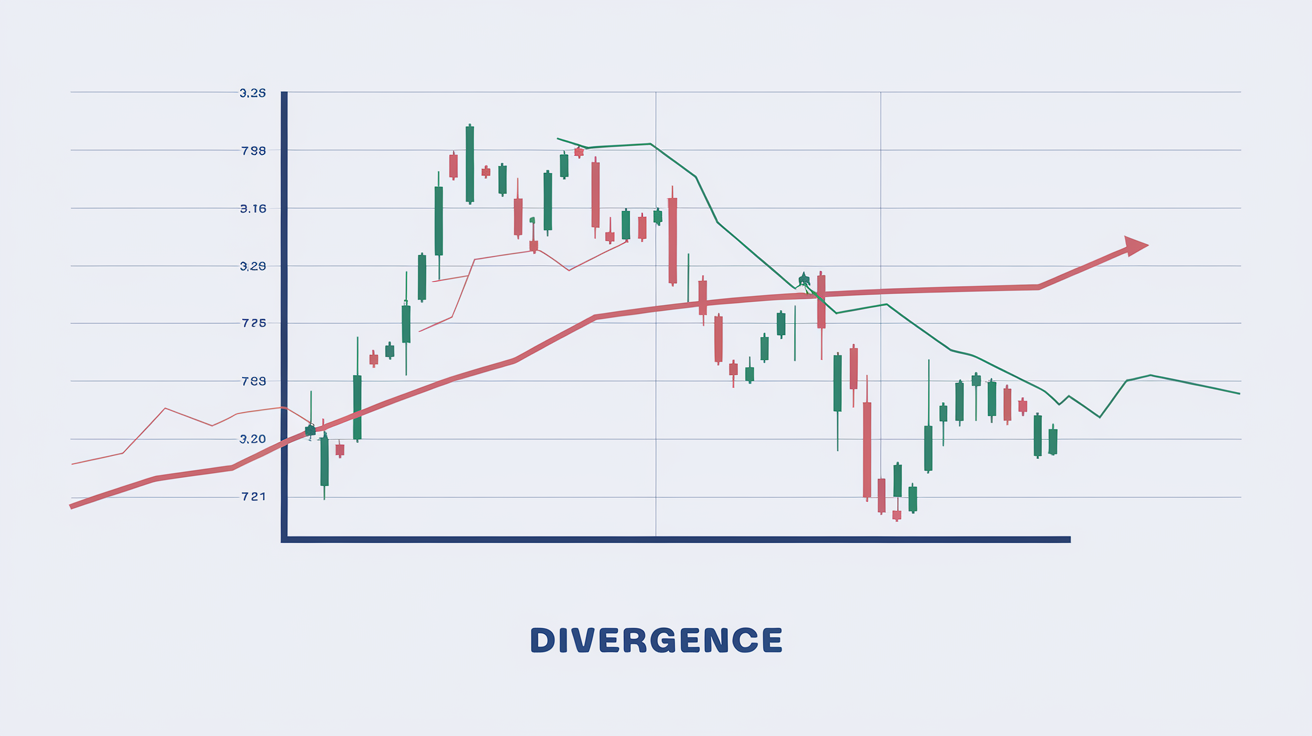
Dynamic Support and Resistance Levels
Moving averages function as adaptive support and resistance levels . Unlike horizontal levels, MA moves with price, constantly adapting to current market conditions. In bullish markets, moving averages often serve as support from which price bounces upward. In bearish phases, the same line becomes resistance, limiting upward corrections.
Effective Strategies Using MA
Trend Following Strategy
The trend strategy involves opening positions exclusively in the direction of the primary market movement. If price consistently remains above the 200-day SMA, only long positions are considered. When quotes are positioned below this level, priority shifts to short positions. This approach minimizes the number of losing counter-trend trades and allows maximizing profits from directional movements.
Moving Average Bounce Strategy
The bounce strategy is based on using MA as a dynamic support or resistance level. Traders await price approaching the moving average and open positions upon signs of a bounce. Candlestick patterns, trend volume analysis , or additional indicators are used to confirm signals.
Combined Strategies with Multiple Indicators
Maximum effectiveness is demonstrated by comprehensive approaches combining moving averages with other analytical tools. Pairing MA with RSI allows filtering signals by overbought or oversold criteria. Combination with MACD provides trend strength confirmation. Using Bollinger Bands helps assess market volatility and determine optimal entry moments.
Advantages and Limitations of Moving Averages
Unquestionable advantages of moving averages include their interpretation simplicity, universal applicability across any markets and timeframes, effectiveness in trending conditions, and ability to filter market noise. The indicator is available on all trading platforms and requires no complex configuration.
Nevertheless, moving averages have significant limitations. The main disadvantage is signal lag, caused by calculation based on historical data. During sideways market movement (ranging), the indicator generates numerous false signals leading to losses. Sensitivity to period settings requires thorough testing for each asset and timeframe.
Practical Recommendations for Working with MA
Achieving stable results when using moving averages requires adherence to several practice-proven principles. Always combine MA with additional indicators for signal confirmation. Test selected parameters on historical data before applying them to real accounts. Consider current market conditions — during periods of low volatility , indicator effectiveness decreases.
Apply multi-timeframe analysis: use higher timeframes to determine the global trend and lower ones to find entry points. Always set protective stop-losses based on asset volatility or key technical levels. Follow capital management rules, limiting risk per trade to one to two percent of your deposit.
Common Mistakes When Using Moving Averages
A common mistake among beginning traders is ignoring market context and mechanically following MA signals. Trading based on a single indicator without confirmation inevitably leads to losses. Another frequent problem is over-optimization of parameters for historical data, which fails to work under real market conditions.
Many traders make the mistake of attempting to trade MA signals during ranging markets. Using the ADX indicator helps determine trend strength and avoid false entries. Equally critical is not forgetting fundamental factors — central bank decisions and key economic data can instantly alter market conditions, ignoring any technical signals.
Conclusion
Moving averages remain an indispensable technical analysis tool, providing traders with objective information about market trends and potential entry points. Their effective application requires understanding the operating principles of various MA types, proper parameter selection for specific trading styles, and mandatory use of additional signal confirmation tools.
Begin your moving averages study on a demo account, test various period and type combinations, find optimal settings for your preferred trading instruments. Remember that trading success is determined not by a single indicator but by a comprehensive approach encompassing technical analysis, risk management, and psychological discipline.
Frequently Asked Questions
A Moving Average (MA) is a technical indicator that calculates the average price of an asset over a specific time period, smoothing out price fluctuations and making market trends more visible. MA helps traders identify trend direction, find entry and exit points, and filter out market noise.
Simple Moving Average (SMA) is calculated as the arithmetic mean of prices over a selected period, giving equal weight to all values. Exponential Moving Average (EMA) uses an exponential formula, giving more weight to recent price data, making it more sensitive to recent market changes. EMA is better suited for short-term trading, while SMA is ideal for long-term trend analysis.
A golden cross is a bullish signal that occurs when a short-term moving average (such as 50-day) crosses above a long-term moving average (such as 200-day), indicating the start of an uptrend. A death cross is a bearish signal when a short-term MA crosses below a long-term one, signaling a potential downtrend.
Period selection depends on your trading style. For scalping and day trading, short-term MAs with periods of 9-21 days work well. For swing trading, periods of 20-50 days are effective. For long-term investing and determining the global trend, 100-200 day moving averages are used. Combining multiple periods is recommended for more accurate analysis.
Moving averages are trend-following indicators and work effectively during clear directional market movements. During sideways markets (ranging), price frequently crosses MA in both directions, generating numerous false signals. To identify ranging conditions, use the ADX indicator: values below 20 indicate a weak trend, making MA signals unreliable.
About the Author
Author: Igor Arapov — independent researcher in trading psychology and behavioral finance, practising trader since 2013, founder of arapov.trade, author of a trading book series (Open Library ), (ORCID: 0009-0003-0430-778X ).