Cup and Handle Pattern in Trading
Among the numerous chart formations traders use for market forecasting, the Cup and Handle pattern holds a special place due to its reliability and clear structure. This continuation pattern forms at the completion of a correction and signals market readiness to resume its upward trajectory. The formation gained widespread recognition after American investor William O'Neil described it in his technical analysis publications during the 1980s.
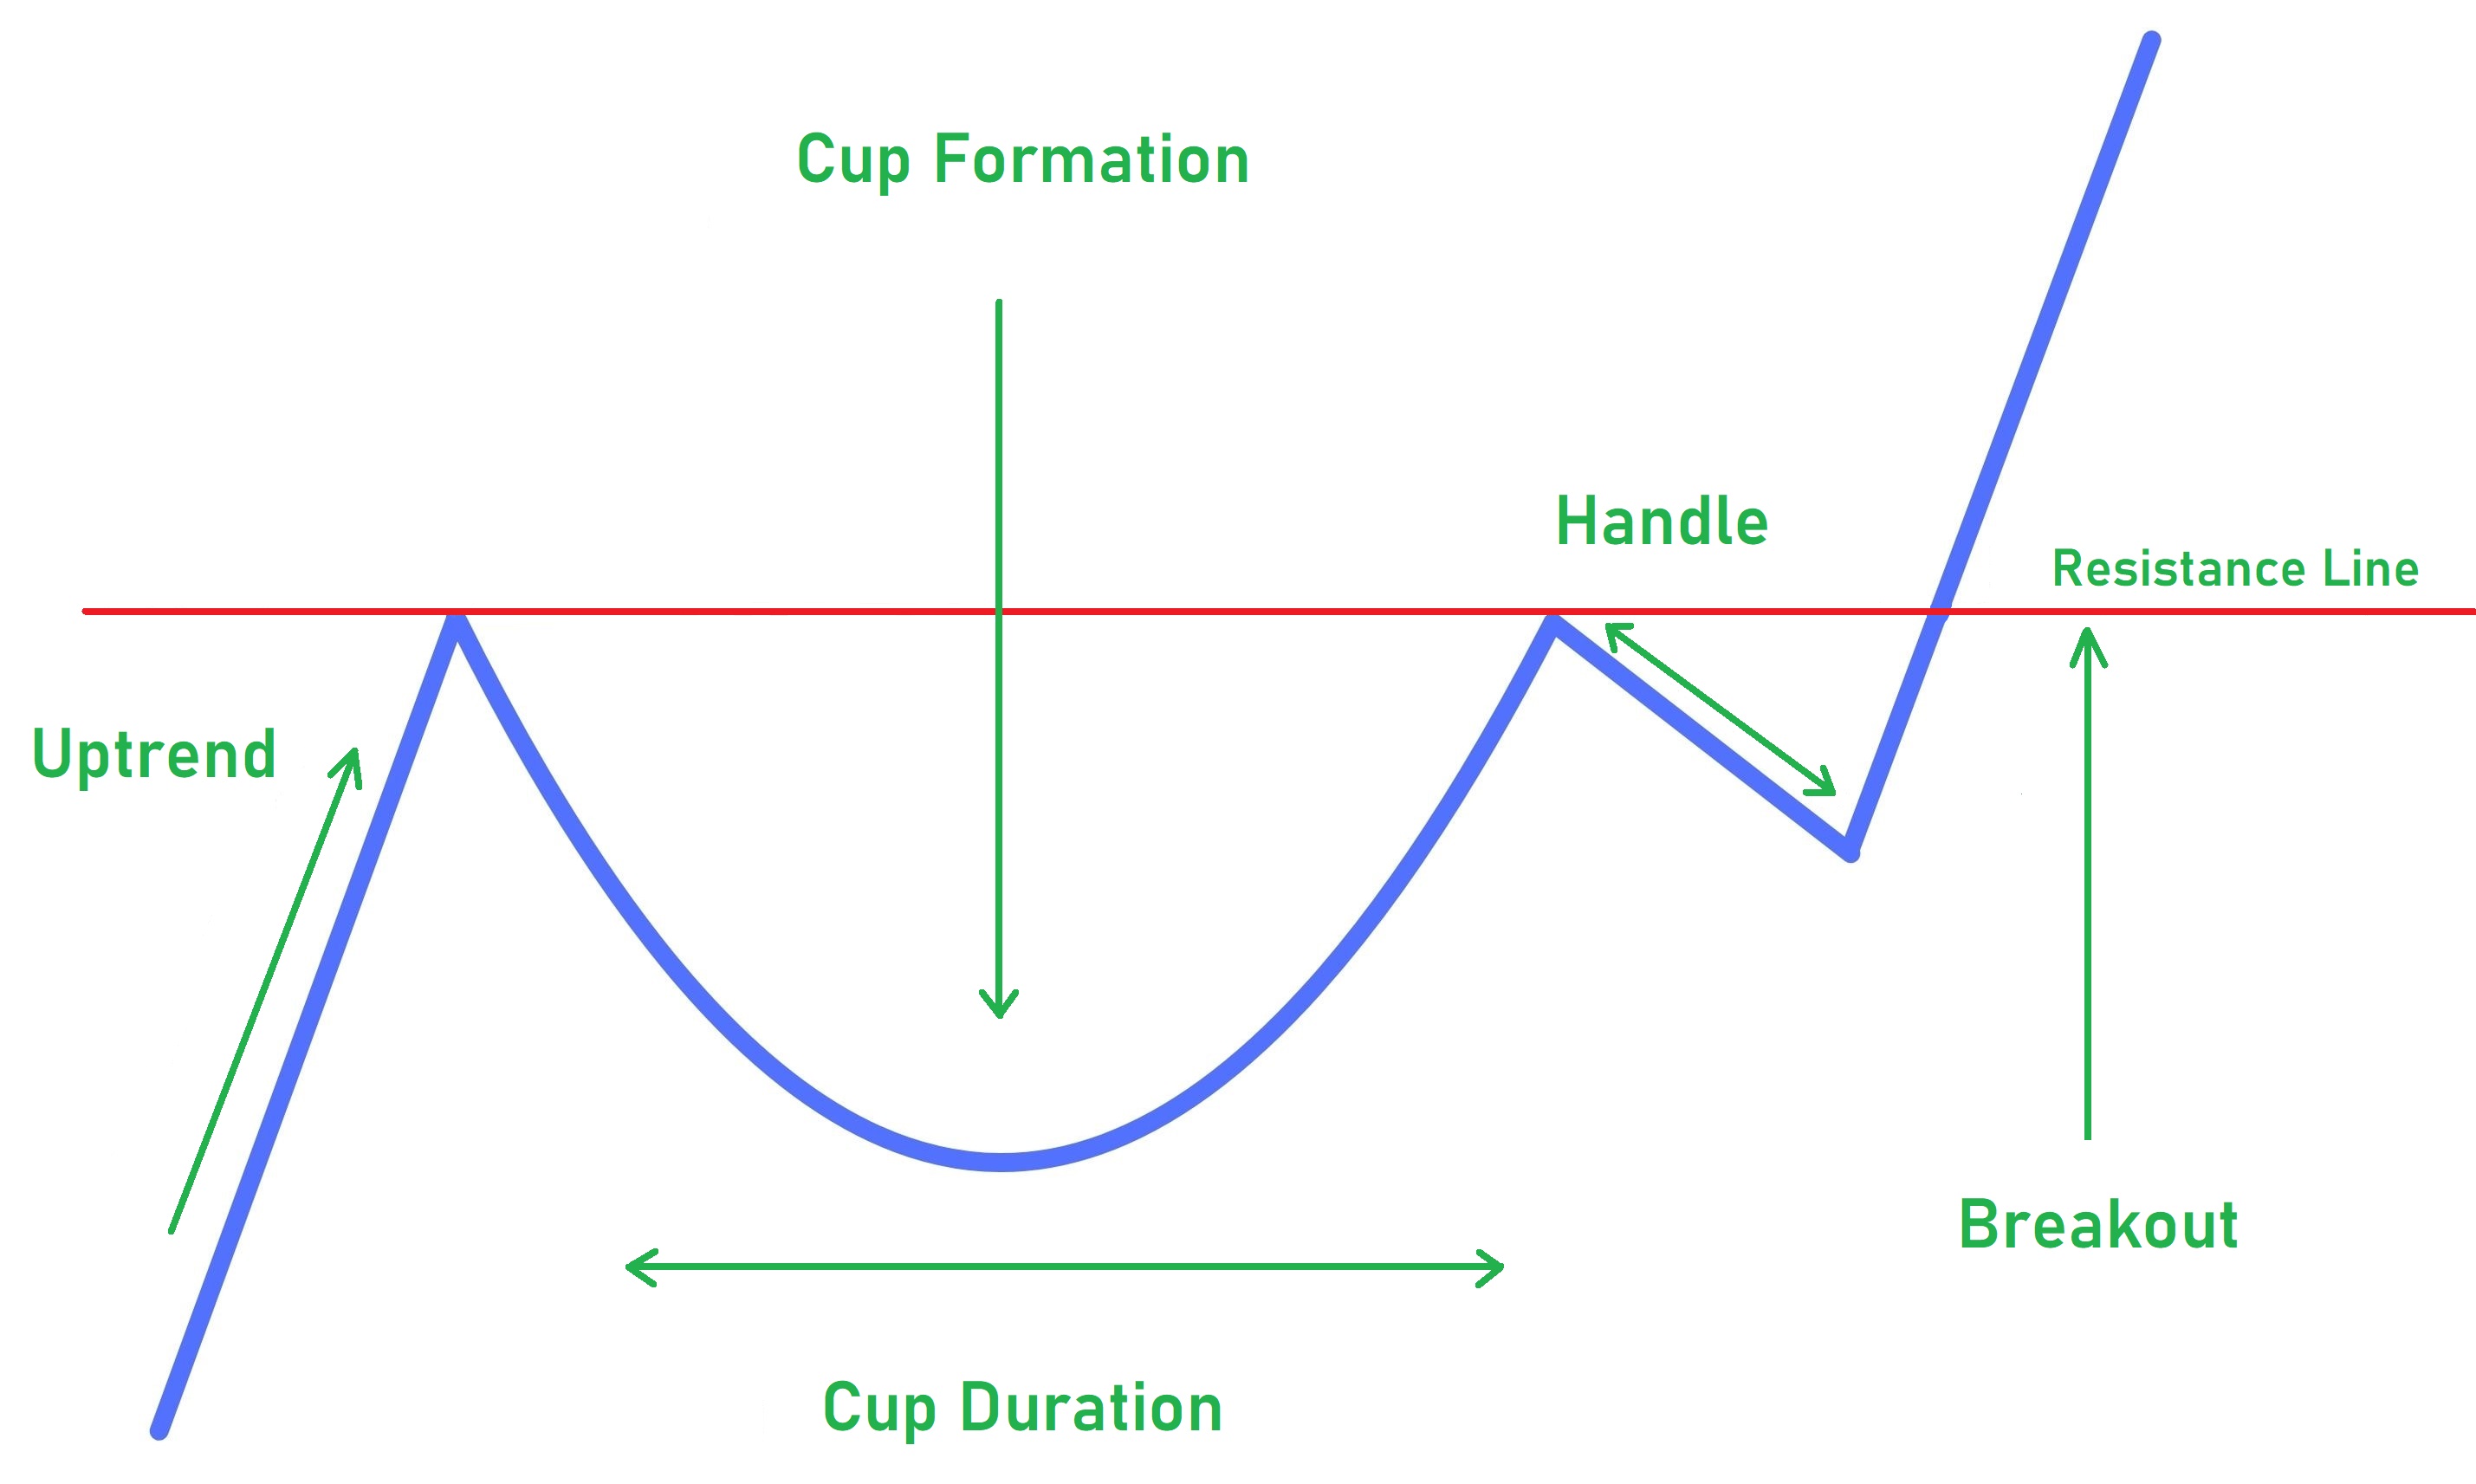
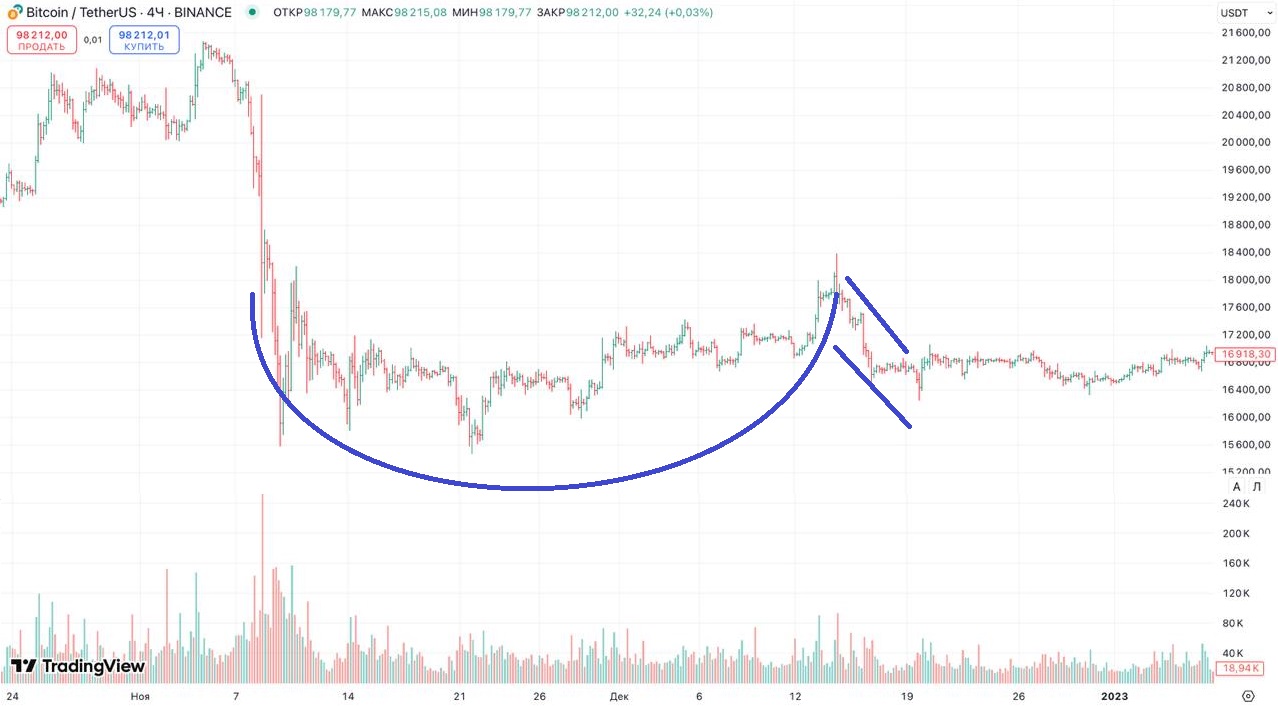
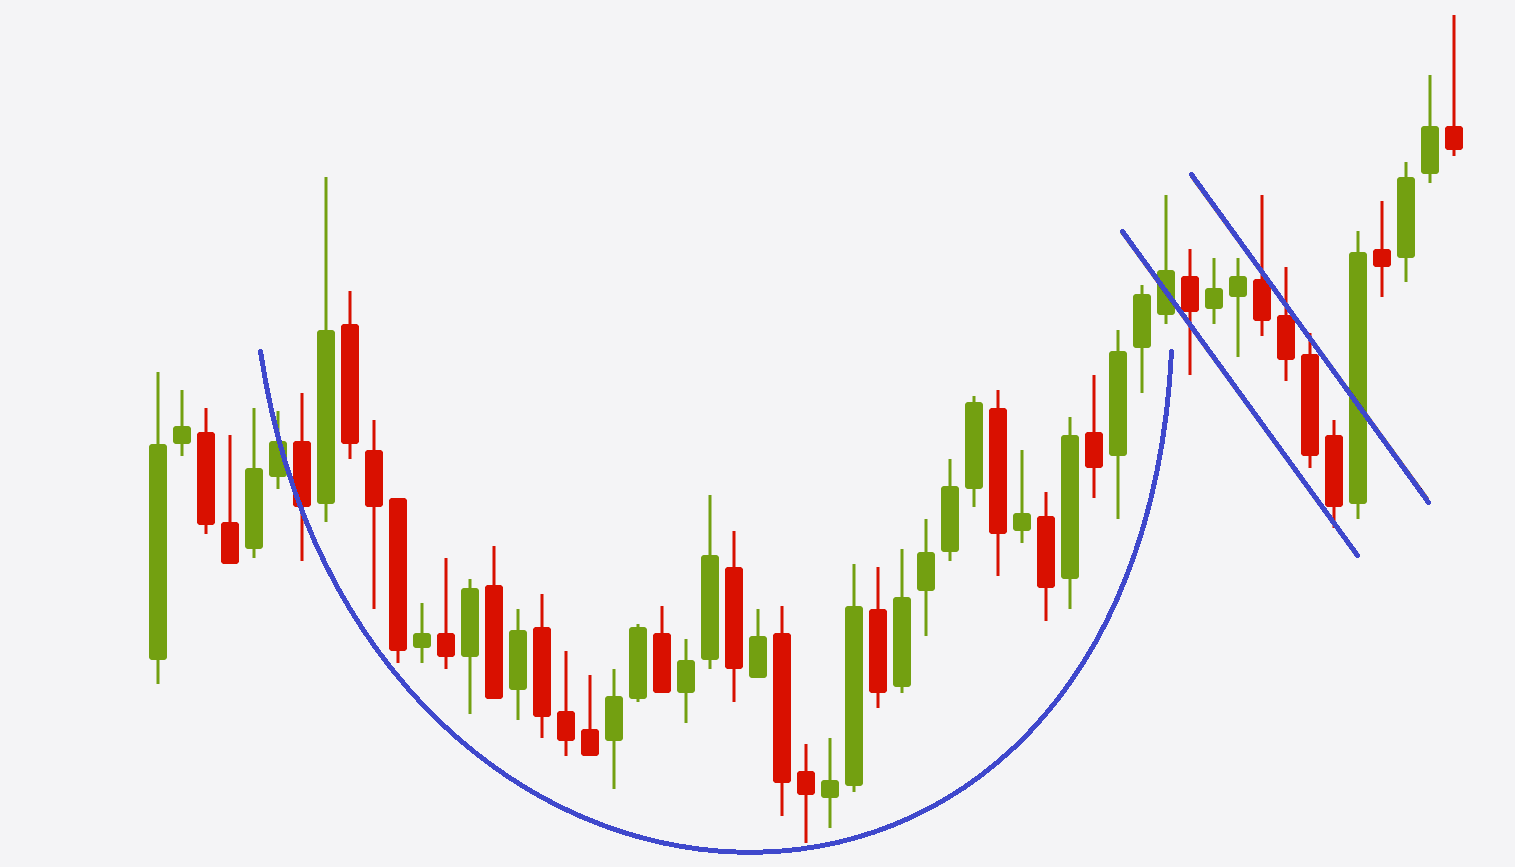
Visually, the pattern resembles a tea cup with a handle when viewed from the side. The main portion consists of a rounded base created by gradual price decline followed by recovery. Once price returns to the previous high level, handle formation begins—a small consolidation zone preceding the impulsive upward breakout. This structure reflects the natural market cycle of accumulation and distribution.
The pattern's appeal for traders stems from several factors. First, it has clear identification and trading rules that leave little room for interpretation. Second, statistically the pattern demonstrates high success rates when properly recognized. Third, the formation allows precise calculation of profit targets and optimal protective order placement.
Pattern Structure and Characteristics
Proper understanding of the pattern structure ensures successful trading. The formation consists of two key elements, each carrying specific information about market conditions and participant intentions.
Cup Formation
The cup represents a U-shaped correction following prior upward movement. Price gradually declines, reaches a bottom, stabilizes, and begins smooth recovery. Critically, the shape must be rounded rather than V-shaped. A sharp drop followed by sharp bounce indicates elevated volatility and reduces pattern reliability significantly.
Cup depth typically ranges from 12% to 35% of the preceding advance. A correction that's too shallow doesn't provide sufficient potential for subsequent movement, while excessive depth may signal trend reversal. Formation duration varies from several weeks to several months depending on the timeframe being analyzed.
During cup formation, assets transfer from weak hands to strong hands. Early buyers take profits, creating price pressure. Smart money gradually accumulates positions during the decline, preparing for continued upward movement. This accumulation process is essential for providing fuel for the subsequent breakout.
Handle Formation
The handle forms after price recovers to the previous high level. This represents the final consolidation period before breakout, typically appearing as a descending channel, flag, or pennant. The handle serves as a shakeout mechanism for impatient traders who close their positions prematurely before the actual move.
Optimal handle depth shouldn't exceed one-third of the cup depth. An excessively deep handle indicates buyer weakness and may lead to failed breakout. Formation duration is typically shorter than the cup—from several days to several weeks. Volume during handle formation should decrease, demonstrating selling exhaustion.
Pattern Identification on Charts
The ability to accurately recognize the pattern amid market noise determines trading success. Several criteria distinguish quality formations from imperfect variants or completely different price patterns.
The first criterion is the presence of a preceding uptrend. Cup and Handle is a continuation pattern, so it must form within an existing bullish context. Formation within a downtrend or sideways market significantly reduces reliability and increases the probability of pattern failure.
The second criterion is smooth cup shape. An ideal cup has a symmetrical rounded bottom without sharp drops. In practice, perfect symmetry is rare, but slight deviations are acceptable; the overall shape should be clearly U-shaped rather than V-shaped.
The third criterion is handle proportionality. The handle shouldn't descend below the cup's midpoint. If the handle correction exceeds half the preceding recovery, this signals weakness and potential reversal rather than continuation.
The fourth criterion is volume behavior. Classic patterns show declining volume during cup formation, minimum activity at the bottom, gradual increase during recovery, and volume surge on breakout. Learn more in the article on volume analysis.
Distinguishing from Similar Formations
The Cup and Handle can be confused with several other patterns. Double top appears similar externally but has two distinct peaks at approximately the same level, while the cup shows smooth rounding. Additionally, double top is a reversal pattern, not continuation.
The Flag pattern differs by having a shorter formation period and lacking a clear rounded base. Flags form faster and represent a relatively narrow correction channel rather than the broader cup structure.
The Head and Shoulders pattern has three distinct peaks where the center exceeds the sides. Cup and Handle lacks this three-peak structure entirely.
Pattern Trading Strategy
Effective pattern trading requires clear understanding of entry points, protection levels, and profit targets. Several approaches exist for opening positions, each with its own advantages and risks depending on trader risk tolerance.
Position Entry Methods
The conservative method involves entry after confirmed breakout of the resistance level. The trader waits for a candle close above the cup rim and opens a long position. This approach reduces the risk of false breakouts but may result in less favorable entry price.
The aggressive method allows entry on the handle's upper boundary breakout without waiting for the main resistance break. This provides better pricing but carries elevated risk of false movement and requires tighter risk management.
Retest entry represents a compromise. After breakout, price often returns to the broken level for testing. If the level holds as support, the trader gets confirmation of breakout strength and opportunity to enter at a more attractive price.
Protective Order Placement
Stop-loss placement depends on chosen strategy and instrument volatility. The basic option is setting the stop below the handle low. This provides protection from local false breakouts while maintaining reasonable risk-to-reward ratio.
During elevated volatility or market weakness, the stop may be placed below the cup bottom. This approach gives price more room to maneuver but increases potential loss if the trade fails. Read more about risk management at stop-loss rules.
Target Level Calculation
The minimum profit target is determined by measuring cup depth—the distance from rim to bottom. This distance is projected upward from the breakout point. This method is based on movement symmetry principles and has proven statistically effective across multiple market conditions.
Beyond calculated targets, consider technical resistance levels on higher timeframes. Historical highs, round numbers, and Fibonacci levels can serve as obstacles to further growth and function as partial profit-taking zones.
Common Mistakes and Prevention
Despite the pattern's apparent simplicity, many traders make typical mistakes that turn potentially profitable trades into losses. The most common mistake is accepting a V-shaped bottom as a cup. A sharp drop with subsequent sharp bounce creates a visually similar shape, but reflects entirely different market dynamics and should be avoided.
Premature entry before confirmed breakout is a classic mistake of impatient traders. The desire to buy cheaper pushes them to open positions still in the handle, increasing loss risk if the breakout fails to materialize.
Ignoring volume deprives the trader of an important confirming factor. Breakout without volume increase often proves false. A surge in trading activity on pattern exit is a mandatory condition for quality signals.
Improper position sizing leads to excessive risk. Even the most reliable pattern doesn't guarantee success, so every trade should follow risk management rules strictly.
Conclusion
The Cup and Handle pattern is deservedly considered one of the most reliable continuation formations in technical analysis. Its clear structure allows precise entry point determination, target calculation, and protective order placement. With proper identification and competent risk management, the pattern provides high probability of successful outcome. To consolidate this material, also study trend volume analysis .
Key success factors are patience while waiting for confirmed breakout, attention to volume patterns, and strict adherence to capital management rules. Practice shows that disciplined approach to trading this pattern delivers consistent long-term results across various markets.
Frequently Asked Questions
The Cup and Handle is a bullish continuation pattern consisting of two elements: a rounded base (cup) formed after a correction, and a small consolidation zone (handle) before an upward breakout. The pattern signals accumulation by institutional players.
The most reliable signals form on H1 timeframes and higher. On smaller intervals (M5-M15), the pattern more frequently produces false breakouts due to market noise. Daily and weekly charts show the highest accuracy rates.
The minimum target is calculated by measuring the cup depth from bottom to resistance level. This distance is projected upward from the breakout point. Additionally, consider nearby resistance levels on higher timeframes.
Conservative stop-loss is placed below the handle low. During increased volatility or trend weakness, the stop goes below the cup bottom. It's important to account for the asset's average volatility range (ATR) to avoid random stop-outs.
Main mistakes include: premature entry before confirmed breakout, ignoring volume, trading patterns with incorrect shape (V-shaped bottom instead of rounded), setting stop-loss too tight, and lack of risk management.
About the Author
Author: Igor Arapov — independent researcher in trading psychology and behavioral finance, practising trader since 2013, founder of arapov.trade, author of a trading book series (Open Library ), (ORCID: 0009-0003-0430-778X ).