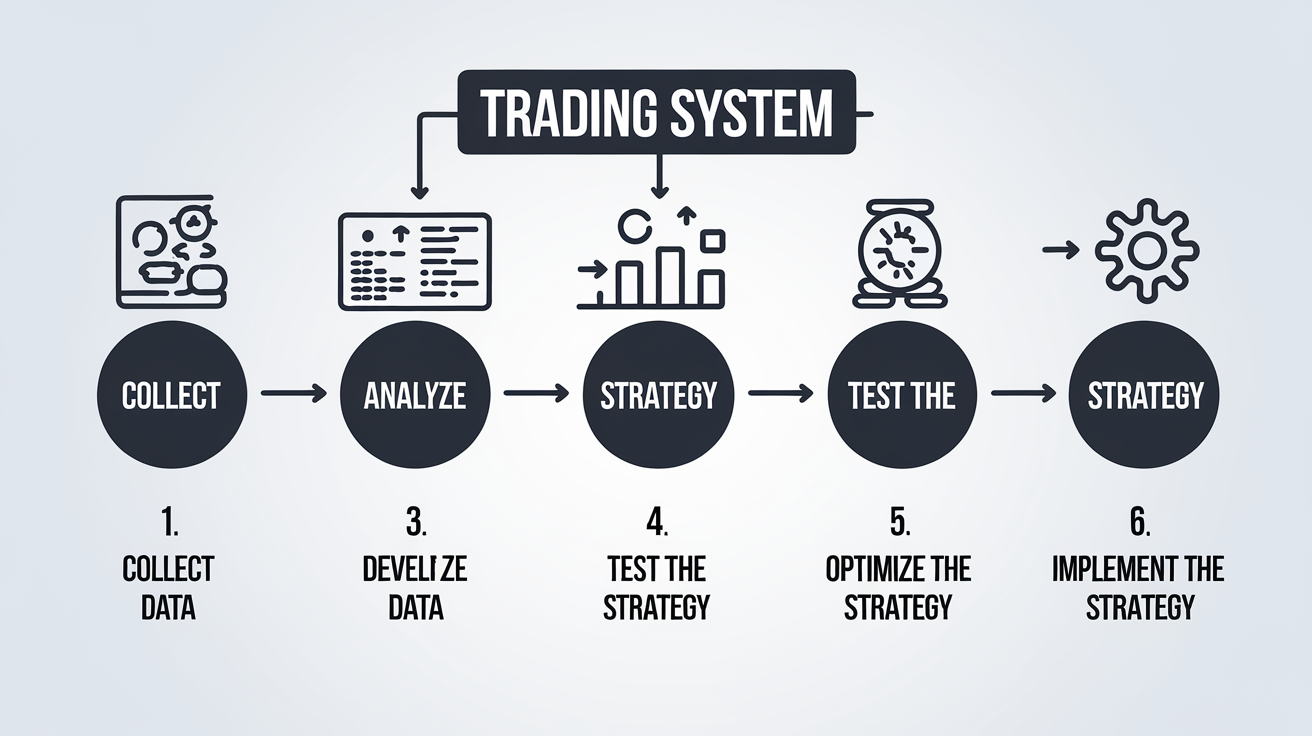
Understanding the Flag Pattern in Market Analysis
The Flag Pattern occupies a distinguished position among technical analysis instruments, providing traders with opportunities to identify moments when strong price movements are likely to continue. This chart formation derives its name from visual resemblance to a banner flying on a pole: the vertical component symbolizes a powerful market impulse, while the rectangular portion represents a period of temporary calm before the next thrust forward. This strategy is part of the concept of continuation patterns.
The practical significance of this model stems from its ability to reflect fundamental market dynamics. Following a rapid price surge, some market participants lock in accumulated profits, creating a natural pause in the movement. However, the underlying trend drivers persist, and upon completion of the rest period, quotations resume their journey in the original direction with renewed vigor. This behavioral pattern repeats across all financial instruments and timeframes.
Anatomy and Structural Components
Every Flag Pattern encompasses two key structural elements whose understanding proves critical for correct signal interpretation. The flagpole represents an impulse price movement characterized by significant amplitude and elevated trading activity. This component reflects dominance by one side of the market and establishes the foundation for the entire construction.
The flag body forms as a result of short-term consolidation — sideways or slightly sloped movement within a narrow price corridor. The boundaries of this corridor consist of parallel lines forming a channel with characteristic slope against the direction of the preceding impulse. Consolidation duration typically spans five to twenty candles depending on the selected timeframe.
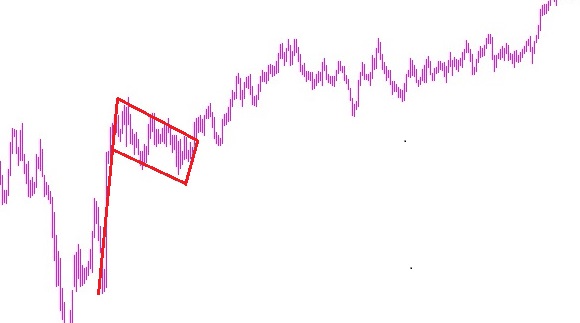
The concluding element is the flag breakout — the moment when quotations exit beyond the consolidation boundary in the direction of the initial impulse. This signal serves as a trigger for opening positions and confirms market readiness to continue the trending movement.
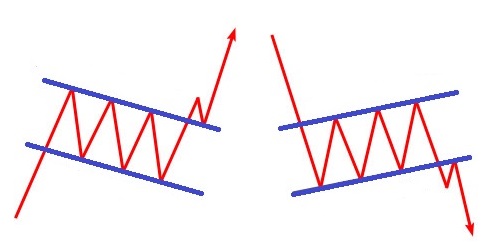
Classification of Flag Patterns
Market practice distinguishes two primary varieties of this formation, determined by the direction of the preceding trend and corresponding trading strategies.
Bull Flag
A bull flag forms in the context of an uptrend following a powerful buyer impulse. The pole points upward reflecting aggressive position accumulation. Consolidation acquires a downward slope, creating an impression of correction, though in reality it represents merely a rest before continued growth. Breakout above the flag body boundary signals resumption of bullish pressure.
Bear Flag
A bear flag mirrors the bullish variety and emerges within downtrends. The pole points downward demonstrating seller dominance. Consolidation features an upward slope, simulating technical recovery. Breakout below the lower boundary confirms bear readiness to continue selling pressure.
Psychological Foundation of the Pattern
The flag's effectiveness as a trading instrument roots in market participant psychology and the cyclical nature of price movements. Pole formation accompanies emotional elevation: euphoria in uptrends or panic in downtrends. Active participants aggressively build positions, provoking sharp quotation displacement.
The consolidation phase reflects a period of reflection and force regrouping. Some traders lock in profits, creating pressure against the trend. Simultaneously, large institutional players may use this period to accumulate additional positions at attractive prices. Volume decline during this phase signals exhaustion of counter-trend impulse.
Flag boundary breakout marks restoration of consensus regarding movement direction. New participants enter the market, amplifying pressure toward the trend. Volume increase on breakout confirms renewed interest and raises probability of reaching target levels.
Pattern Identification Methodology
Correct flag recognition requires systematic approach and attention to several key characteristics. First, ensure presence of a pronounced impulse movement preceding consolidation. The pole should demonstrate significant amplitude and accompany elevated trading activity.
Consolidation should form a clearly delineated channel with parallel boundaries. Channel slope opposes the impulse direction: downward for bull flags, upward for bear flags. Deviation from boundary parallelism may indicate formation of a different model, such as a wedge or triangle .
Volume dynamics provide additional confirmation. High volumes during pole formation contrast with declining activity during consolidation. Resumption of volume growth as price approaches the flag boundary presages imminent breakout.
Trading Strategies and Tactics
Working with the Flag Pattern involves choosing between two main approaches to position entry: conservative and aggressive. Each method carries its own advantages and requires corresponding risk management.
Conservative Entry on Breakout
The classical method involves awaiting confirmed breakout of the flag boundary. Position opens after candle close beyond the consolidation channel in the direction of the initial impulse. This approach minimizes risk of entering a false breakout, though may result in less favorable entry point.
Aggressive Entry Within the Channel
Experienced traders practice anticipatory entry as price approaches the flag boundary, without waiting for actual breakout. This method provides better risk-to-reward ratio but requires additional filters: reversal candlestick patterns , oscillator signals, or volume accumulation signs.
Position Management
Stop-loss placement beyond the opposite flag boundary accounting for current instrument volatility proves essential. ATR indicator usage helps determine optimal distance excluding premature position closure from market noise.
Target projection calculation involves measuring pole length and projecting this distance from the breakout point. Fibonacci levels provide additional guidance: 100%, 161.8%, and 261.8% extensions from the impulse often serve as significant target zones. To apply this knowledge, study the trend structure.
Volume Analysis Significance
Volume indicators play a critical role in pattern verification and breakout probability assessment. During pole formation, volumes reach peak values reflecting active market player participation. This phase characterizes by evident imbalance between buyers and sellers.
The consolidation period accompanies gradual trading activity decline. Volumes contract as price approaches the formation apex, signaling counter-trend impulse exhaustion. Abnormally high volumes within the flag may indicate hidden accumulation or distribution by large participants.
The breakout moment should accompany significant volume increase confirming market intent sincerity. Breakout on low volumes raises false signal probability and requires additional caution. OBV and Volume Profile indicators provide extended volume distribution information helping assess forming movement strength.
Common Trader Mistakes
Working with the Flag Pattern involves several widespread misconceptions whose understanding helps avoid losing trades. Premature entry before breakout confirmation represents the most frequent beginner mistake. Impatience leads to opening positions inside consolidation without sufficient grounds.
Ignoring volume picture substantially reduces trading effectiveness. Breakout without accompanying activity growth often proves false, provoking losses. Systematic volume indicator usage minimizes this risk.
Incorrect protective order placement destroys potentially profitable trades. Too-close stop-loss triggers from market noise, while excessively distant distorts risk-to-reward ratio. Stop calibration based on ATR or structural levels ensures optimal balance.
Attempting flag identification in ranging market conditions leads to false signals. The pattern works exclusively in trending conditions, making preliminary market context assessment on higher timeframes a mandatory analysis element.
Market Context and Adaptation
Flag Pattern effectiveness varies depending on overall market state and traded instrument specifics. In the Forex currency market , flags form regularly due to high liquidity and pronounced trending movements. Optimal results achieve on hourly and four-hour charts of major currency pairs.
Stock markets demonstrate varying flag formation dynamics depending on market cycle. Bull flags predominate during economic growth periods, while bear flags emerge during correction or recession phases. Corporate events can either strengthen or disrupt forming patterns.
The cryptocurrency segment distinguishes by elevated volatility leading to wider and more dynamic flag formation. False breakouts occur more frequently here, requiring stricter confirmation criteria and expanded protective orders. Moving average usage as additional filter improves signal reliability.
Concluding Recommendations
The Flag Pattern represents a reliable technical analysis instrument demonstrating high effectiveness under proper application. Its visual clarity and clear trading rules make the model accessible to traders of any preparation level. Systematic identification approach, patient confirmation waiting, and disciplined risk management form the foundation of successful pattern trading.
Starting practice on demonstration accounts while analyzing historical examples and honing formation recognition skills proves recommended. Maintaining a trading journal with detailed recording of each trade allows identifying individual success patterns and improvement areas. To consolidate this material, also study: trend volume analysis. Continuous learning and strategy adaptation to changing market conditions ensure long-term trading success.
FAQ: Frequently Asked Questions About the Flag Pattern
The Flag pattern is a trend continuation chart formation consisting of two elements: the flagpole (a sharp impulse move) and the flag itself (a short consolidation within a narrow channel). After consolidation completes, price typically continues moving in the direction of the initial impulse.
There are two main types: bull flag (forms after an upward impulse, consolidation slopes downward) and bear flag (forms after a downward impulse, consolidation slopes upward). Both types signal continuation of the preceding trend.
The primary method involves entering on a breakout of the flag boundary in the trend direction. Stop-loss is placed beyond the opposite boundary of consolidation. Profit target is calculated as the flagpole length projected from the breakout point.
A genuine breakout is accompanied by increased trading volume and a candle close beyond the flag boundary. False breakouts are characterized by low volume and quick price return into the consolidation range.
The Flag is universal and effective across all financial markets: Forex, stocks, cryptocurrencies, and commodities. The pattern works on any timeframe from minutes to weeks, though the most reliable signals form on H1-D1.
About the Author
Author: Igor Arapov — independent researcher in trading psychology and behavioral finance, practising trader since 2013, founder of arapov.trade, author of a trading book series (Open Library ), (ORCID: 0009-0003-0430-778X ).