Japanese candlesticks represent a foundational technical analysis tool that traders employ to visualize price movements across financial markets. The methodology originated in eighteenth-century Japan through rice merchant Munehisa Homma and has since become the global standard for chart analysis. Each candlestick element displays four critical price points: open, close, high, and low for the selected time period.
The primary advantage of candlestick analysis lies in its capacity to reflect market participant psychology through visual candlestick patterns. Candle configuration, element proportions, and positioning relative to previous candles enable traders to assess the balance of power between buyers and sellers. This method applies universally across markets: equities, currency pairs, cryptocurrencies, and commodities.
Candlestick Anatomy
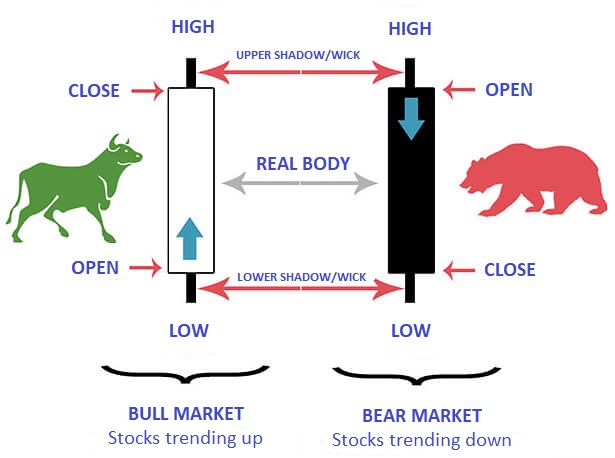
The candle body forms a rectangular area between the opening and closing price of the period. Green or white candles indicate closing above opening — a bullish scenario. Red or black candles form when closing below opening — a bearish scenario. Body size directly reflects movement intensity: large bodies indicate dominance by one side of the market.
Candle shadows appear as vertical lines extending beyond the body. The upper shadow shows the period's maximum price, the lower shadow shows the minimum. Long shadows indicate rejection of certain price levels by market participants. A candle with a long lower shadow demonstrates sellers attempted to push price down, but buyers successfully reclaimed control.
The relationship between body and shadows determines candle character and interpretation. A candle with small body and long shadows signals market indecision. A candle with large body and short shadows indicates confident movement in one direction without substantial resistance from the opposite side.
Key Reversal Formations
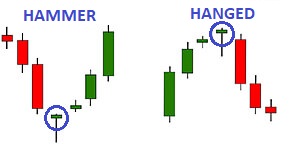
The hammer forms at the base of downward movements, characterized by a small body in the upper portion and a long lower shadow exceeding the body by at least twice. This configuration reveals: sellers actively pushed price lower, but buyers seized control and returned price to opening level. Hammer appearance at significant support levels creates potential for upward reversal.
The hanging man shares identical structure with the hammer but appears at uptrend peaks. Despite visual similarity, interpretation differs: the long lower shadow demonstrates initial signs of seller pressure. Following extended rallies, such candle appearance warns of possible buyer exhaustion.
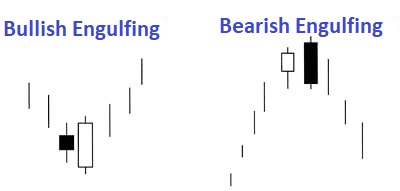
Engulfing represents a two-candle formation where the second candle body completely covers the first. Bullish engulfing occurs after declines: first candle bearish, second bullish with body exceeding the previous. Bearish engulfing forms in mirror fashion at growth peaks. This formation ranks among the most reliable due to clear demonstration of market sentiment shift.
Indecision and Continuation Formations
Doji features nearly identical opening and closing prices, forming a candle with minimal body or none at all. Such configuration reflects equilibrium between buyers and sellers. Doji appearance after extended moves may signal potential pause or reversal. Doji varieties include gravestone with long upper shadow and dragonfly with long lower shadow.
Marubozu represents a candle with large body and minimal shadows or their complete absence. Bullish marubozu demonstrates uncontested buyer dominance throughout the period. Bearish marubozu indicates equivalent seller advantage. Such candles frequently emerge at impulse movement beginnings and confirm forming trend strength.
Three-Candle Patterns
The morning star consists of three sequential candles at downward movement bases. First candle bearish with large body, second features small body and may be either color, third bullish with body closing above first candle midpoint. The pattern demonstrates gradual control transfer from sellers to buyers. I also recommend studying pin bar for the full picture.
The evening star represents a mirror formation at uptrend peaks. The sequence includes bullish candle, small-body candle, and bearish candle closing below first candle midpoint. This pattern appearance at resistance levels substantially increases downward reversal probability.
Context and Signal Confirmation
Candlestick formations gain significance exclusively within proper market context. A hammer on random chart sections holds minimal value, while hammer at key support level with indicator confirmation creates quality trading opportunity. Determining current trend through moving averages or trendlines constitutes a mandatory first analysis step.
Trading volume serves as critical filter for candlestick signal validity. Reversal formations accompanied by volume spikes possess substantially greater realization potential. Low volume during pattern formation may indicate weakness or falsity. RSI and MACD indicators provide additional confirmation through identifying overbought, oversold conditions, or divergences.
Practical Application
Timeframe selection affects candlestick signal reliability. Lower time intervals suffer market noise and generate more false patterns. Four-hour and higher timeframes provide superior signals through filtering random fluctuations. Daily and weekly charts prove especially valuable for position trading.
Integrating candlestick analysis with support and resistance levels multiplies method effectiveness. Bullish engulfing at horizontal support coinciding with Fibonacci level and RSI oversold zone forms factor confluence with high realization probability. Such comprehensive approach distinguishes professional analysis from superficial individual pattern interpretation.
Position Management
Protective stop-loss placement when trading candlestick patterns follows formation logic. Entry on hammer requires stop below candle minimum. Engulfing trades place stops beyond engulfing candle extreme. Such placement ensures position exit when trade thesis invalidates.
Potential profit to risk ratio should reach minimum two to one for ensuring positive system expectancy. Target levels derive from nearest resistance for long positions or support for shorts. Partial profit taking at intermediate targets protects achieved results.
Common Mistakes
Trading every noticed pattern without context consideration leads to excessive trade count and reduced overall performance. Quality opportunities arise when multiple factors align: correct formation at significant level with volume and indicator confirmation. Patient waiting for such situations distinguishes profitable trading.
Ignoring higher timeframes creates risk of trading against dominant trend. Bullish pattern on hourly chart loses significance when daily chart demonstrates sustained downtrend with price below key moving averages. Multi-timeframe analysis ensures trading decision alignment with overall market picture.
Conclusion
Japanese candlesticks remain indispensable for visual market dynamics analysis. Their capacity to display participant psychology through simple graphical elements makes the method accessible for learning and effective in application. Combining candlestick analysis with levels, volume, and technical indicators creates comprehensive trading decision system. To consolidate the material, also study trading basics.
Practical mastery develops through systematic historical chart study and demo account testing. Recording results in trading journal allows identifying most effective patterns for specific markets and trading styles. Disciplined adherence to entry rules, position management, and risk management transforms candlestick analysis into consistently performing trading tool.
Frequently Asked Questions
Japanese candlesticks are a graphical method displaying price movements, showing open, close, high, and low prices for a period. Each candle contains body and shadows.
Main patterns include hammer, hanging man, engulfing, doji, morning star, evening star, and marubozu. Each carries specific interpretation.
Reversal patterns form at key support or resistance levels and are confirmed by trading volume and RSI, MACD indicator readings.
Candlesticks work on all timeframes, however signals on H4 and above are considered more reliable due to reduced market noise influence.
For confirmation use trading volume, RSI and MACD indicators, support and resistance levels, and Fibonacci levels.
About the Author
Author: Igor Arapov — independent researcher in trading psychology and behavioral finance, practising trader since 2013, founder of arapov.trade, author of a trading book series (Open Library ), (ORCID: 0009-0003-0430-778X ).