Fibonacci levels hold a special place among technical analysis tools, enabling traders to forecast price movements, identify support and resistance zones, and find optimal market entry points. This method, based on mathematical ratios from the famous sequence, is applied across all financial markets: Forex , stock markets, cryptocurrencies , and commodity exchanges.
What is the Fibonacci Sequence?
The Fibonacci sequence was discovered by Italian mathematician Leonardo Fibonacci in the 13th century. This numerical sequence (0, 1, 1, 2, 3, 5, 8, 13, 21, and beyond) is formed by adding two preceding numbers to obtain the next. Ratios between numbers in this sequence generate coefficients that traders use to construct retracement and projection levels on price charts.
Application of Fibonacci levels in trading is based on the observation that markets move according to certain proportions that repeat across different timeframes and assets. Traders use these levels to identify zones where price is likely to react — whether through pullback, reversal, or trend continuation.
Key Fibonacci Retracement Levels
Fibonacci levels are divided into retracement and extension categories. Retracement levels help determine how deeply price may pull back after an impulse move, while extension levels are used for forecasting movement targets after a breakout.
The 23.6% Level
A weak retracement level typical of strong trends. Price rarely lingers at this mark, but it may signal short-term pullbacks in powerful impulse movements.
The 38.2% Level
A popular level for short-term trades, often serving as the first significant support or resistance zone. Shallow retracement to this level indicates strength in the primary trend.
The 50% Level
A psychologically important level, though formally not part of the Fibonacci sequence. Price often retraces half of the previous movement, making this mark significant for many traders.
The 61.8% Level — Golden Ratio
The golden ratio is the most significant Fibonacci level. It often acts as a strong support zone in uptrends and resistance in downtrends. Many professional traders view this level as the optimal entry point in the direction of the main trend.
The 78.6% Level
A deep retracement level after which price may reverse or continue movement depending on market context. Used for placing protective stop-losses.
Constructing Fibonacci Levels
The process of constructing Fibonacci levels is available on most trading platforms, including MetaTrader, TradingView, and others. For correct construction, identify two key extremes on the chart — the high and low of a significant price movement — and draw the tool between these points.
In an uptrend, draw the tool from the local low to high; in a downtrend — from high to low. The platform will automatically calculate and display retracement levels. Selecting significant extremes is critically important — building on minor price fluctuations leads to false signals.
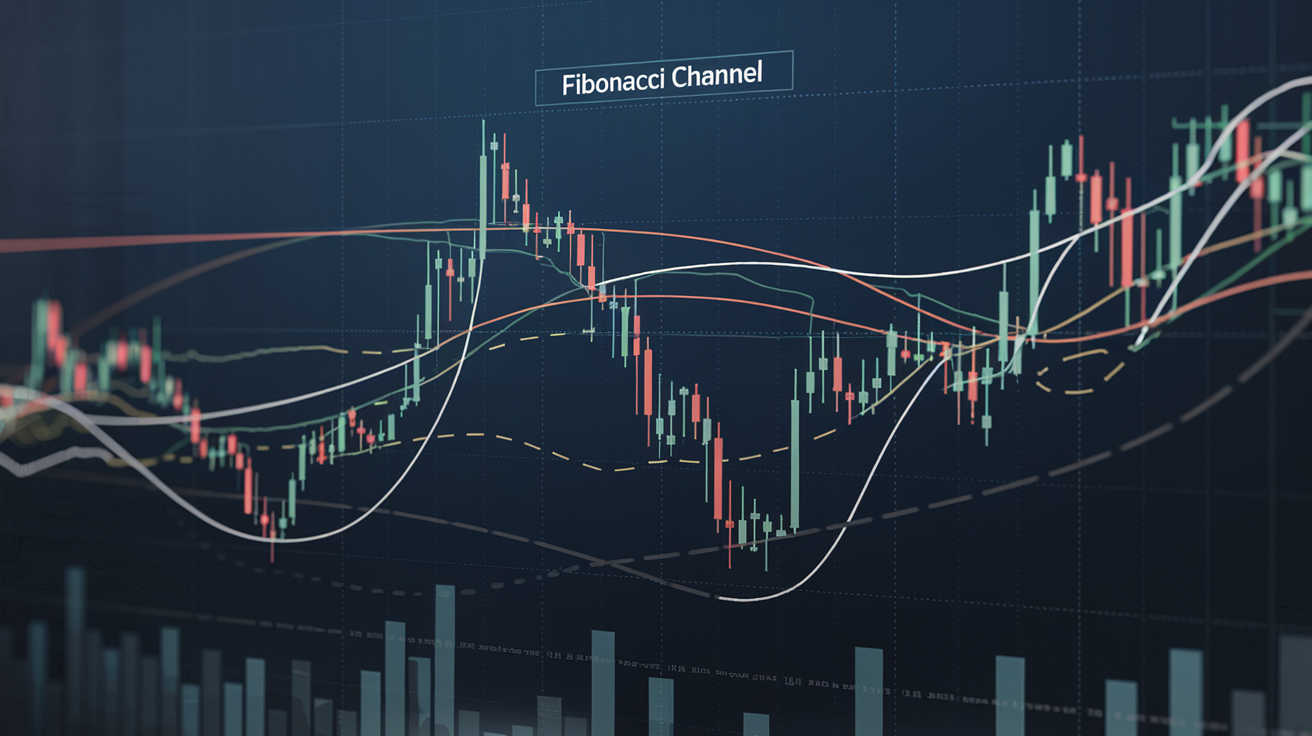
Fibonacci Extensions
Fibonacci extensions are used for forecasting price movement targets after key level breakouts. Main extension levels include 127.2% (first target after breakout), 161.8% (key profit-taking target), and 261.8% (for highly volatile markets).
For example, if price breaks through the high after a retracement to the 61.8% level, a trader may set take-profit at the 161.8% extension level, anticipating trend continuation.
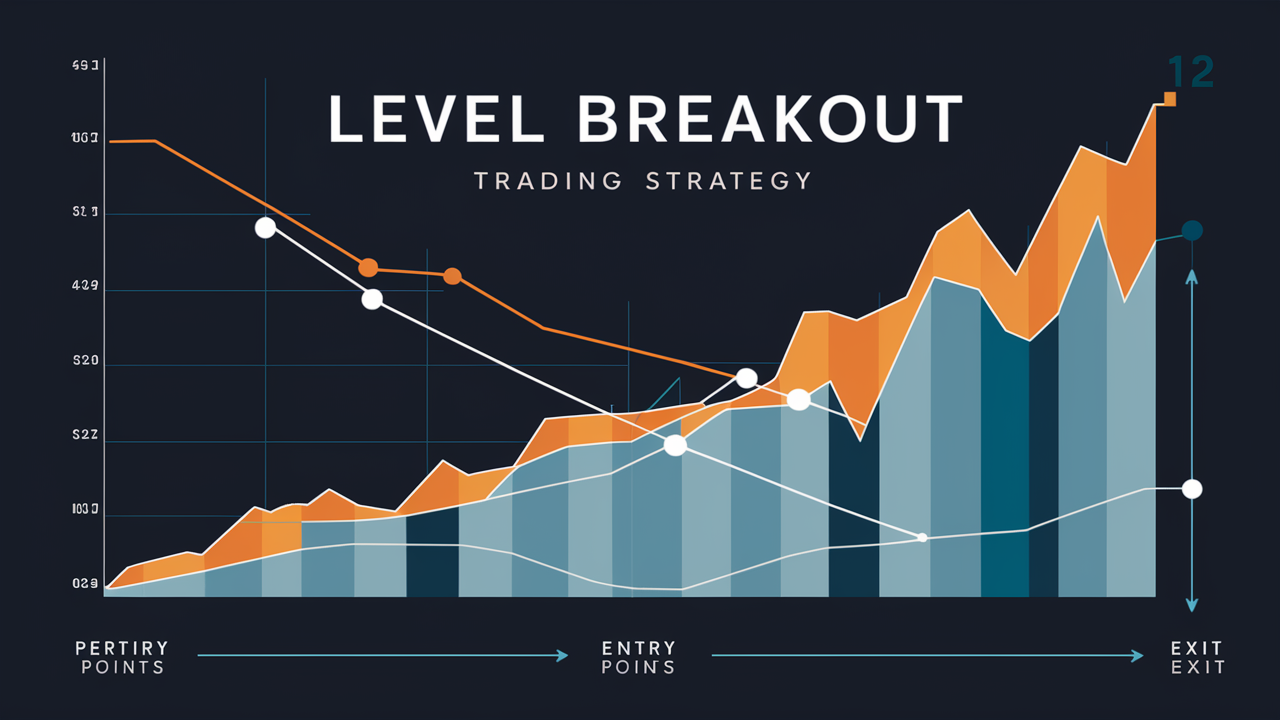
Fibonacci Level Trading Strategies
Pullback Trading
This strategy involves entering trades at retracement levels in the direction of the main trend. After identifying the trend using moving averages or trendlines, the trader waits for price pullback to 38.2%, 50%, or 61.8% levels. Candlestick patterns or indicator signals serve as confirmation.
Practical example: in an uptrend on EUR/USD pair, after an impulse move from 1.0800 to 1.1000, the trader constructs Fibonacci levels. Price retraces to the 61.8% level (around 1.0876), a bullish pin bar forms, RSI indicator shows exit from oversold zone. The trader opens a long position with take-profit at the previous high and stop-loss below the 78.6% level.
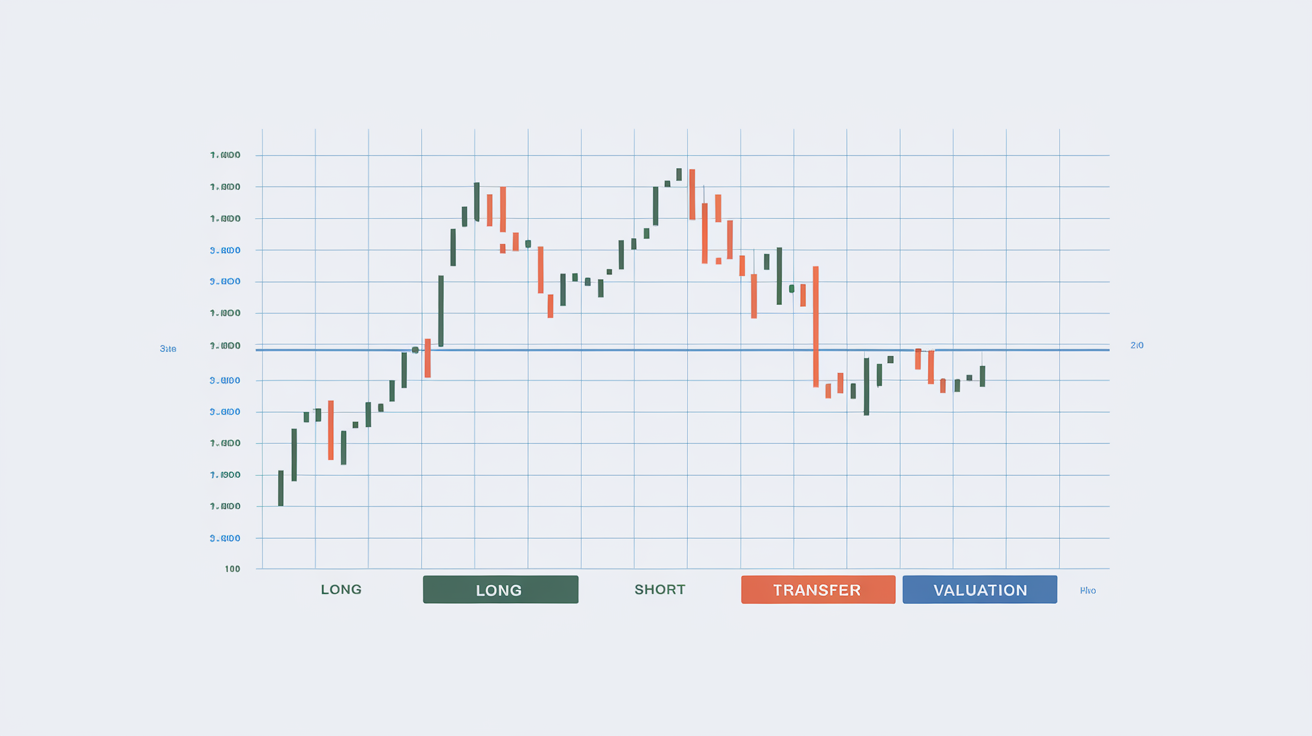
Breakout Trading
This strategy is used when price overcomes a key level, signaling trend continuation. Entry is executed after breaking the 100% level with volume confirmation. Targets are set at extension levels of 127.2%, 161.8%, or 261.8%. This methodology is particularly effective in highly volatile markets like cryptocurrencies, where impulse movements can be substantial.
Combining with Clusters
The strongest signals occur in zones where Fibonacci levels coincide with other technical factors: horizontal support and resistance levels, moving averages, or supply and demand zones. Such clusters significantly increase successful trade probability.
Double Confirmation Strategy
This approach involves using Fibonacci levels together with Elliott Wave Theory or Wyckoff Method. The trader identifies market wave structure and applies Fibonacci levels to determine potential completion points of corrective waves. For example, second wave correction often ends at the 50-61.8% level, while the fourth wave typically completes at the 38.2% level.
Common Mistakes When Working with Fibonacci Levels
Despite the apparent simplicity of the tool, traders often make mistakes that reduce analysis effectiveness. Building levels on minor price fluctuations leads to numerous false signals. Always select significant extremes corresponding to clear impulse movements.
Another common mistake is expecting precise price reaction at a level. In real trading, price rarely stops exactly at a Fibonacci mark. Consider levels as zones several pips wide rather than absolutely precise lines. Using Fibonacci levels in isolation without confirmation from other analysis methods significantly reduces signal reliability.
Fibonacci Across Different Markets
In the Forex currency market, Fibonacci levels demonstrate high effectiveness due to liquidity and technical nature of major currency pair movements. In stock markets, the tool works well for analyzing large company stocks and indices. In cryptocurrency markets, due to high volatility, using wider zones and waiting for confirming signals before position entry is recommended.
Advantages of Fibonacci Levels
Tool advantages include universal applicability across any markets and timeframes, ease of construction and interpretation, and high effectiveness in forecasting price reaction zones. Fibonacci levels combine excellently with other analysis methods, enabling complex trading strategies. The psychological factor of widespread use creates a self-fulfilling prophecy effect.
The tool allows traders to predetermine potential entry points and order placement, promoting a disciplined trading approach. Fibonacci levels help establish logical targets for profit-taking and protective stop-loss placement. This makes capital management more structured and reduces the emotional component in trading decisions.
Limitations and Risks
Despite popularity, Fibonacci levels have limitations. During high volatility and important economic news releases, the market may ignore technical levels. Without confirmation from other tools, signals at Fibonacci levels may prove false. Subjectivity in selecting extremes for construction also affects analysis accuracy.
It is important to understand that Fibonacci levels do not guarantee precise price reversal. They merely indicate zones of increased probability for market reaction. Market makers and large players know about the popularity of these levels and may use them to collect liquidity, creating false breakouts before the true movement.
Practical Recommendations
For effective Fibonacci level use, focus on higher timeframes (H4, D1, W1) where signals are more reliable. Always seek confirmation from other analysis tools before opening positions. I recommend that beginners first study the trading rules. Set stop-losses beyond key levels and maintain a risk-to-reward ratio of at least 1:2. Test strategies on historical data before applying in live trading.
Conclusion
Fibonacci levels represent a powerful technical analysis tool that helps traders find key zones for market entry and exit. To consolidate this material, also study trading channels. Their effective application requires understanding construction principles, ability to combine with other analysis methods, and strict risk management. With a systematic approach, Fibonacci levels become a reliable component of a profitable trading strategy.
Frequently Asked Questions
Fibonacci levels are a technical analysis tool based on the mathematical Fibonacci number sequence. Key levels (23.6%, 38.2%, 50%, 61.8%, 78.6%) are used to identify support and resistance zones, forecast retracement depth, and find market entry points.
The 61.8% level, known as the golden ratio, is considered most significant. It often acts as a strong support or resistance zone. The 50% (psychological) and 38.2% (first significant retracement) levels are also important. Level selection depends on trend strength and market context.
To draw Fibonacci levels, select significant extremes — local high and low of a price movement. In an uptrend, draw the tool from low to high; in a downtrend — from high to low. The platform will automatically calculate and display retracement levels.
Fibonacci extensions are used to determine price movement targets after key level breakouts. Main extension levels: 127.2% (first target), 161.8% (key profit-taking target), 261.8% and 423.6% (for highly volatile markets). They help set take-profit orders.
Fibonacci levels work due to widespread use by traders, creating a self-fulfilling prophecy effect. Many market participants place orders at these levels, reinforcing their significance. Additionally, Fibonacci numbers reflect natural proportions found in nature and market structures.
About the Author
Author: Igor Arapov — independent researcher in trading psychology and behavioral finance, practising trader since 2013, founder of arapov.trade, author of a trading book series (Open Library ), (ORCID: 0009-0003-0430-778X ).