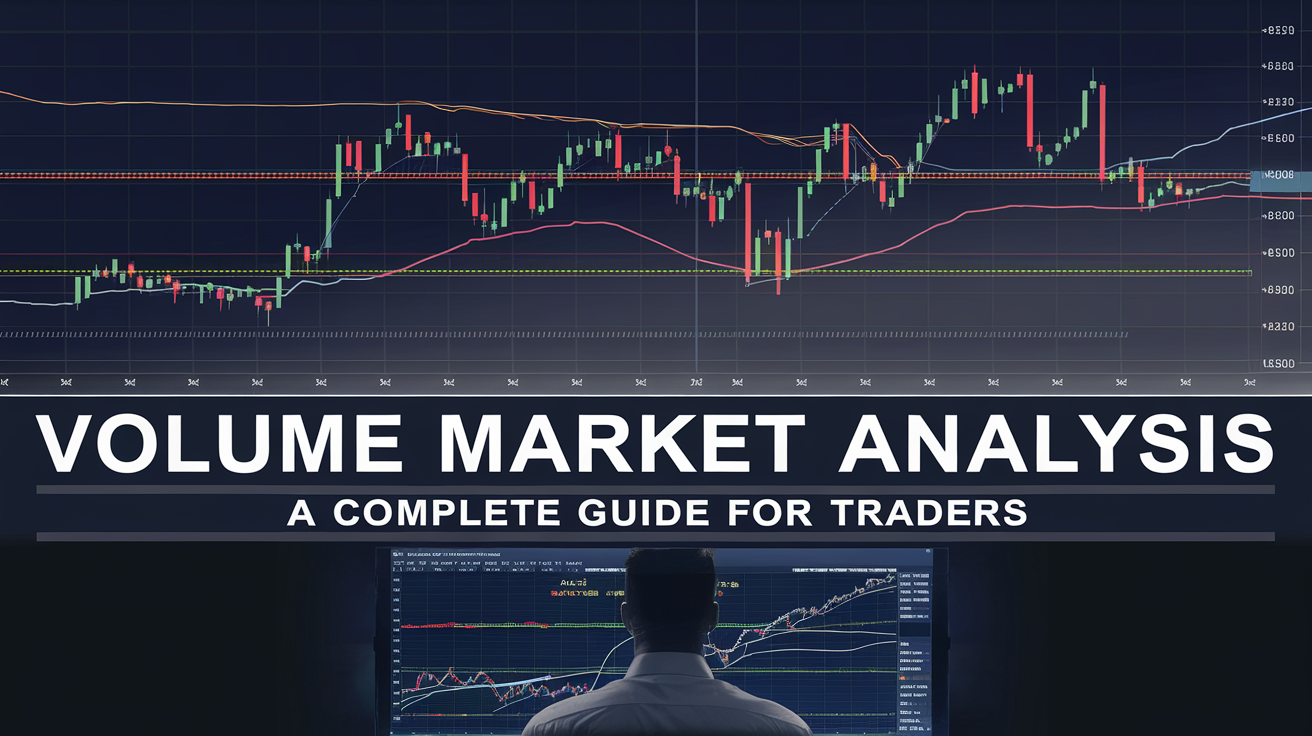
Volume analysis is a powerful technical analysis method based on studying trading volumes that reveal market participant activity. Unlike traditional analysis focusing solely on price, volume analysis helps identify the true intentions of large players and shows where market makers direct liquidity.
Understanding volume provides traders with a significant competitive advantage in financial markets. Price can deceive through false breakouts and manipulative moves, but volume always reveals the real picture of what is happening. When large players accumulate or distribute positions, it inevitably leaves traces in volume data. To understand this topic more deeply, I recommend studying the Wyckoff Method .
Fundamental Principles of Volume Analysis
Successful application of volume analysis requires understanding several key principles that form the foundation of this method.
Volume precedes price — this is a fundamental principle. Sharp increases in volume often indicate an upcoming impulsive price move. Large players cannot instantly build or exit positions without leaving traces in volume data.
Hidden signals from large players manifest through abnormal volumes. High volumes at certain levels indicate position accumulation by institutional traders. These zones become important support and resistance levels that traders should monitor closely.
Liquidity and volatility are directly connected to volume. Higher volumes mean greater liquidity and probability of significant movement. Low volumes are often accompanied by choppy moves and false signals that can trap inexperienced traders.
Key Volume Analysis Tools
Volume analysis encompasses numerous tools that allow traders to understand market processes more deeply. Let us examine the most effective ones.
Volume Profile is an indicator showing volume distribution across different price levels over a specific period. It helps identify key support and resistance levels , determines zones of maximum volume accumulation called POC (Point of Control), and shows areas of market balance and imbalance.
Delta Volume analyzes the difference between active buyers and sellers, showing real market pressure. Positive delta means market buys prevail, negative delta indicates selling dominance. Neutral delta suggests equilibrium between participants.
Footprint Charts allow traders to analyze exact trade volumes within each candle. These charts show where large trades occur, reveal hidden market maker activity, and are used to find low-risk entry zones.
Open Interest is particularly important for futures analysis. It shows the number of open positions and their dynamics. Rising open interest indicates new participant attraction, declining open interest suggests players exiting the market.
Volume and Trend Relationship
Volume plays a key role in assessing trend sustainability and allows distinguishing genuine movement from weak continuation attempts.
Rising trend with increasing volume confirms upward movement, indicating strong buyer interest. Rising trend with declining volume signals potential weakening and probability of correction or reversal.
Range with increasing volume may indicate an approaching breakout from consolidation, especially when volume growth accompanies an impulse candle. Declining trend with rising volume confirms bearish market sentiment and possible continuation of the decline.
Abnormal volumes require special attention. Sharp volume spikes often signal key changes in market balance and may precede significant moves that create trading opportunities.
False Breakouts and Volume Analysis
Trend Volume Analysis helps distinguish false breakouts from genuine ones. When price breaks an important level without significant volume increase, it may be a trap for retail traders.
True breakout is accompanied by volume growth, confirming large player participation. After a true breakout, price typically continues moving in the breakout direction without returning to the level.
False breakout is characterized by sharp volume decline after the break. In this case, price will likely return to the range. Low-volume breakout may indicate insufficient liquidity and quick price reversal.
Accumulation and Distribution Zones
Large institutional players rarely open trades instantly — they distribute positions at important levels, creating accumulation zones and distribution zones.
Accumulation zone represents extended sideways movement with high volumes before a strong upward move. Here, large players gradually build positions without allowing price to rise significantly.
Distribution zone is consolidation after prolonged growth before a bearish trend begins. In this zone, large players gradually close long positions, transferring them to retail traders.
Breakout from range with significant volume increase confirms likely formation of a new trend.
Volume Analysis and Candlestick Patterns
Candlestick patterns combined with volume analysis provide more reliable trading signals. Volume confirms candlestick model strength and helps identify genuine reversals.
Pin bar on high volume is significantly more reliable than low-volume pin bar. Bullish pin bar at support level with high volume signals presence of large buyers. Bearish pin bar at resistance with volume increase indicates seller activity.
Engulfing pattern with volume increase confirms market participant intentions. Bullish engulfing with high volume often leads to continued growth, bearish engulfing to downtrend.
Practical Application of Volume Analysis
For effective volume analysis use, following a clear algorithm and considering several key aspects is important.
Determine overall market context. Assess current market state since volume levels work differently depending on the phase. In trending markets, evaluate whether volume aligns with trend direction. In ranges, high volumes may signal accumulation.
Use multiple timeframe analysis. On daily and four-hour charts, identify global trend and key liquidity levels. On hourly and thirty-minute charts, detect accumulation zones. On fifteen-minute and five-minute charts, look for entry points.
Analyze volume at key levels. High volume at support confirms buyer interest. High volume at resistance indicates seller pressure. Impulsive breakout with volume increase confirms movement strength.
Volume Analysis Across Different Markets
Volume analysis applies to various financial markets but has specific features depending on instrument type.
Stock market provides real volume data, making analysis most accurate. Consider open interest volume on options and futures volumes.
On Forex , volume is represented by tick volume showing price change count rather than actual trade volume. Nevertheless, tick volume correlates with real activity.
On cryptocurrency market , volume across different exchanges may vary significantly, requiring analysis of multiple sources. Consider each exchange specifics and possible manipulations.

Common Volume Analysis Mistakes
Many traders make errors leading to incorrect market data interpretation.
Ignoring market context is a primary mistake. Volume analysis does not work in isolation; it must be used together with other technical analysis methods.
Incorrect true volume identification occurs when traders do not consider different market specifics. Forex provides only tick volume; crypto exchange data may differ.
Ignoring abnormal volumes may lead to missing important signals. Sharp volume spikes without understanding their cause can be misleading.
Selecting a Platform for Volume Analysis
For effective volume analysis, using reliable trading platforms with quality indicators and access to exchange data is essential.
TradingView provides access to basic volume indicators, simple exchange integration, and convenient interface. This is an excellent choice for beginning traders.
ATAS offers professional volume and order flow analysis, futures, stocks and cryptocurrency support, and advanced Footprint Charts tools.
Bookmap specializes in deep liquidity analysis with heatmaps, large order flow analysis, and multi-market support.
Combining Volume Analysis with Other Methods
Volume analysis is most effective when combined with other technical analysis methods. Combining different approaches increases trading signal accuracy and reduces false entries.
Fibonacci levels combined with volume zones produce powerful signals. When Fibonacci retracement level coincides with high volume zone, reversal probability increases significantly.
Trend lines confirmed by volume become more significant. Trend line breakout with sharp volume increase confirms trend change, while low-volume breakout often proves false.
VWAP indicator shows volume-weighted average price and helps determine whether asset trades above or below fair value. Institutional traders often use VWAP as benchmark for position entry.
Conclusion
Market volume analysis is a powerful tool helping traders understand the true intentions of large players. It allows finding key support and resistance levels, identifying market maker actions, determining true breakouts, and working effectively with other analysis methods. To consolidate this material, also study Wyckoff Volumes .
For successful volume analysis use, choose quality platform with volume data, combine analysis with multiple timeframe approach, use Volume Profile, Delta Volume and Footprint Charts indicators, monitor volume correlation with market events.
Mastering volume analysis requires practice and patience, but over time it becomes a reliable assistant in your trading, helping make more accurate and informed decisions across all financial markets.
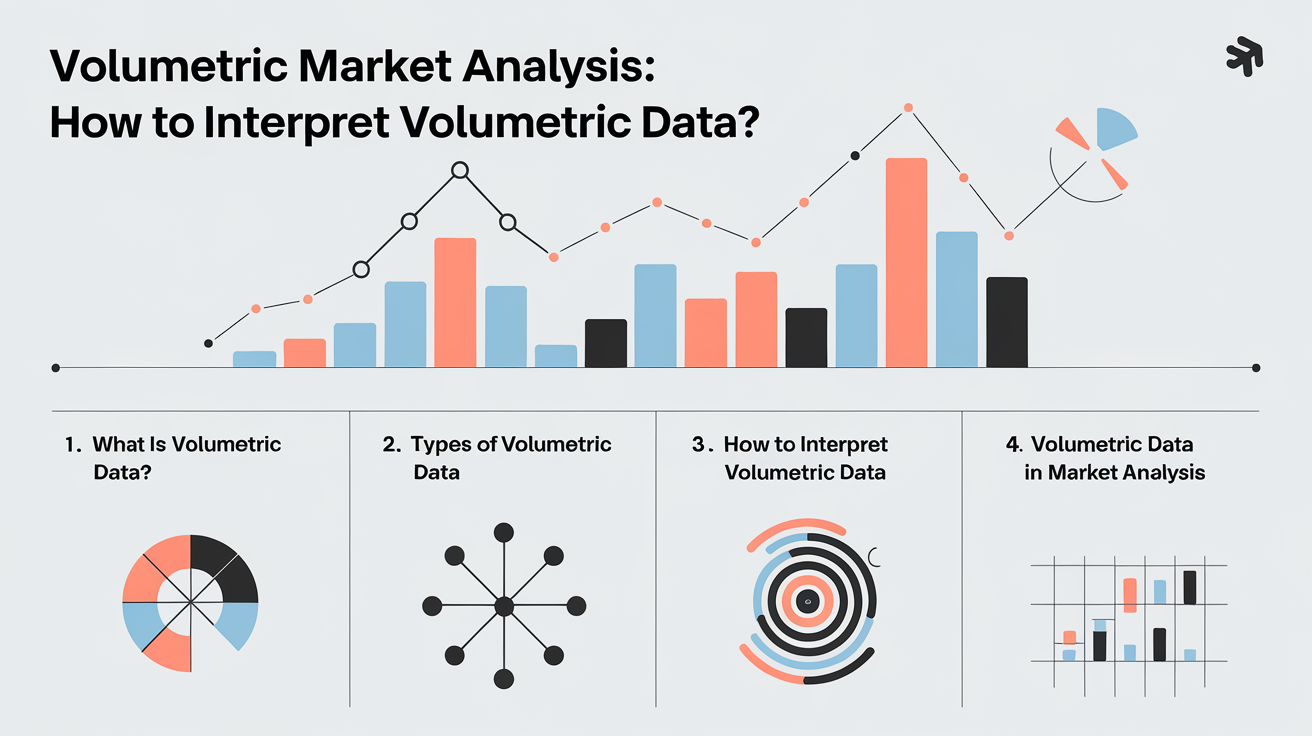
Frequently Asked Questions About Volume Analysis
Volume analysis is a technical analysis method based on studying trading volumes. It helps identify the true intentions of large players and determine where they direct liquidity by analyzing the number of trades at different price levels.
Main tools include: Volume Profile (volume distribution by price), Delta Volume (difference between buys and sells), Footprint Charts (detailed order analysis), Open Interest (open positions on futures markets).
Rising trend with increasing volume confirms movement strength. Declining volume during price rise signals trend weakening. High volume on level breakout confirms its validity.
True breakout is accompanied by sharp volume increase and continued movement. False breakout is characterized by low volume or its decline after breakout, often leading to price returning to the range.
Best platforms for volume analysis: TradingView (basic indicators), ATAS (professional order flow analysis), Bookmap (liquidity heatmaps). Choice depends on market and trading style.
About the Author
Author: Igor Arapov — independent researcher in trading psychology and behavioral finance, practising trader since 2013, founder of arapov.trade, author of a trading book series (Open Library ), (ORCID: 0009-0003-0430-778X ).