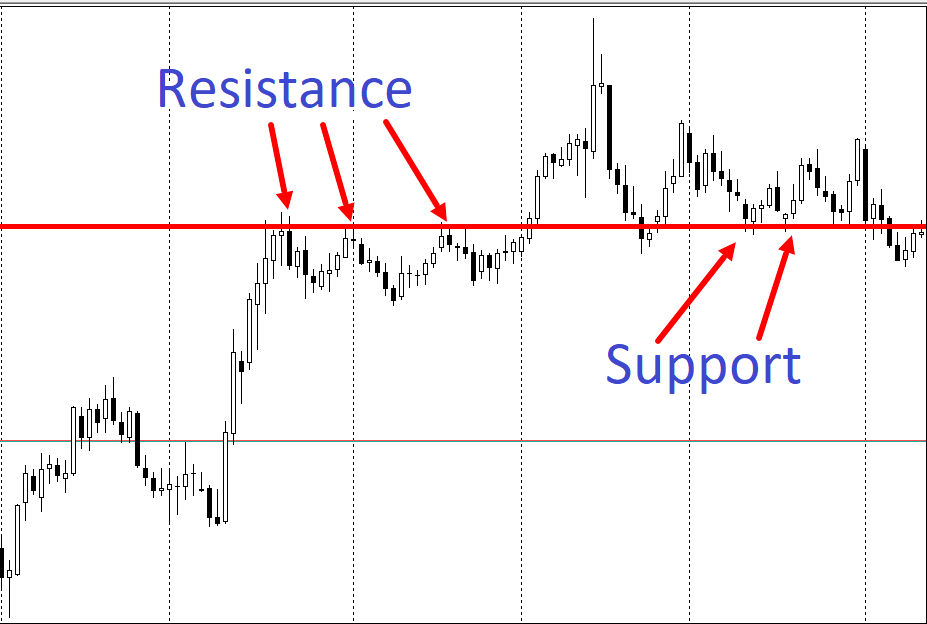
Support and resistance levels represent fundamental technical analysis tools that define key price zones on charts. These horizontal areas mark locations where the balance of power between buyers and sellers historically shifted, causing reversals or movement slowdowns. Understanding level formation mechanics opens opportunities for traders to precisely identify position entry and exit points.
Support level forms in zones where declining price encounters sufficient buying interest to halt the descent. Buyers perceive such price areas as attractive for position accumulation, creating demand exceeding supply. To understand this topic more deeply, I recommend studying peak volume levels. Resistance level emerges in opposite situations: rising price reaches zones where sellers actively take profits or open short positions, stopping upward movement.
Level Formation Mechanics
Levels emerge from collective market participant behavior. When price reaches certain marks and reverses, traders remember these points. Upon subsequent approach to the same zone, participants expect similar reactions, creating self-fulfilling prophecy. Large institutional players place significant orders near key levels, enhancing their importance.
Psychological levels form around round price values: one hundred dollars, one thousand, ten thousand. Human psychology gravitates toward rounded numbers, leading to order concentration near such marks. Traders set stop-losses and take-profits at round numbers, creating zones of heightened activity.
Level Building Methods
Horizontal levels draw through points where price repeatedly stopped or reversed. Optimal approach involves working with zones ten to twenty pips wide instead of thin lines, since markets rarely react to levels with absolute precision. Candle body and shadow touches factor into zone boundary determination.
Dynamic levels comprise moving averages of various periods. The two-hundred-period moving average on daily charts serves as significant reference for long-term traders. Price frequently finds support or resistance when touching these dynamic lines, especially in trending markets.
Assessing Level Strength
Testing frequency determines level reliability: zones withstanding five to six touches possess greater strength than levels with single bounces. However, each subsequent test gradually weakens levels as defender orders progressively execute. After multiple touches, breakout probability increases.
Formation timeframe affects level significance. Horizontals on weekly charts carry substantially more weight than similar lines on five-minute intervals. Higher timeframe levels attract attention from major participants and contain significant order volumes. Trading volume near levels confirms institutional interest.
Bounce Trading
Bounce strategy involves opening positions when price approaches levels expecting reversal. Buying occurs near support after confirming signals appear: reversal candlestick patterns, oscillator divergence, volume increase. Selling executes similarly near resistance upon signs of weakening bullish momentum.
Signal confirmation proves critically important for filtering false movements. RSI indicator in oversold territory during support touch strengthens bounce probability. Hammer or bullish engulfing formation at levels provides visual confirmation of buyer readiness to defend zones. Multiple factor combination forms high-probability entry points.
Breakout Trading
Level Breakout occurs when price passes through levels and holds beyond them. True breakouts accompany increased trading volume and candle closes outside zones. Conservative approach involves awaiting retest — price return to broken level for testing from opposite side.
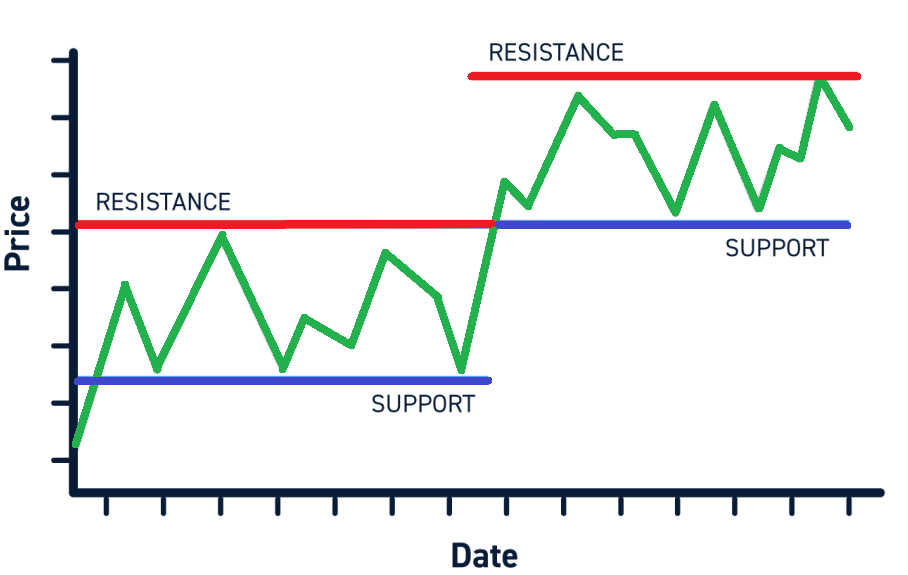
Mirror level emerges after successful breakout: former support transforms into resistance, while broken resistance becomes support. This phenomenon stems from participant psychology changes: traders who missed breakout await price return for position entry. Mirror level retest provides optimal entry points with favorable risk to reward ratios.
False Breakouts
False breakout represents situations where price temporarily exits level boundaries but quickly returns. Such movements frequently get provoked by major players collecting liquidity — triggering retail trader stop-losses placed beyond levels. Recognizing false breakouts opens opportunities for counter-trend trading.
False breakout signs include: absence of accompanying volume, reversal candle formation beyond level, quick price return inside range. Awaiting candle close after breakout reduces trap probability. Professional traders use false breakouts as signals for opposite direction entry.
Combining with Other Tools
Fibonacci levels strengthen horizontal zone significance. Support level coinciding with sixty-one point eight percent retracement creates factor confluence with enhanced execution probability. Moving averages crossing horizontal levels form dynamic interest zones.
Volume analysis through volume profile reveals price areas with maximum trading activity. These zones frequently coincide with key support and resistance levels, confirming their significance. High accumulated volume indicates institutional participant presence and increases level reliability.
Position Management
Stop-loss placement extends beyond levels accounting for market noise. When trading support bounces, protective orders block set below zones at distances excluding triggering from minor fluctuations. ATR indicator usage helps determine adequate stop distance depending on current volatility.
Take-profit targets next significant level. Potential profit to risk ratio should reach minimum two to one ensuring positive system expectancy. Partial profit taking at intermediate levels protects achieved results while maintaining position portions for further movement.
Common Mistakes
Overloading charts with numerous levels creates information noise and complicates decision making. Focusing on key higher timeframe zones ensures analysis clarity. Three to five significant levels suffice for effective trading on most instruments.
Ignoring market context leads to losing trades. In strong trends levels break more frequently, while ranging markets provide quality bounces. Determining current market phase through movement structure analysis or ADX indicator helps select appropriate level working strategies.
Conclusion
Support and resistance levels remain universal technical analysis tools applicable across any markets and timeframes. Their construction simplicity combines with high practical value when properly applied. Combining levels with volume analysis, candlestick patterns, and indicators creates comprehensive trading decision systems.
Developing level working skills requires practice on historical data and demo accounts. Maintaining trading journals recording various level performance allows identifying most effective zones for specific instruments. Disciplined adherence to entry rules and risk management transforms level analysis into consistently performing trading methodology.
Frequently Asked Questions
Support level is a price zone on charts where decline stops due to buyer activity perceiving the area as attractive for position accumulation.
Resistance level is a zone where price growth slows or stops due to prevailing seller supply taking profits or opening short positions.
Level strength is determined by testing frequency, trading volume near zones, formation timeframe, and coincidence with other analysis tools.
Mirror level emerges after breakout: former support becomes resistance, while broken resistance transforms into support.
Wait for candle close beyond level with high volume, then consider entry after retest of broken zone from opposite side.
About the Author
Author: Igor Arapov — independent researcher in trading psychology and behavioral finance, practising trader since 2013, founder of arapov.trade, author of a trading book series (Open Library ), (ORCID: 0009-0003-0430-778X ).