Trading Drawdown: Risk Management and Capital Recovery
Account drawdown tests every trader's resilience and professional discipline. Temporary capital decline occurs even to experienced professionals with years of market experience. The ability to control drawdown separates consistently profitable traders from those who blow their accounts after a few losing trades. To understand this topic more deeply, I recommend studying capital preservation.
Every trading account inevitably goes through periods of losses. The question is not whether drawdowns will occur, but how well you prepare for them and how you act during these critical moments. Proper drawdown management preserves capital, prevents emotional decisions, and allows you to continue trading according to your system.
This comprehensive guide examines drawdown mechanics, classification, causes, and practical control methods. Mastering these principles enables you to build a robust trading system with predictable risk levels and consistent profitability.
Understanding Drawdown Types
Drawdown represents the difference between an account's peak value and its current or minimum level over a specific period. This metric is expressed in percentage or absolute terms and serves as a key indicator for evaluating trading strategy quality and risk management effectiveness.
Maximum drawdown captures the largest capital decline from peak to trough across entire trading history or a selected analysis period. If an account grows from ten thousand to fifteen thousand dollars, then falls to twelve thousand, maximum drawdown equals twenty percent of the peak value. This metric is critical for investors and fund managers as it demonstrates the worst-case scenario.
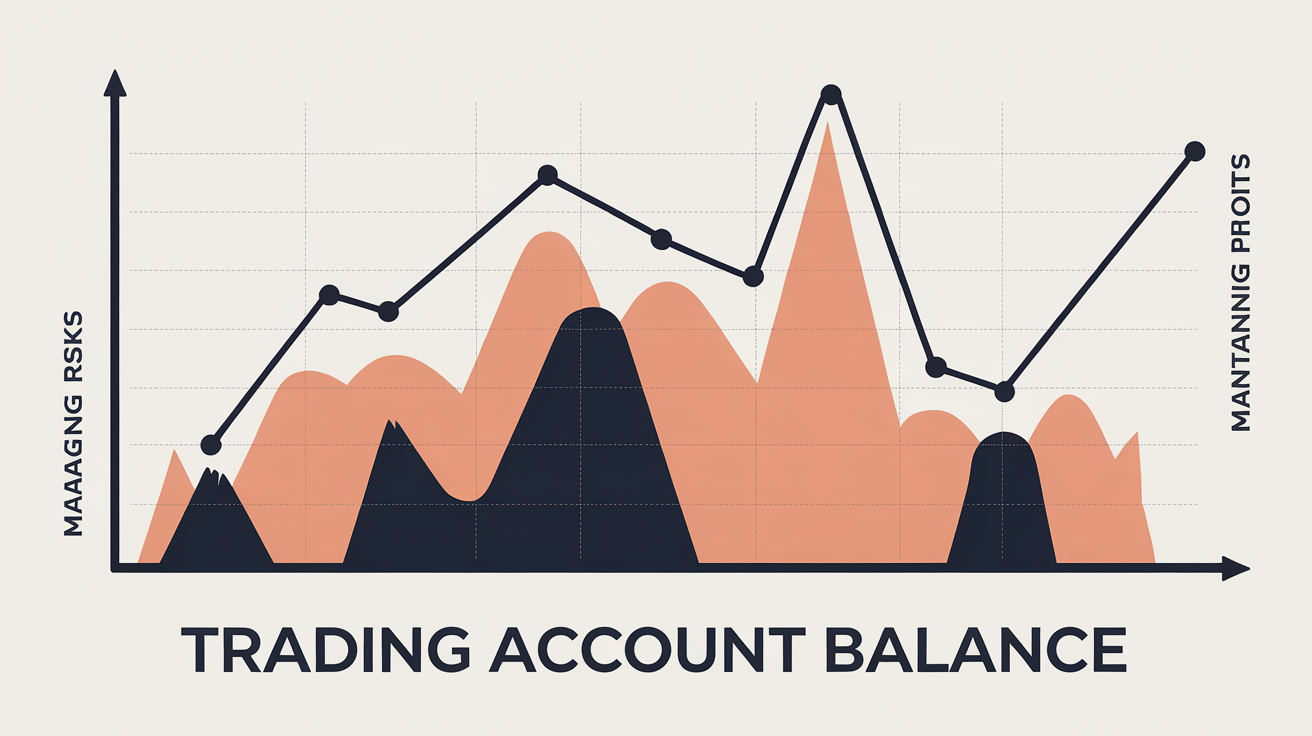
Current drawdown reflects the immediate decline relative to the most recent account peak. This dynamic metric changes with every trade, whether opening or closing positions. Traders use it for real-time account monitoring and decisions about position size adjustments.
Average drawdown is calculated as the arithmetic mean of all drawdowns over the analysis period. This metric helps evaluate typical strategy risk levels and stability over time. Low average drawdown combined with solid returns indicates a quality trading system with effective risk controls.
Relative drawdown is measured in percentage terms and enables comparison of strategies with different capital sizes on equal footing. Absolute drawdown is expressed in currency units and matters for understanding actual financial losses.
Root Causes of Drawdowns
Drawdowns arise from multiple factors related to both market conditions and trader actions. Understanding these factors represents the first step toward effective control and loss minimization. Read more about this in the article: Why Traders Lose.
Market volatility creates conditions for sharp price movements against open positions. Release of important economic data, central bank statements, and geopolitical events can reverse markets within minutes. Even correctly initiated trades may temporarily show losses due to short-term volatility.
Risk management errors constitute the primary cause of deep and prolonged drawdowns. Oversized positions, absent stop-losses, and neglected diversification transform minor losses into critical capital destruction. Risking more than two percent per trade significantly increases severe drawdown probability.
Psychological factors amplify technical drawdowns exponentially. Fear prompts premature closure of profitable trades while holding losers hoping for reversals. Greed pushes toward unjustified position increases after winning streaks. The desire to recover quickly after losses triggers impulsive entries without proper analysis.
Strategy mismatch with current market conditions leads to systematic losses. Trend-following systems generate drawdowns in ranging markets, while counter-trend approaches suffer during strong directional moves. Without adapting to the current market phase, traders face extended losing periods.
Analyzing Drawdown Metrics
Systematic drawdown analysis transforms losses into valuable information for trading improvement. Key metrics enable objective strategy evaluation and identification of areas for enhancement.
Recovery factor shows the ratio of accumulated profit to maximum drawdown. Values above three indicate strong performance, meaning the strategy earned triple its worst decline. A low recovery factor signals disproportionate risk relative to returns.
Recovery time measures the period required to return to the previous peak after a drawdown. Short recovery time indicates system resilience and ability to quickly compensate losses. Extended recovery may signal fundamental strategy problems or inability to adapt to market conditions.
Drawdown frequency and time distribution reveal hidden patterns. If losses concentrate on specific weekdays or during particular economic events, this indicates the need to adjust approach during those periods.
Individual drawdown depth relative to average helps identify anomalies. Single deep declines require detailed analysis to prevent recurrence. Regular drawdowns of similar magnitude indicate systematic strategy characteristics requiring attention.
Drawdown Minimization Methods
Drawdown control begins with proper risk definition per trade. The classic rule limits loss to one to two percent of capital per position. Ten consecutive losing trades result in approximately ten to eighteen percent account decline—unpleasant but fully recoverable.
Stop-loss orders are mandatory for every open position without exception. Protective order placement should be based on technical analysis, not arbitrary comfort levels. A stop behind support or resistance levels has logical justification and is less prone to random triggering from market noise.
Diversification spreads risk across multiple instruments and markets. Correlation between assets should be low, otherwise diversification loses practical meaning. Correlated positions decline simultaneously, amplifying overall portfolio drawdown.
Reducing position sizes during growing losses protects remaining capital. When drawdown reaches five percent, cutting trade volume in half is prudent. At ten percent, pause active trading for thorough situation analysis.
Psychological Resilience During Drawdowns
Psychological preparation determines trader behavior during drawdowns as much as technical skills. Pre-defined rules eliminate emotional decisions under pressure. To apply this knowledge, study the psychology of averaging.
A trading plan must include clear action scenarios for different drawdown levels. Written rules remove the need to make complex decisions under mounting losses. The trader follows an algorithm rather than momentary emotions.
Expecting drawdowns as a normal part of trading reduces stress when they occur. Understanding that ten consecutive losing trades are statistically possible even with a sixty percent win rate fundamentally changes the attitude toward temporary losses.
Maintaining a trading journal helps track emotional state and its influence on decisions. Record analysis reveals destructive behavior patterns leading to increased drawdowns.
Trading pauses after losing streaks prevent loss escalation. A stop rule upon reaching daily or weekly loss limits protects against destructive trading sessions when emotions take over.
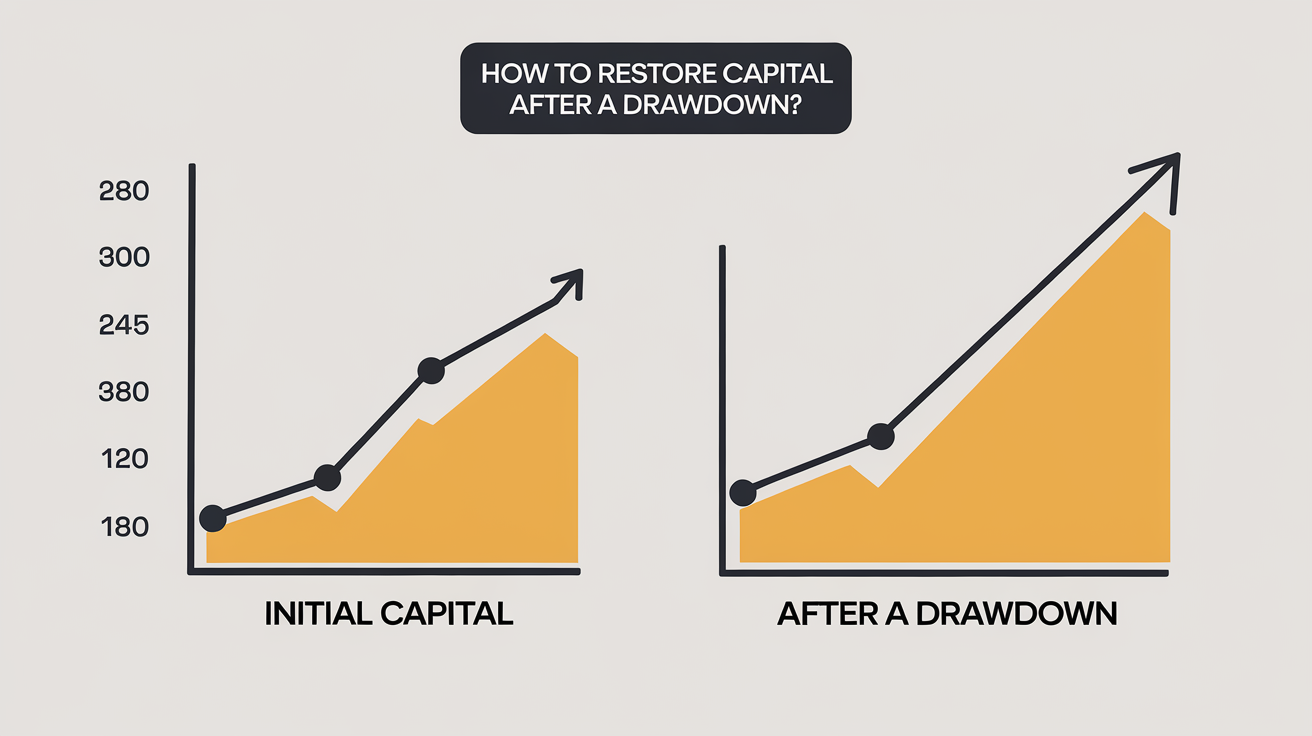
Capital Recovery After Drawdown
Capital recovery after drawdown requires patience and systematic approach. Recovery mathematics are harsh: compensating a fifty percent drawdown requires one hundred percent profit on remaining capital.
Reducing risks during recovery accelerates the process by preventing new deep drawdowns. Halving position size reduces account volatility and enables calmer trading.
Analyzing drawdown causes is mandatory before resuming active trading. If losses resulted from rule violations, discipline must be strengthened. If market conditions changed, wait for a suitable phase. If the strategy stopped working, optimize parameters.
Focusing on trade quality rather than quantity helps restore confidence and capital. Selecting only the best setups with high success probability creates winning streaks and positive account momentum.
Gradually increasing position sizes as capital grows allows profit compounding without sharp risk spikes. The rule to increase volume only after reaching new account highs protects against premature scaling.
Professional Drawdown Control Strategies
Professional traders employ multiple methods to minimize drawdown in practice. Position trading with multi-day to multi-week holding periods reduces intraday noise and random fluctuations. Fewer trades mean fewer opportunities for mistakes.
Correlation analysis before opening new positions prevents risk concentration in one direction. Adding an asset highly correlated with existing positions effectively increases overall bet size.
Using multiple timeframes to confirm signals filters false entries. Signal confluence on higher and working timeframes significantly increases trade success probability.
Seasonal analysis identifies periods with historically elevated volatility or unfavorable conditions for specific strategies. Reducing trading during these periods lowers drawdowns.
Automating protective order execution completely eliminates human factor. A system-placed stop-loss triggers regardless of the trader's emotional state.
Balancing Risk and Return
The balance between aggressive and conservative trading defines account risk profile. Aggressive approaches promise high returns but come with deep drawdowns and psychological pressure. Conservative strategies minimize losses but limit capital growth potential.
Determining personal risk tolerance serves as the starting point for style selection. If losing ten percent of capital causes significant stress, aggressive trading is contraindicated. Comfortable drawdown level should be defined in advance and documented in the trading plan.
Position sizing adaptation to market conditions enables flexible balance management. During high uncertainty, shifting to conservative approach protects capital. In favorable conditions, moderate risk increase accelerates account growth.
Regular review of acceptable drawdown levels considering capital changes and life circumstances ensures risk adequacy for current situation.
Conclusion
Drawdowns are inevitable in trading, but their depth and account impact are fully controllable. Competent risk management, psychological preparation, and systematic analysis transform drawdown from threat into a manageable trading system parameter. To consolidate this material, also study: emotions in trading.
Successful traders differ not by absence of drawdowns but by ability to minimize them and recover quickly after losing periods. Accepting drawdowns as an integral part of the process enables maintaining composure and following strategy under any market conditions.
FAQ: Frequently Asked Questions
Drawdown is a temporary decline in trading capital from its peak value to its current or minimum level. This metric is expressed in percentage or absolute terms and serves as a key indicator for assessing trading strategy risk.
For conservative strategies, acceptable drawdown is up to 10-15%, for moderate strategies up to 20-25%, and for aggressive strategies up to 30-35%. Drawdown exceeding 50% is critically dangerous as it requires 100% profit to recover capital.
Key minimization methods include: limiting risk per trade to 1-2% of capital, mandatory use of stop-losses, portfolio diversification, reducing position sizes during losing streaks, and following a trading plan.
Recovery requires reducing risks, analyzing loss causes, focusing on trade quality over quantity, and gradually increasing positions as the account grows. Avoid attempting to recover quickly through aggressive trading.
Maximum drawdown represents the largest capital decline from peak to trough across entire trading history. Current drawdown is the immediate decline from the most recent peak, a dynamic metric that changes with each trade.
About the Author
Author: Igor Arapov — independent researcher in trading psychology and behavioral finance, practising trader since 2013, founder of arapov.trade, author of a trading book series (Open Library ), (ORCID: 0009-0003-0430-778X ).