Price fluctuations represent the heartbeat of financial markets. Every trading session brings movements that create opportunities for profit and exposure to risk. Mastering volatility analysis distinguishes successful traders from those who struggle with unpredictable market behavior. To understand this topic more deeply, I recommend studying news trading.
Volatility quantifies the degree of price variation over a specified time period. High volatility indicates substantial price swings and elevated uncertainty about future values. Low volatility characterizes stable periods with contained price movements. Understanding current volatility levels enables traders to select appropriate strategies and calibrate position parameters effectively.
Fundamental Drivers of Market Volatility
Financial markets continuously respond to information flows. Economic releases, corporate announcements, political developments, and unexpected events shift the balance between buyers and sellers. The intensity of market participant reactions to these catalysts determines volatility levels during any given period.
Macroeconomic factors play a decisive role in volatility formation. Central bank monetary policy decisions, inflation and employment data, gross domestic product figures influence investor expectations significantly. Unexpected deviations between actual results and forecasts trigger sharp price movements and elevated volatility readings.
Geopolitical instability creates periods of extreme uncertainty. Armed conflicts, trade disputes, and sanctions disrupt established economic relationships and force market participants to reassess risk exposures. Such events can multiply volatility several times compared to calm market conditions.
Psychological factors amplify price movements. Fear and greed dominate rational analysis during critical moments. Panic selling during crises and euphoric buying at bull market peaks generate extreme volatility readings. Understanding these behavioral patterns helps traders make measured decisions amid heightened market emotionality.
Seasonal patterns influence volatility cyclically. Summer months typically feature reduced activity due to vacation periods. Year-end positioning and quarterly reporting increase volatility through institutional portfolio rebalancing activities.
Categories of Volatility and Their Characteristics
Historical volatility derives from actual price data over past periods. Calculating return standard deviation over chosen timeframes provides quantitative assessment of past fluctuations. This metric serves as a benchmark for determining typical movement ranges for specific instruments.
Implied volatility reflects options market participant expectations regarding future fluctuations. It extracts from current option contract prices through mathematical pricing models. Rising implied volatility signals expectations of significant upcoming price movements.
Divergence between historical and implied volatility creates trading opportunities. When expected volatility significantly exceeds realized volatility, options may be overpriced. The reverse situation indicates potential undervaluation. Experienced traders utilize this information for constructing options strategies.
Realized volatility measures after period completion and compares against prior expectations. Systematic analysis of volatility forecast accuracy helps identify market inefficiencies and improve future trading decision quality.
The ATR Indicator: Operating Principles and Configuration
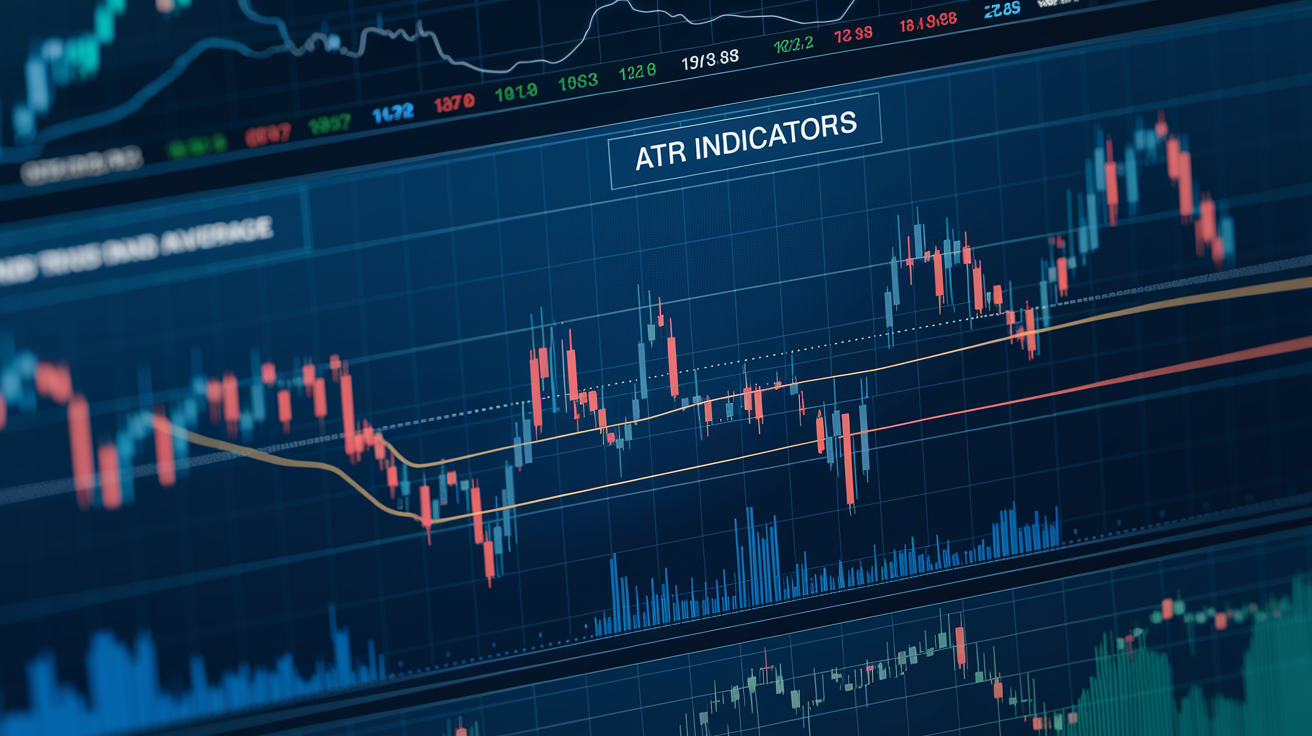
ATR (Average True Range) provides a practical tool for measuring volatility directly on price charts. The indicator calculates mean true range of price fluctuations over selected periods, accounting for gaps between trading sessions.
True range equals the maximum of three values: difference between current period high and low, absolute deviation of high from previous close, absolute deviation of low from previous close. Gap consideration makes ATR more accurate compared to simple candle range measurements.
Default averaging period stands at fourteen bars. Shortening the period increases indicator sensitivity to short-term volatility changes. Lengthening the period smooths readings and reveals longer-term tendencies. Optimal configuration depends on trading style and instrument characteristics.
Interpreting ATR values requires comparison with historical data for specific assets. Absolute numbers provide limited information by themselves. Understanding whether current volatility stands above or below typical values for given instruments matters more than raw readings.
Sharp ATR increases indicate active market phase beginnings. Gradual declines signal transitions toward consolidation. Extended periods of minimum ATR levels often precede powerful impulsive movements.
Practical ATR Applications in Trading
Determining protective order levels based on ATR ensures adaptive risk management. Fixed stops in points ignore current market conditions. On volatile markets they trigger too frequently from random fluctuations. On calm markets they leave excessive risk exposure.
Standard approach involves setting stop losses at one and a half to three ATR values from entry points. Aggressive strategies employ smaller multipliers for more frequent entries. Conservative systems apply larger multipliers for filtering market noise and reducing false triggers.
Calculating position size through ATR normalizes risk across different instruments. High volatility assets receive smaller position sizes. Low volatility instruments permit larger volumes. Resulting monetary risk remains constant regardless of specific asset characteristics.
Determining profit targets also relies on ATR. Price movement potential correlates with current volatility. Setting take profit as ATR multiples creates realistic trade return expectations and helps avoid premature exits from profitable positions.
Dynamic stop loss based on ATR automatically adapts to changing market conditions. Volatility increases push protective levels further away. Volatility decreases pull stops closer to current prices for protecting accumulated profits.
Filtering Trade Signals by Volatility
Technical pattern effectiveness depends on market context. Resistance level breakouts against rising volatility backgrounds have better success chances. Similar signals during volatility compression periods often prove false.
Comparing current ATR against historical averages reveals anomalous market states. Extremely low volatility frequently precedes strong directional movements. Markets accumulate energy before impulses. Extremely high volatility may signal movement climax and approaching reversal.
Adapting trading activity to volatility regimes improves overall results. Some strategies perform better under high volatility conditions. Others require calm markets for optimal execution. Understanding these dependencies enables selecting correct approaches.
Comparing Volatility Measurement Tools
Bollinger Bands visualize volatility through channel expansion and contraction around moving averages . Unlike ATR which provides absolute values, bands show relative price position within volatile ranges. Combining both indicators enriches analytical perspective.
VIX reflects options market expectations regarding equity index volatility. Sharp VIX increases associate with panic sentiment. This measure serves as contrary indicator for identifying market extremes. However VIX applies only to specific market segments.
Return standard deviation underlies academic risk models. This measure proves useful for comparative investment strategy analysis. For operative trading decisions ATR demonstrates greater practicality and convenience.
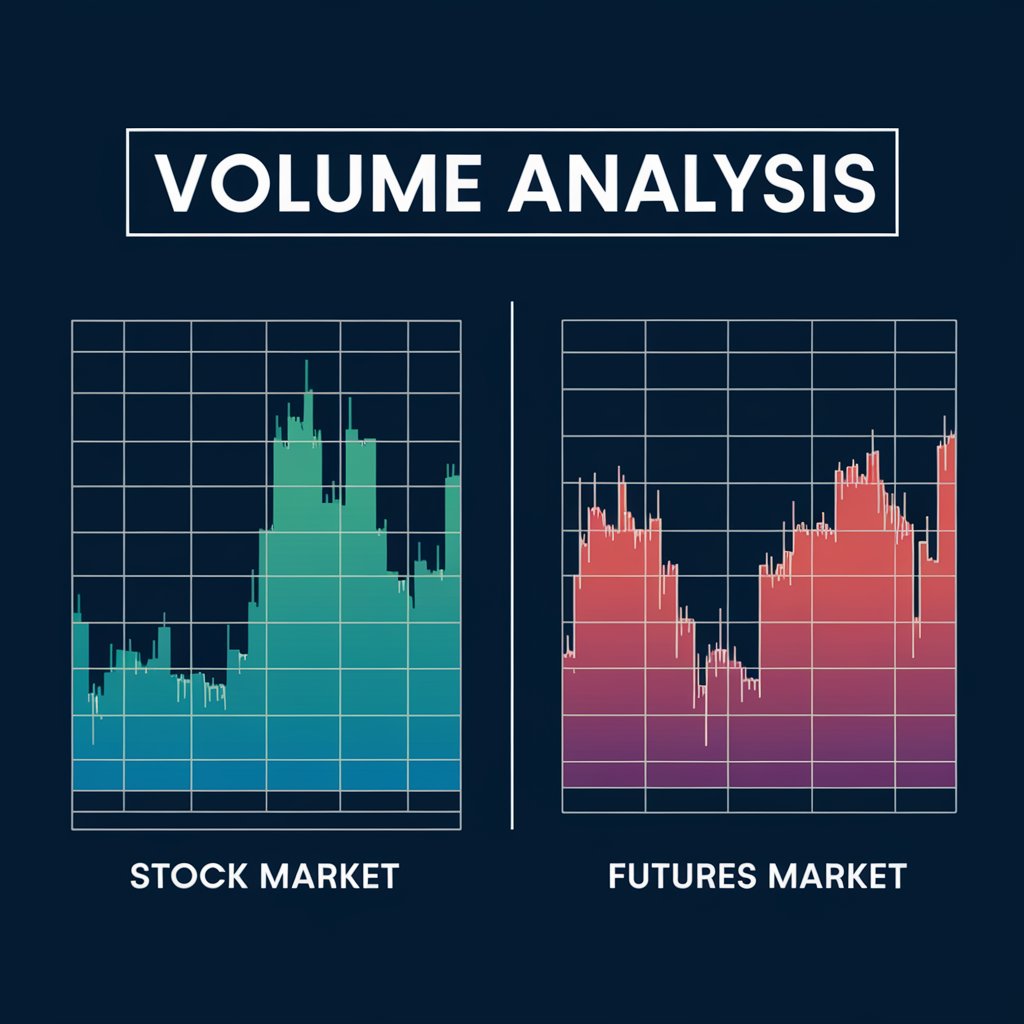
Volatility Specifics Across Different Markets
Currency markets feature relatively stable major pair volatility. Periodic spikes occur during macroeconomic data releases. Cross rates demonstrate elevated volatility due to lower liquidity compared to major pairs.
Stock markets show pronounced sectoral volatility differentiation. Technology companies traditionally exhibit higher volatility than utilities. Individual stocks can demonstrate extreme volatility during corporate events and earnings periods. This regime requires a special approach to risk management and a significant increase in ATR multipliers for stop-losses.
Cryptocurrency markets distinguish themselves through unprecedented volatility levels. Daily fluctuations of ten to twenty percent are not uncommon for major cryptocurrencies. Such regimes require special risk management approaches and significant ATR multiplier increases.
Commodity markets follow seasonal volatility cycles. Agricultural futures demonstrate elevated volatility during planting and harvest periods. Energy commodities react to geopolitical events and producer cartel decisions.
Volatility-Based Risk Management
Dynamic positioning adjusts position size proportionally to volatility changes. ATR increases automatically reduce exposure. Volatility decreases permit larger position volumes. This mechanism maintains constant risk levels regardless of market conditions.
Volatility influences trading timeframe selection. High volatility periods favor short-term strategies with quick profit taking. Low volatility requires extended time horizons for capturing sufficient price movement.
Volatility diversification complements traditional asset diversification. Including instruments with different volatility profiles in portfolios smooths return curves and reduces maximum drawdown.
Common Volatility Analysis Mistakes
Ignoring volatility regimes leads to applying inappropriate strategies. Breakout trading during volatility compression generates false signals. Counter-trend approaches on extremely volatile markets cause significant losses.
Static trading system parameters create inefficiency periods. Stop losses and take profits require regular calibration according to current ATR for maintaining optimal system performance.
Excessive dependence on single indicators limits analytical capabilities. ATR effectively measures volatility but does not show trend direction. Comprehensive approaches using multiple analytical tools provide fuller pictures.
Integrating Volatility Analysis Into Trading Practice
Daily ATR monitoring develops understanding of current market regimes. Maintaining statistics helps identify typical volatility values and recognize deviations from norms for each traded instrument.
Strategy testing across different volatility regimes reveals strengths and weaknesses. Documenting observations accumulates valuable experience for trading system improvement and result stability enhancement. To consolidate the material, study also scalping.
Automating volatility-based calculations frees time for analytical work. Modern trading platforms allow configuring automatic stop loss and position size calculations based on ATR values.
Frequently Asked Questions About Volatility
Volatility is a statistical measure of price variation over a specific period. High volatility means significant price swings, low volatility indicates stable price behavior.
ATR (Average True Range) measures the average true range of price fluctuations, accounting for gaps. True range is the maximum of high-low difference and deviations from previous close.
Typical approach is setting stop loss at 1.5-3 ATR values from entry point. This accounts for current volatility and prevents premature stop triggers.
Historical volatility is calculated from past prices, implied volatility is extracted from option prices and reflects market expectations about future fluctuations.
Cryptocurrency market has the highest volatility - daily swings of 10-20% are common. Forex is relatively stable, stock market shows sectoral differentiation.
About the Author
Author: Igor Arapov — independent researcher in trading psychology and behavioral finance, practising trader since 2013, founder of arapov.trade, author of a trading book series (Open Library ), (ORCID: 0009-0003-0430-778X ).