Imbalance and FVG: Liquidity Zones in Trading
Understanding Imbalance and Fair Value Gap Concepts
Imbalance and Fair Value Gap represent fundamental elements of modern technical analysis that reveal the inner mechanics of price movements in financial markets. These tools enable identification of areas where market equilibrium between supply and demand becomes disrupted. To understand this topic more deeply, I recommend studying imbalance in trading.
Imbalance occurs when one side of the market significantly overpowers the other. Buyers or sellers gain temporary dominance, causing rapid price movement with virtually no resistance. Such areas often mark entry points for large institutional capital seeking to establish substantial positions.
Fair Value Gap manifests as a visual representation of imbalance on price charts. A space forms between consecutive candles — an area where price moved too rapidly for balanced trading activity to develop. Markets naturally seek equilibrium, so price frequently returns to fill these gaps.
Mastering these concepts provides traders with tools for identifying potential entry and exit points. Imbalance zones serve as guideposts for forecasting future price dynamics regardless of chosen assets — currency pairs, cryptocurrencies, or equities.
How Market Imbalances Form
Supply and demand imbalance forms during sharp shifts in the balance of power between buyers and sellers. When large participants place significant orders block while opposing liquidity remains insufficient, price instantly shifts in one direction without resistance.
Institutional operations represent the primary cause of Imbalance formation. Banks, hedge funds, and market makers operate with volumes capable of moving markets. Their orders absorb available liquidity, leaving characteristic traces on charts.
News releases create conditions for sharp price jumps. Publication of macroeconomic data, central bank interest rate decisions, or unexpected geopolitical events trigger mass position reassessment among market participants.
Algorithmic trading amplifies imbalance effects. High-frequency trading systems react instantaneously to market conditions, liquidating available orders at specific levels within fractions of a second.
Fair Value Gap Structure on Charts
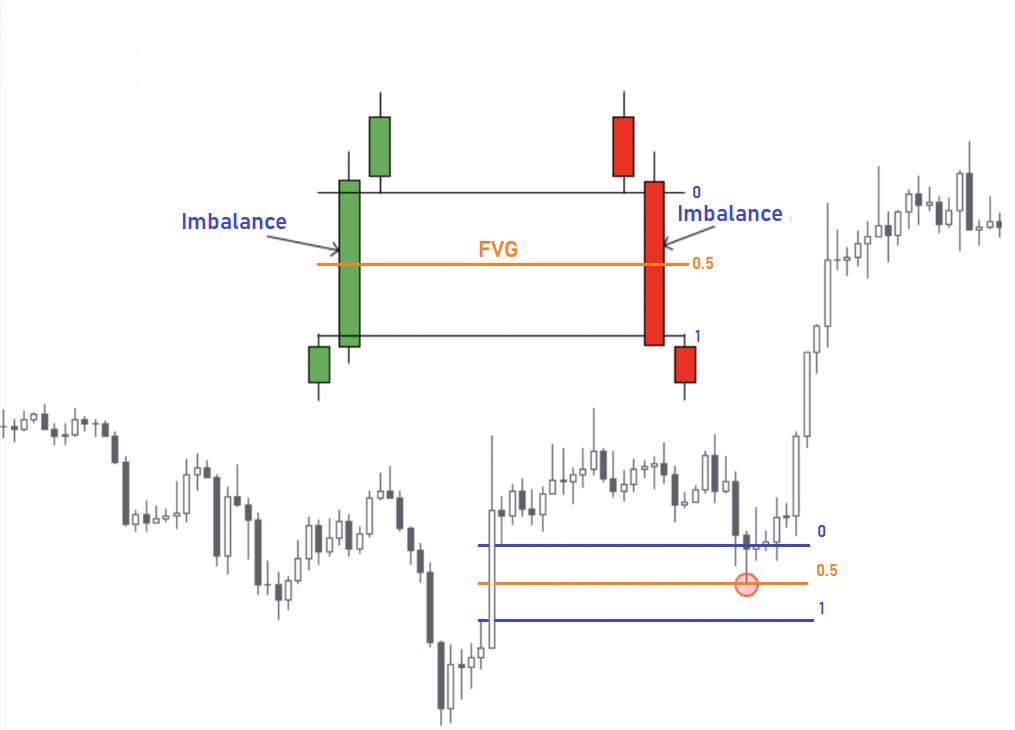
Fair Value Gap visually appears as space between three consecutive candles where the middle candle creates an impulse while first and third candles do not overlap with bodies or wicks. This gap indicates a zone of absent trading activity.
Bullish FVG forms during upward impulses. The gap develops between the high of the first candle and the low of the third candle. Price moves sharply upward, leaving an unfilled area below current quotations.
Bearish FVG appears during downward movement. The gap emerges between the low of the first candle and the high of the third. Aggressive selling creates a zone where price may potentially return to restore balance.
Partial FVG filling occurs when price returns to the gap zone but does not completely close it. Such areas retain significance as potential levels for repeat testing and position entry.
Why Price Returns to Imbalance Zones
Markets function as systems seeking equilibrium. Unfilled liquidity zones represent areas with unbalanced trading activity that attract price to complete unfinished transactions.
Smart Money uses FVG zones to place their orders. Large participants understand that price will likely return to these levels and prepare positions for market entry or exit in advance.
Algorithmic systems are programmed to track price gaps. Numerous trading bots automatically place orders in FVG zones, creating additional demand or supply as price approaches.
Market participant psychology amplifies the attraction effect. Traders who missed initial movements wait for price returns to enter at better prices, forming clusters of pending orders in imbalance zones.
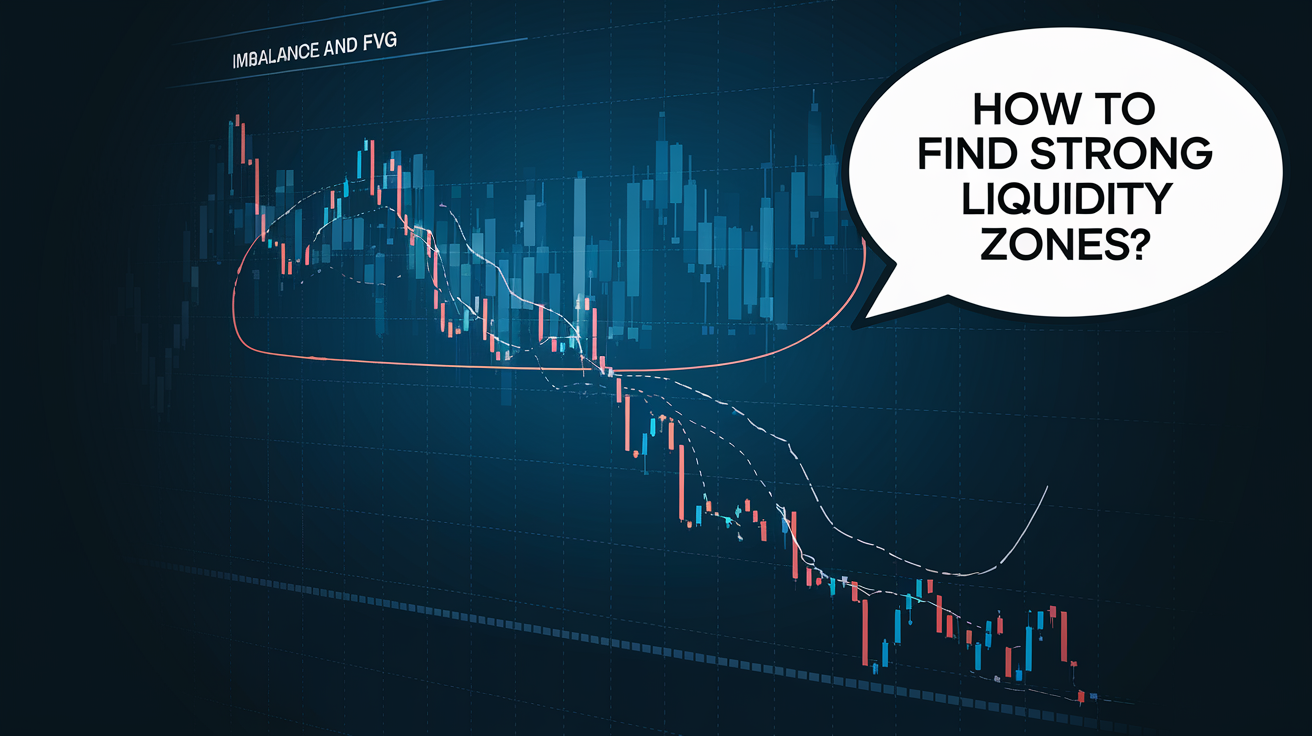
Methods for Identifying Significant Liquidity Zones
FVG analysis on higher timeframes reveals the most significant zones. Daily and weekly fair value gaps carry more weight than similar patterns on minute charts. Institutional players orient primarily toward larger time intervals.
Combining Imbalance with Volume Profile increases analysis accuracy. Zones with high trading volume indicate areas of genuine interest from large participants. When FVG coincides with elevated volume activity areas, such zone significance increases.
Cluster analysis through Footprint Charts demonstrates detailed order flow pictures. The tool reveals where markets become overloaded with aggressive buying or selling, confirming or refuting identified imbalance significance.
Matching FVG with historical levels strengthens trading signals. When fair value gaps form near key support or resistance, probability of zone completion increases substantially.
FVG Retest Trading Strategy
Trading FVG retests represents a reliable approach based on natural market equilibrium seeking. The strategy involves position entry when price returns to imbalance zones with confirming signals.
FVG zone identification executes on working timeframes. Traders mark gap boundaries between first and third candles of impulse movements. Upper and lower boundaries form potential entry areas.
Waiting for price returns requires patience. Not every FVG gets tested, but gaps that price revisits often provide quality trading opportunities with favorable risk-reward ratios.
Confirmation signals include reversal candlestick patterns, volume increase, or price reaction at FVG boundaries. Pin bars, hammers, or bullish engulfing at bullish FVG lower boundaries indicate market readiness to continue upward movement.
Stop-loss placement beyond FVG boundaries limits risk. If price breaks through imbalance zones without reaction, initial hypotheses prove incorrect and positions close with controlled losses.
Integrating Imbalance with Volume Analysis
Combining volume analysis with Imbalance concepts filters false signals and improves trading decision quality. Volume confirms or refutes identified imbalance zone significance.
Volume Profile displays trading activity distribution across price levels. When Imbalance zones coincide with low-volume areas on profiles, this strengthens probability of rapid price passage through such levels.
Footprint Charts reveal details within each candle. Predominance of aggressive buying or selling in imbalance zones indicates likely continuation direction after price returns.
Volume delta shows difference between buying and selling. Positive delta in bullish Imbalance zones confirms buyer strength and increases probability of level completion upon retest.
Advantages of Imbalance Concept Application
Level identification precision distinguishes FVG and Imbalance among other analysis tools. Imbalance zones form clear boundaries for entry and protective order placement, simplifying risk management.
Application universality spans all financial markets and timeframes. Concepts work on currency pairs, cryptocurrencies, stocks, and commodities, adapting to any trading style.
Visual recognition simplicity makes methodology accessible to traders of varying preparation levels. Gaps between candles appear obvious on charts and require no complex calculations or additional indicators.
Logical foundation increases confidence in trading decisions. Understanding price return mechanisms to imbalance zones provides fundamental basis for building trading systems.
Methodology Limitations and Risks
Not all FVG zones complete successfully. During strong trends or after significant news, price may ignore previously formed gaps, continuing movement without retests.
Additional confirmation necessity excludes Imbalance use as sole entry criteria. Combining with volume analysis, candlestick patterns, and support and resistance levels improves signal reliability.
Subjectivity in FVG boundary determination creates interpretation differences. Traders may differently interpret identical zones, affecting entry precision and stop-loss placement.
Beginner risks relate to incorrect context interpretation. Without understanding overall market structure, trading from imbalance zones may lead to losses when attempting to catch pullbacks in strong trends.
Conclusion
Imbalance and Fair Value Gap concepts reveal price movement mechanics through supply and demand balance perspectives. Understanding imbalance zone formation and completion provides traders with tools for identifying quality entry points.
Effective application requires comprehensive approaches. Combining FVG analysis with volume tools, key levels, and market context forms reliable foundations for trading decisions. Demo account practice enables methodology mastery without capital risk.
Frequently Asked Questions About Imbalance and FVG
Imbalance is a market condition where supply and demand diverge sharply, causing rapid price movement in one direction without significant resistance. These zones indicate activity from large institutional players.
Fair Value Gap is a price gap between candles on a chart that occurs during rapid price movement. FVG represents a zone where the market failed to form balanced liquidity, and price often returns to fill this gap.
Bullish FVG forms between the low of the first candle and the high of the third candle during an upward impulse. Bearish FVG forms between the high of the first candle and the low of the third during downward movement.
Markets seek equilibrium. Unfilled liquidity zones act as magnets for price. Smart Money uses these gaps to place orders, so price often tests FVG before continuing its movement.
The most significant FVGs form on higher timeframes: H4, D1, W1. Daily chart gaps carry more weight than those on minute intervals and are more likely to be filled.
About the Author
Author: Igor Arapov — independent researcher in trading psychology and behavioral finance, practising trader since 2013, founder of arapov.trade, author of a trading book series (Open Library ), (ORCID: 0009-0003-0430-778X ).