What separates systematic trading from a game of chance is a clear strategy: a fixed set of rules that tells you when to enter, where to take profit and where to cut a loss. On this page I cover what a working trading strategy contains, walk through five real chart examples drawn straight from the free course, and share a student's demo statement so you can see how win rate, profit factor and drawdown actually look over a series of trades.
What Is a Trading Strategy?
A trading strategy is a pre-built set of clear rules that govern a trader's actions at every stage, from entering a trade to exiting it. It removes improvisation, emotional swings and subjectivity, replacing them with logic and statistics.
The main advantage of our free course is a structured trading system you can put into practice straight away. The goal of a trading strategy is to protect the trader from spontaneous and irrational decisions.
What a Trading Strategy Includes
- Entry conditions. A step-by-step algorithm, from market analysis to opening a position. Every signal is broken down with examples, and you learn to pinpoint entry points.
- Exit conditions. Concrete rules for locking in profit (take-profit) and limiting losses (stop-loss). You learn to place protective orders properly and manage risk.
- Capital management (money management). What percentage of the account to use in a single trade, how to scale positions and control drawdowns. The base principles are presented in an accessible form.
- Psychology and discipline. How to keep a cool head in unstable market conditions, and how discipline helps you avoid mistakes and follow the system.
Why a Trading Strategy Matters for Beginners
Many beginners come to the market hoping for easy money, but with no working strategy and no understanding of risk. The result? Chaotic trading, a lost account and disappointment.
A trading system is the foundation. Without it, trading turns into a game of chance where the odds are sharply against you. Commissions, the spread and emotional decisions work against you constantly, and unchecked risk eats the account sooner or later. The statistics here are merciless: the overwhelming majority of traders without a system and risk control lose their account. Yes, a beginner often gets lucky at first, sometimes very lucky, but without rules both the earnings and the starting capital go over time.
You can avoid the bitterness of those losses if you start approaching trading rationally. A system helps you learn faster, build professional skills and avoid the typical mistakes. And most importantly, it shifts the mathematical expectation in your favour: you stop bleeding out chaotically and come out ahead over the long run, rather than on a single trade.
Trading with no trader's plan almost always ends in a lost account. This is not a scare story, it is what I have watched on the market since 2013.
Advantages of a Trading Strategy
A trading strategy is not just a tool. It is the foundation of professional trading. It lets you trade calmly and systematically, get rid of emotional decisions and chaos, act on the basis of logic and statistics, and turn random successes into a meaningful result over the long run.
On the free course you master the fundamental theory of trading and can start practising on a demo account straight away, applying what you have learned.
An Example of a Trading System
Below are charts with example entry points. What you see here is nothing unique; it is a simple consequence of the trading theory laid out on the site and grouped by key topics. The purpose of these charts is to show the theory applied in practice and to give beginner traders a direction to develop in.
To close the examples, I have attached the statement of one of my students, who passed the practical exam after training with me and no longer trades on a demo account but has moved to a real trading account. This statistic will help beginners get to grips with concepts such as the WinRate of a trading system and see the probability distribution across trades. The statement also shows clearly why money management and risk control matter so much. In addition, it helps to understand volume analysis of the market and the Smart Money strategies.
Example 1
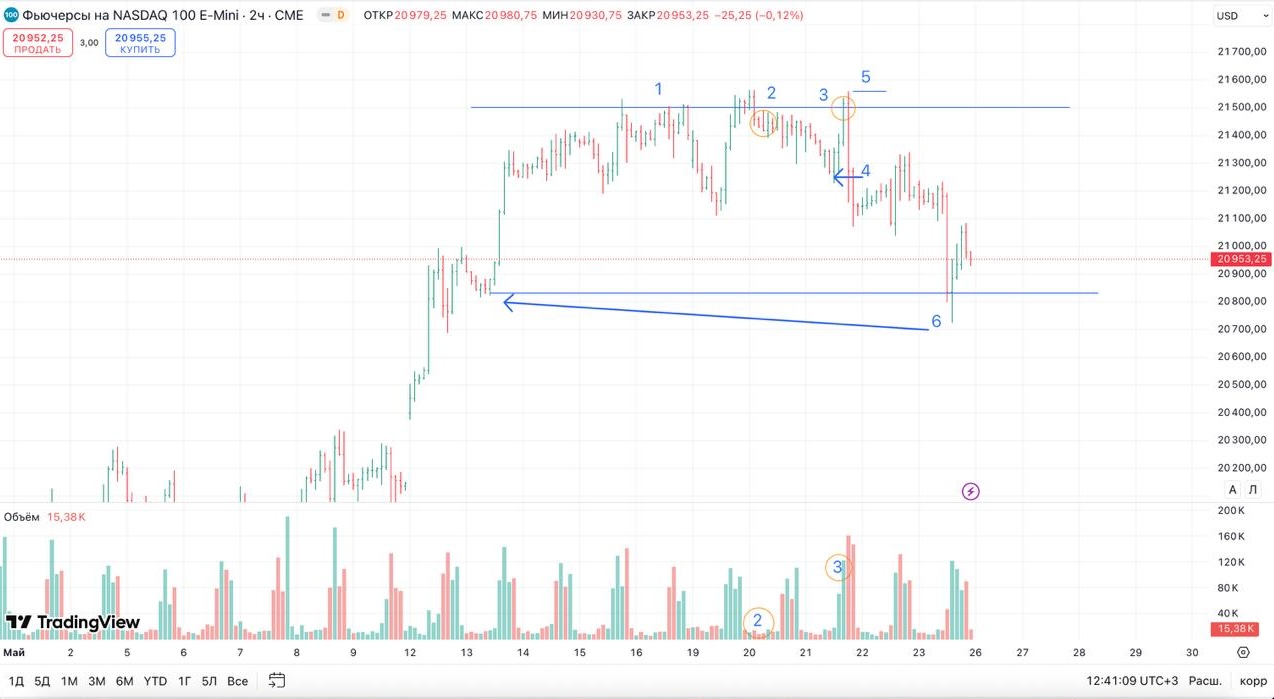
Nasdaq index, 4-hour timeframe, resistance levels. TradingView, Nasdaq index (NQ), 4-hour timeframe.
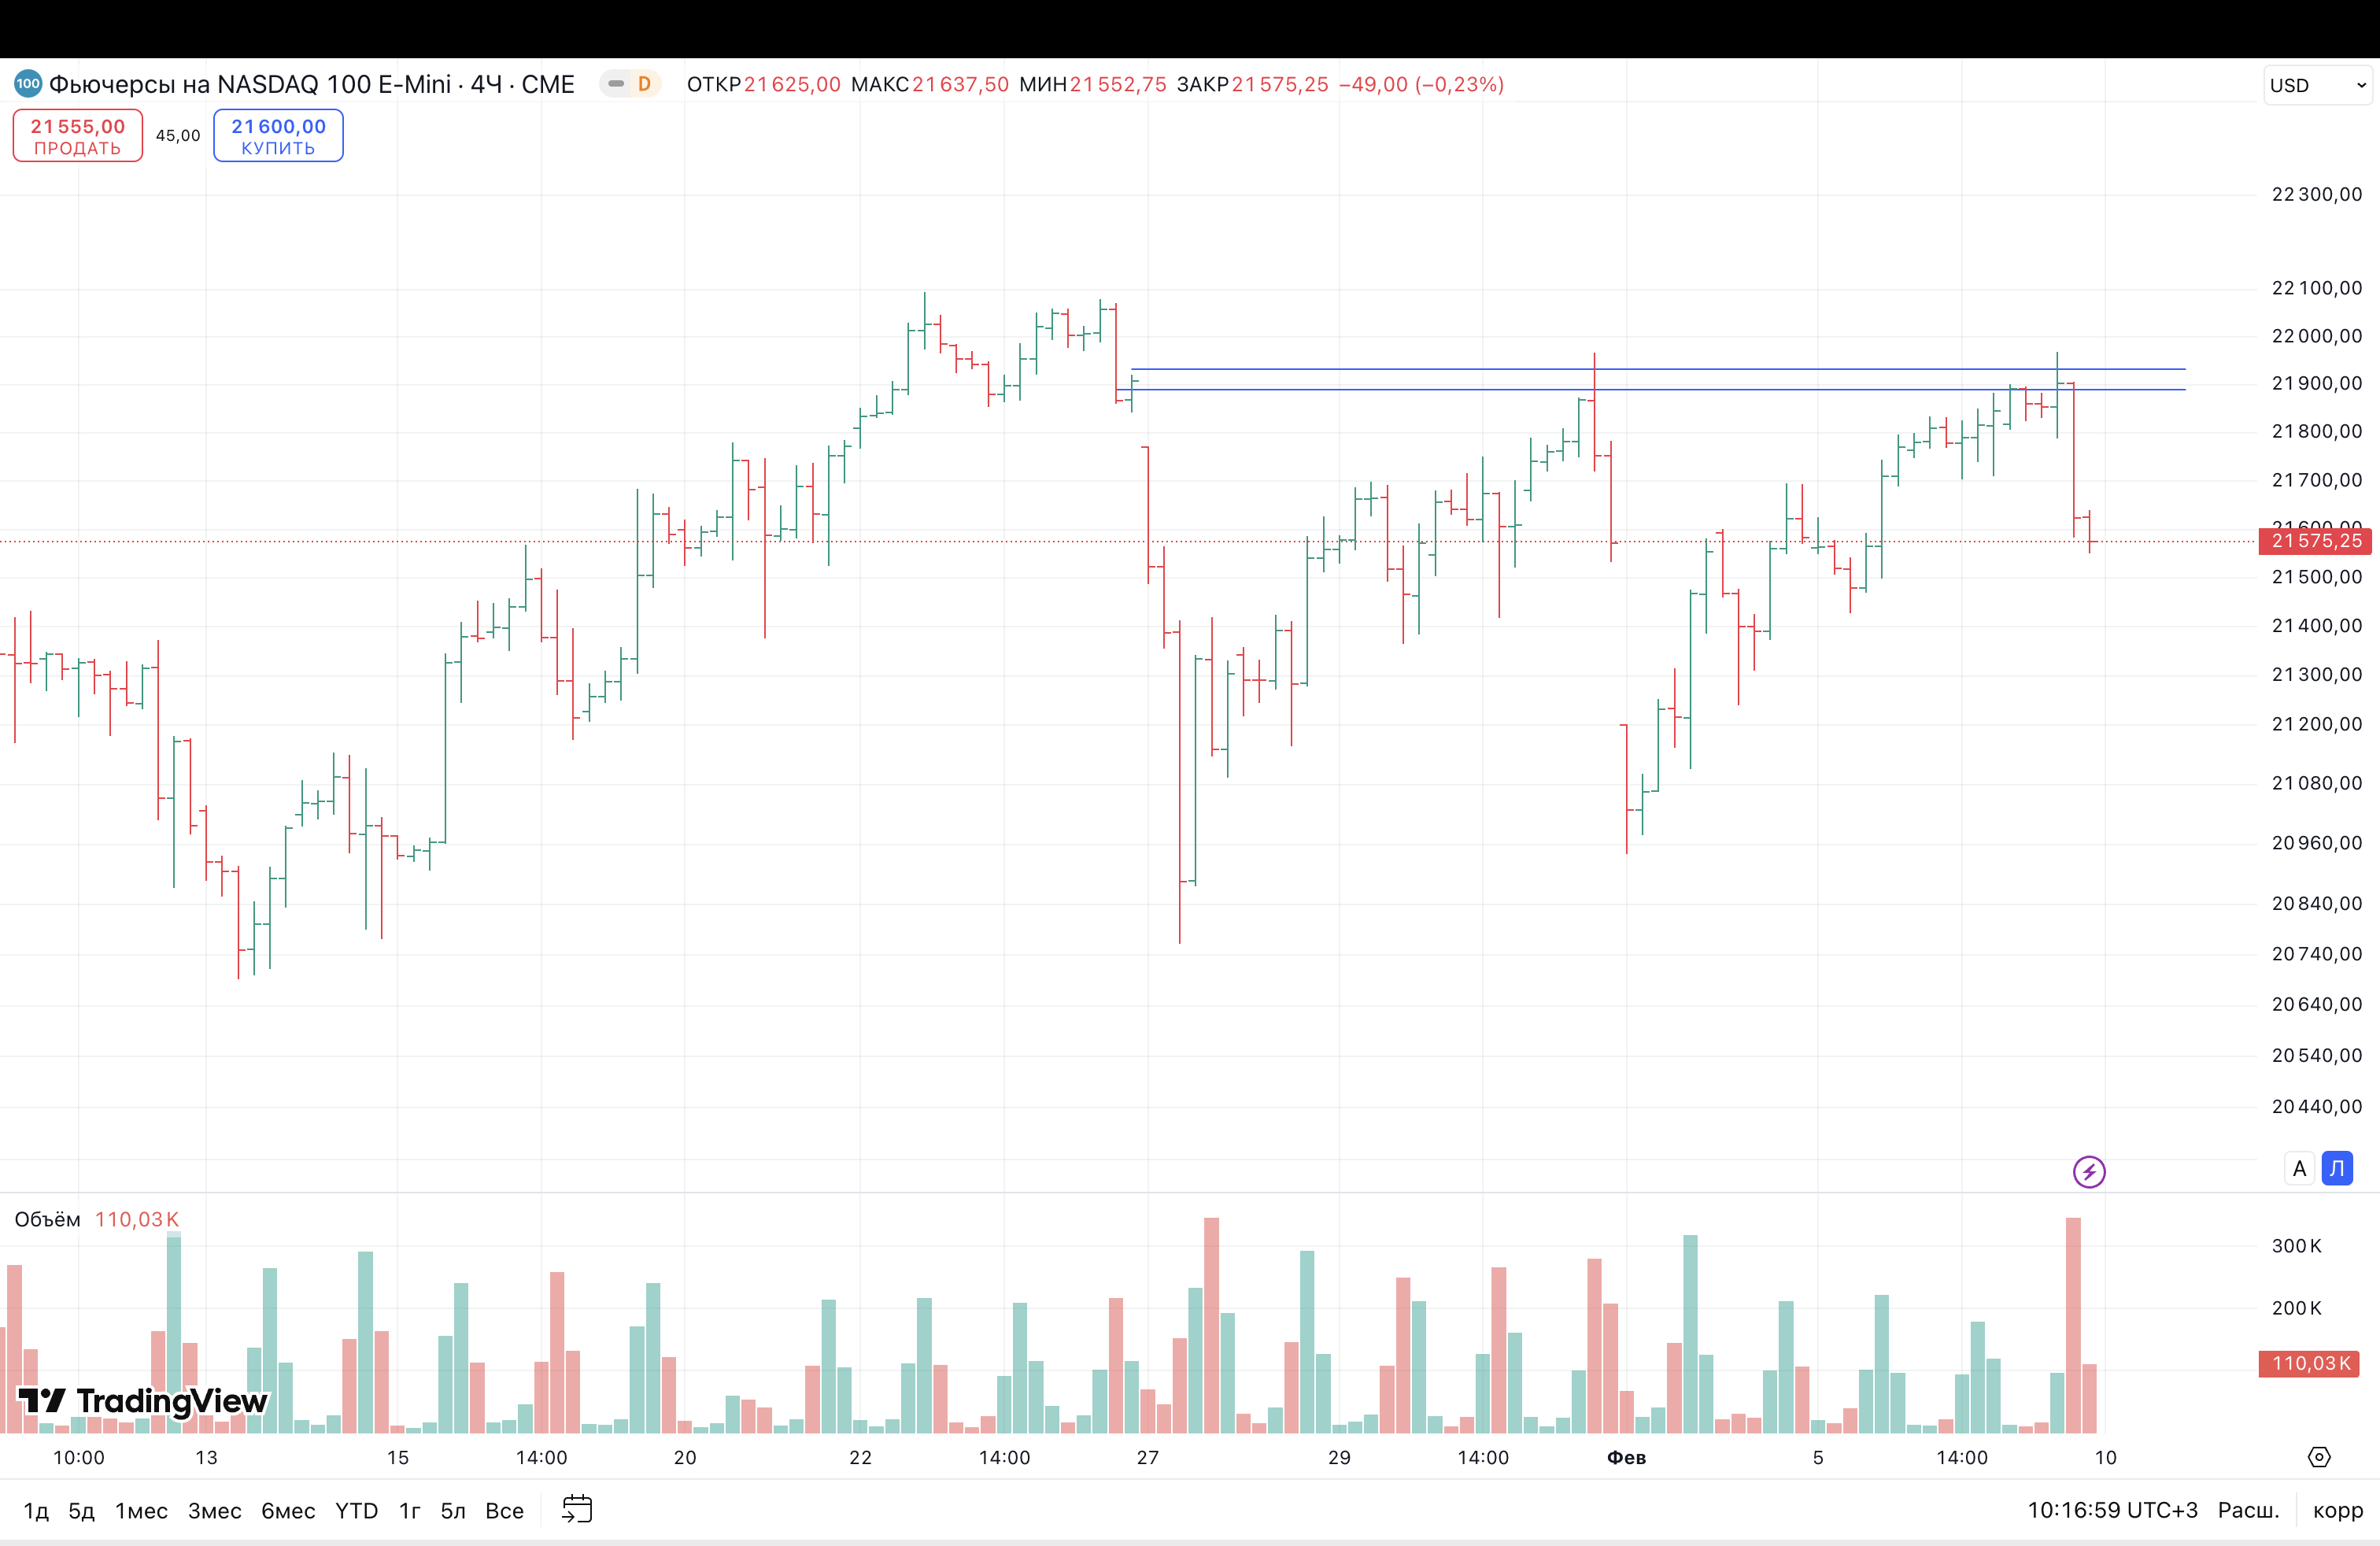
On the 4-hour chart we look at a classic example of working with levels. I chose the Nasdaq specifically because, at the start of the American trading session, it often produces false breakouts followed by a trending move in the opposite direction.
This example covers all the key factors taken into account when defining a trade entry and a target, as well as how to control risk (the stop-loss) properly in a trade.
Below is the same Nasdaq (NQ) chart, only on the 15-minute timeframe. As a rule, that timeframe is used for day trading, whose targets and trades stay within the trading session.
Nasdaq index, 15-minute timeframe, entry point.
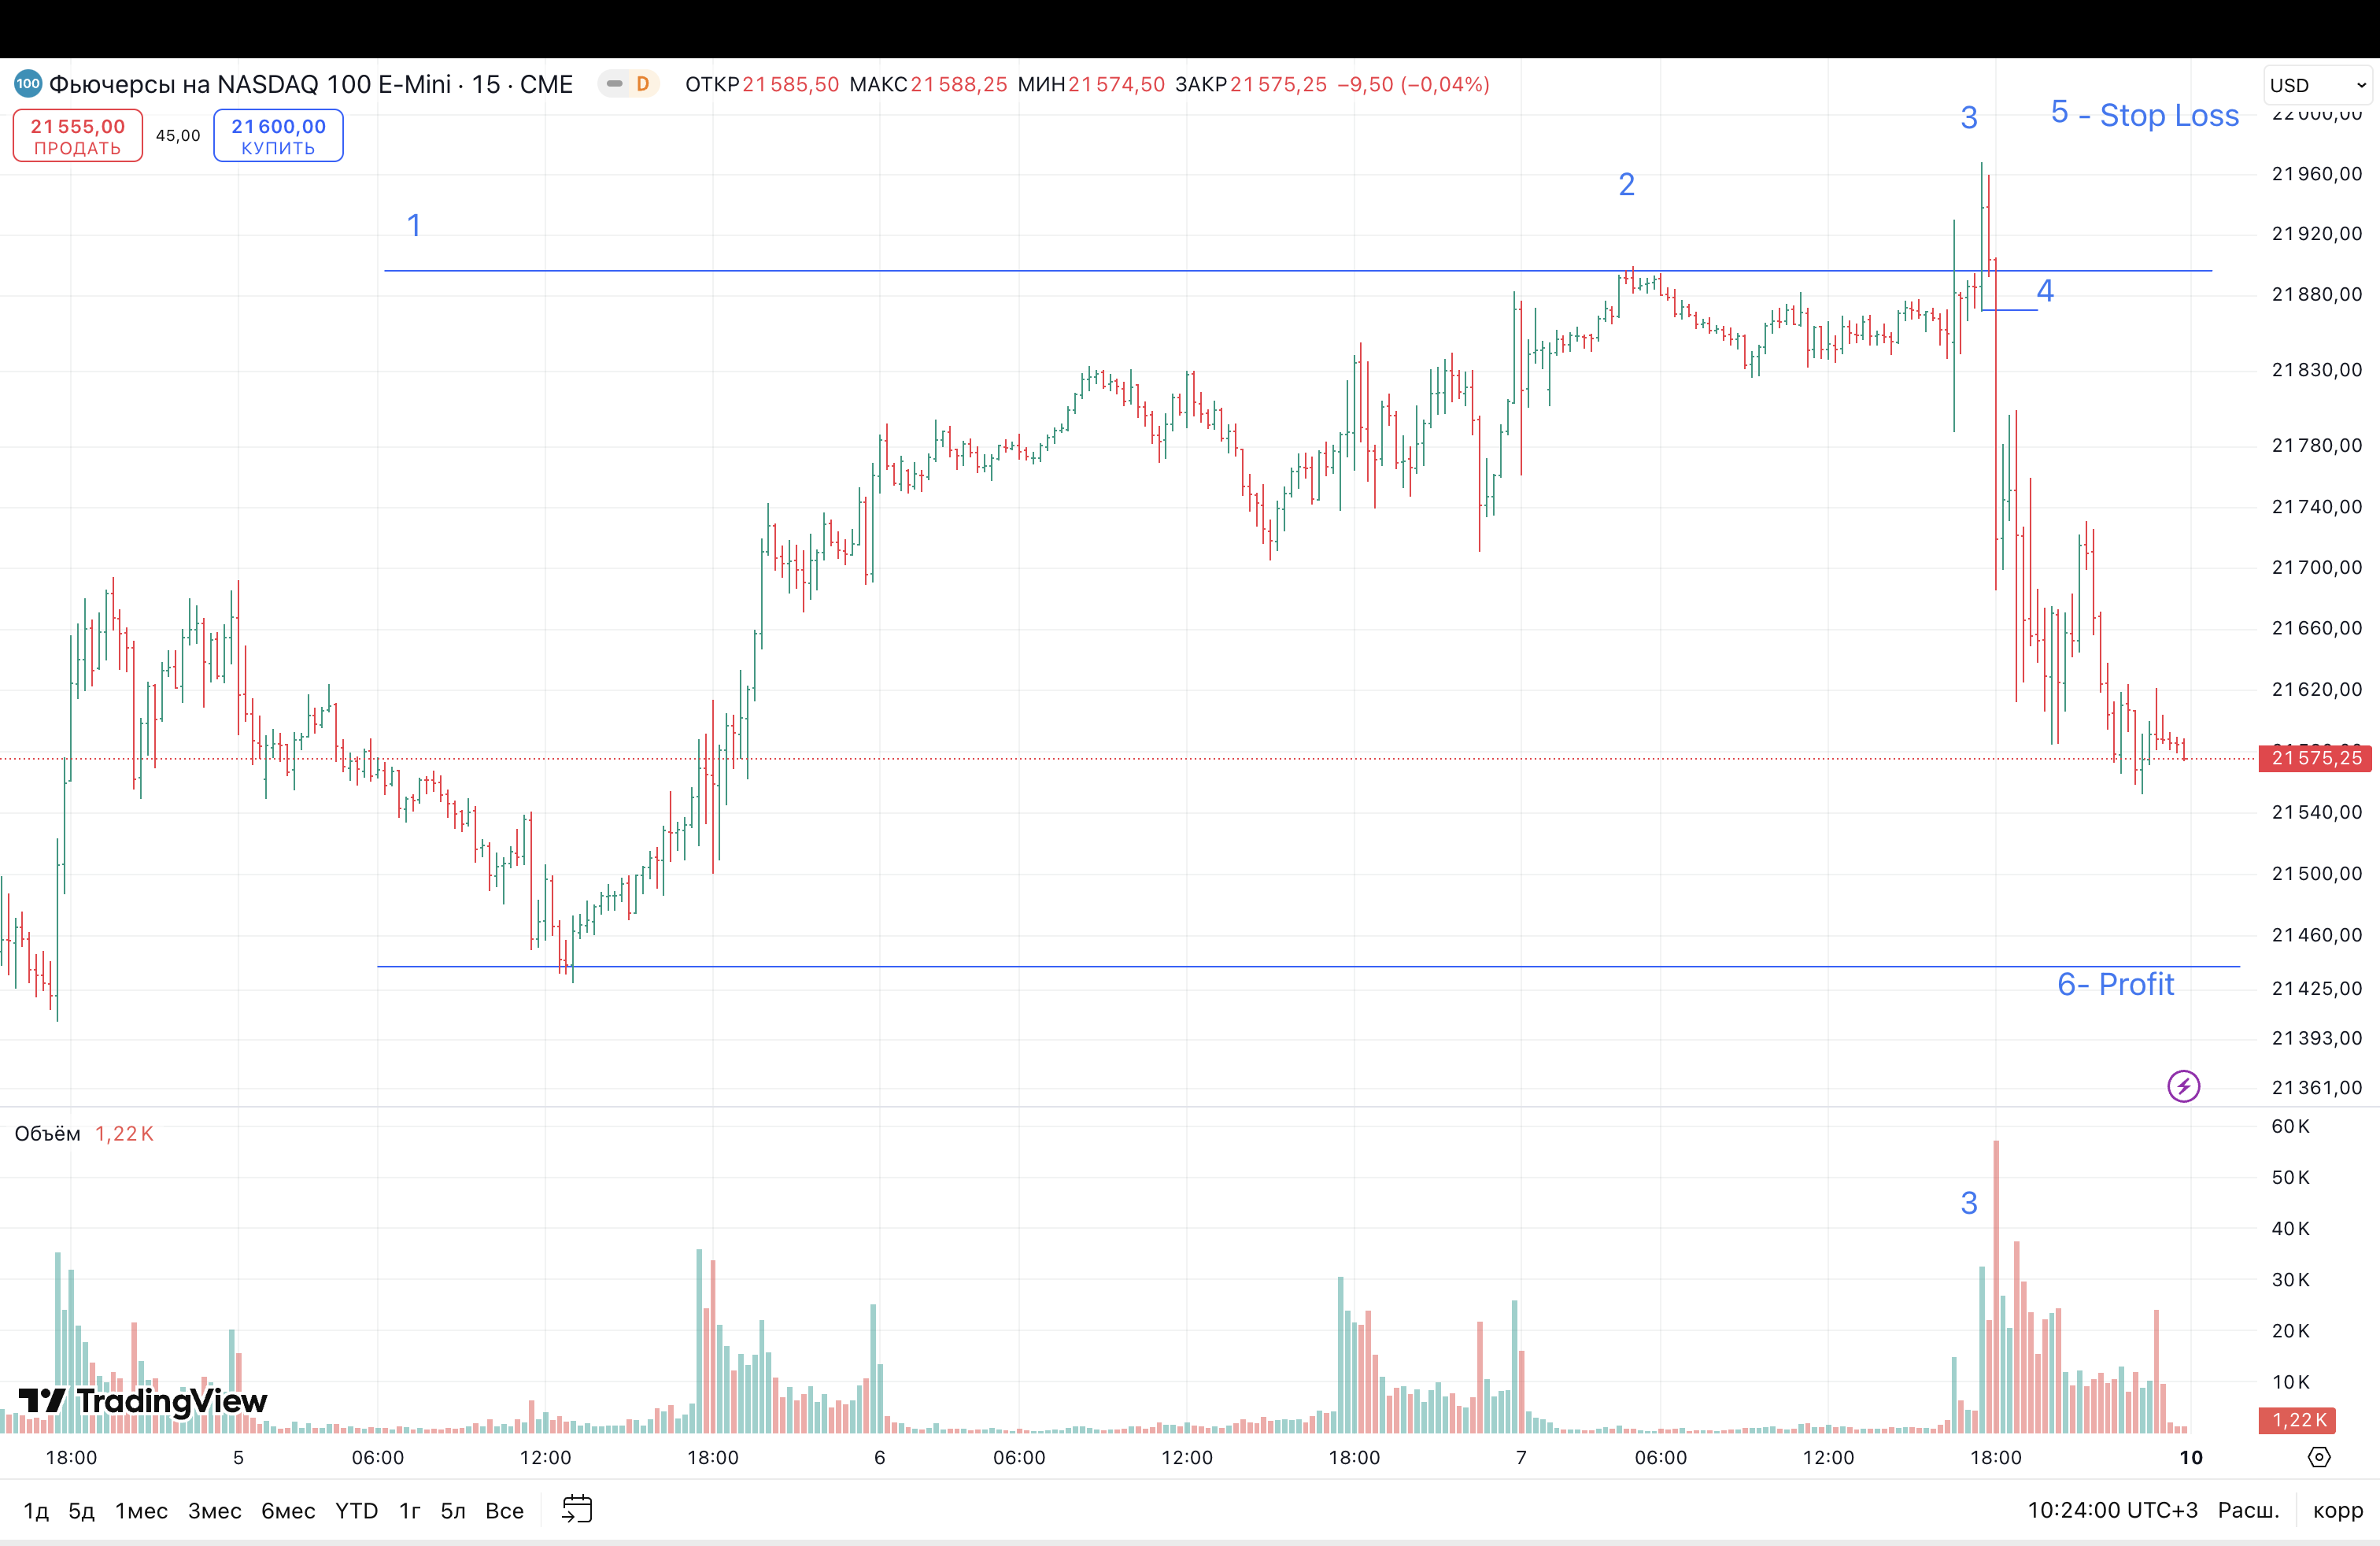
The resistance range on the Nasdaq (21900-22000), taken from the higher x4 timeframe shown above. A pin bar, which is the first sign of trouble for buyers (an inability to give higher prices, a shortage of demand). A false breakout of the level is an attempt to lift the market with a sharp change in price (as I wrote, usually at the start of the US session). It also knocks out the stop orders of short sellers and triggers breakout orders from participants who were waiting for the level to break. Together these orders give significant demand (liquidity), which Smart Money uses to open its speculative short positions or to take profit on existing longs.
Since demand is in short supply at resistance levels, by the rules of Price Action we need to wait for a Bearish Engulfing pattern, which points to the dominance of bears ready to sell aggressively at market. A break of the low of the false-breakout bar signals the start of a trend in the opposite direction. Then a protective order is placed as the sell trade is opened. The target is the opposite impulse level, where buyers took control of price.
Note: it is important to understand that the trade itself, and the reasons we enter, are a set of technical-analysis factors we weigh before opening a position. Key factors such as support and resistance levels, pin bars, false breakouts and Price Action patterns make sense when used together, not in isolation.
It is also important to account for one more condition, without which a trade is out of the question: money management. A trader has no guarantee, even when a number of conditions are met, that the market will go their way and they will earn. So you need not only to control risk in a single position, but to carry it from trade to trade in such a way that, over the long run, the trader has an average plus.
An important condition for profit across the sum of trades: for every 1 dollar of risk you build in a potential of at least 3 dollars of profit. That means the distance to the target in points should be three times greater than the distance to the stop order that limits the risk in the trade.
Example 2
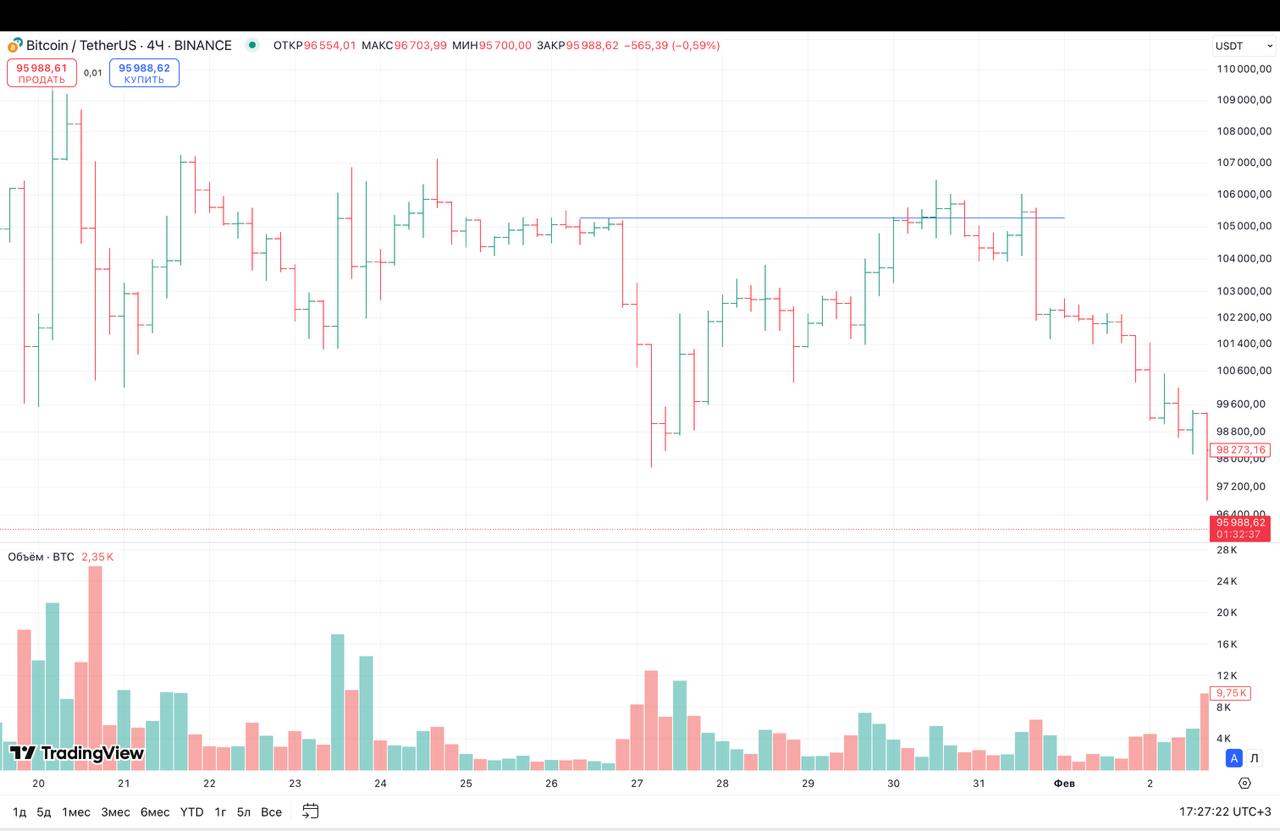
Bitcoin, 4-hour timeframe, resistance level. On the Bitcoin 4-hour chart, an impulsive bearish wave is marked as a resistance level and our zone of interest.
Bitcoin, entry point with a false breakout.
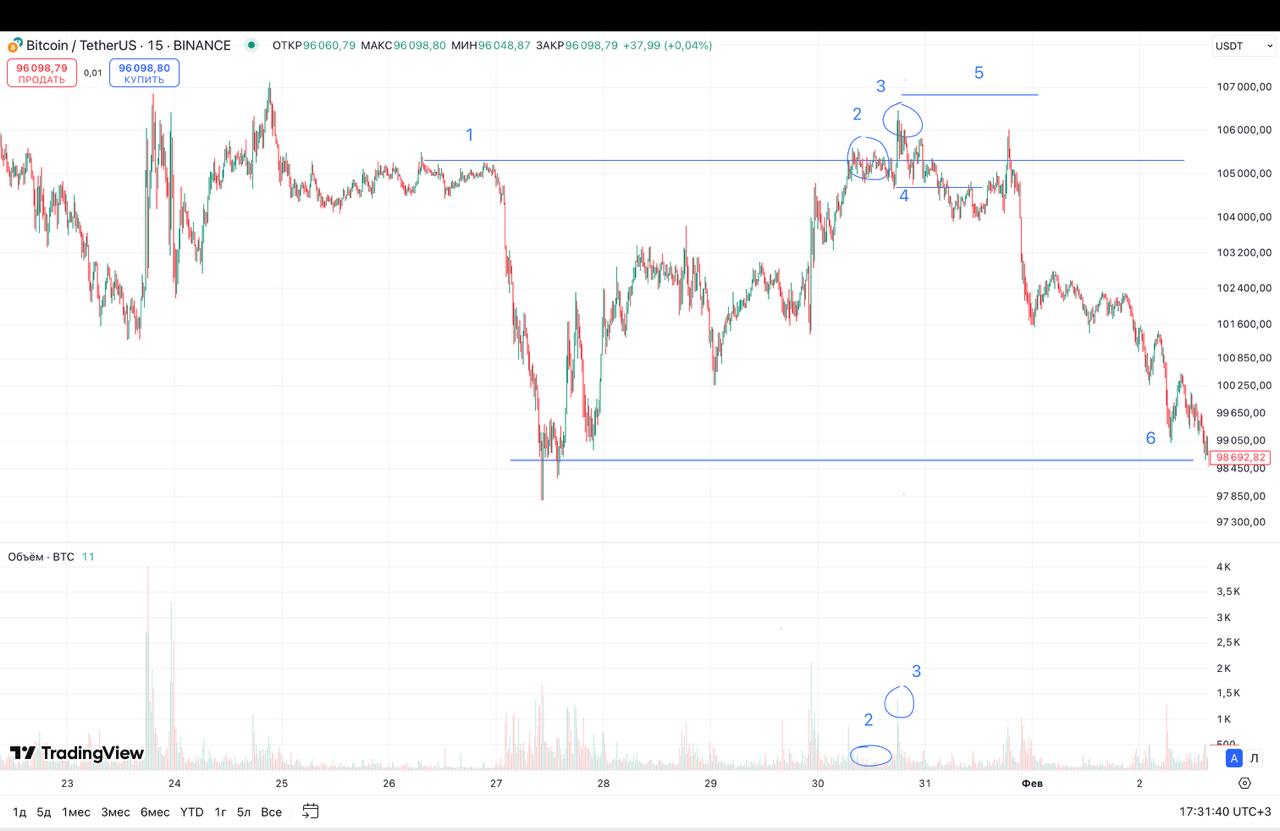
The resistance level we marked as the start of the impulsive bearish wave. We wait at the level (more precisely, in the range) for our pin bars, which show buyers' trouble and their inability to break resistance for higher Bitcoin prices.
The key moment of the level is the false breakout. As in the previous example, we want to see an attempt to lift prices with no result. Below, on the volume, you can see a spike of trading activity that shows how active buyers are in trying to push prices up. By the Smart Money concept (the liquidity-grab section) we have already discussed that, locally at levels, large capital is able to move prices (if the market allows) to draw participants in. Stop-losses are also knocked out and breakout orders beyond the resistance level are filled. All of this helps existing long positions get closed out without a meaningful change in price.
We mark the low of the potential false-breakout bar and, the moment price goes below that low, we open a sell trade. By classic Price Action this is a bearish engulfing. A protective stop-loss order is mandatory, because there is a chance the breakout will not turn out to be false, which means the account must be protected. By the classic rule there should be no prices above the bar we treat as false, so the stop-loss is placed beyond the top of that bar, plus a couple of points for the exchange or broker commission. The target is the opposite level where buyers took control of the market.
As always, we account for the 3-to-1 scenario, where for every dollar of risk the potential profit should be 3 dollars. If the ratio is not met, then there is no trade.
Example 3
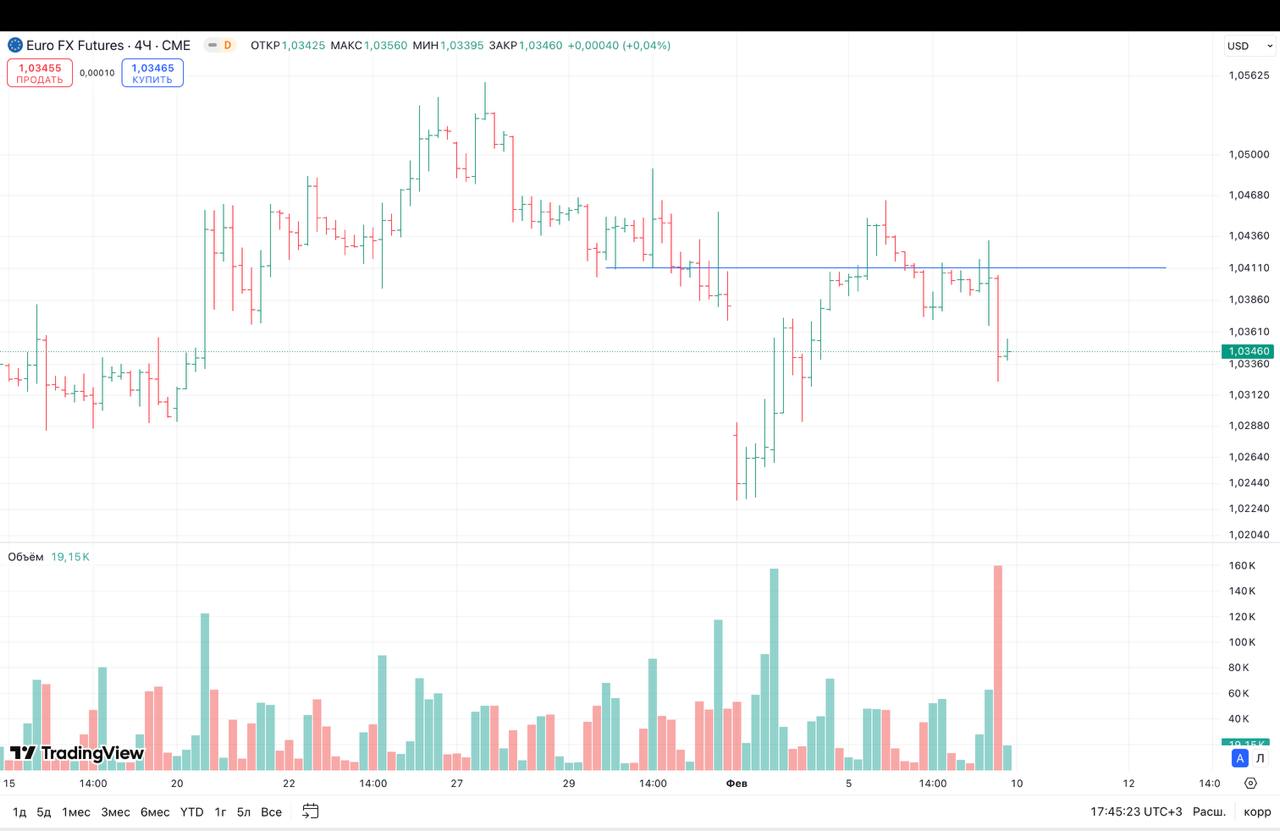
Euro future, 4-hour timeframe. On the Euro future 4-hour chart, an impulsive bearish wave is marked as a resistance level and our zone of interest.
Euro future, entry point.
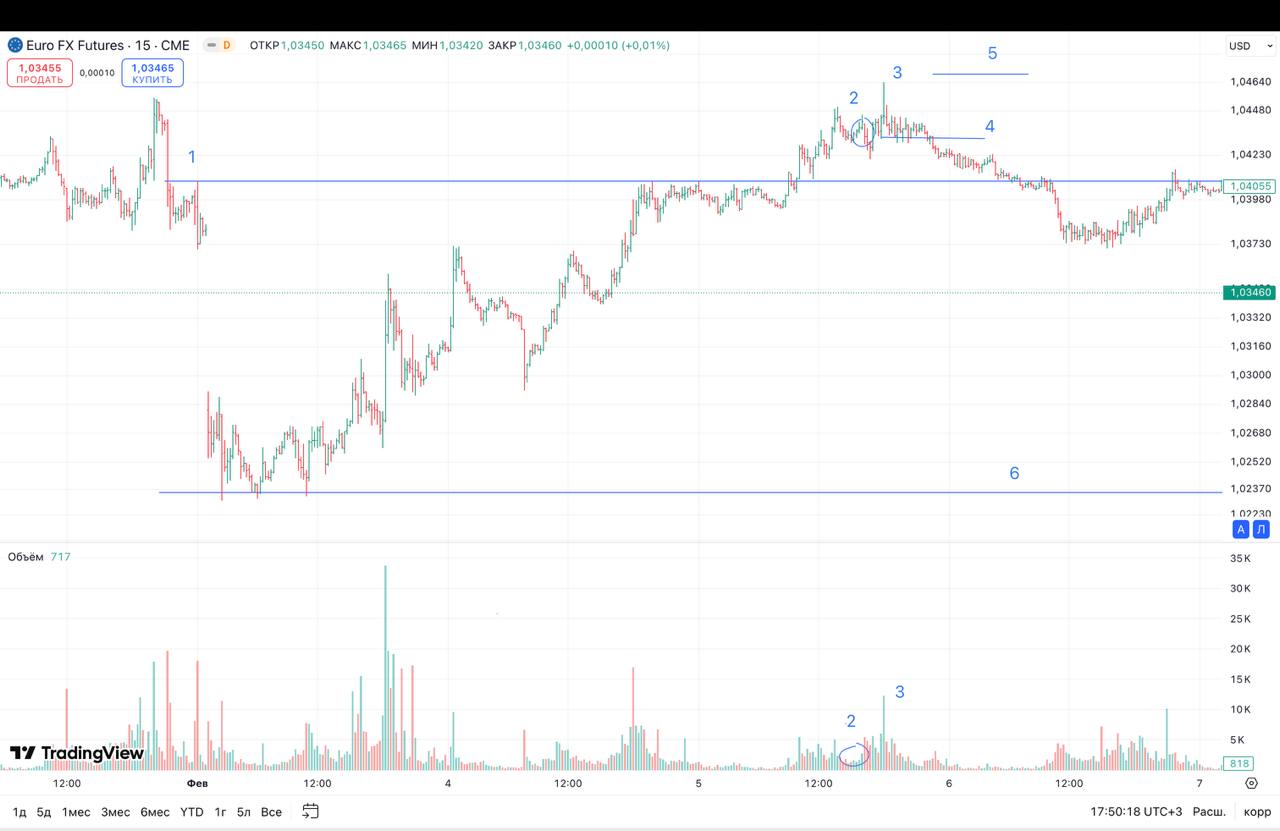
As usual, we draw the level (the resistance range from the higher 4-hour timeframe). In the range we wait for a pin-bar pattern as an attempt to rise that breaks down. In this example the pin bar looks less distinct than on other timeframes, but that changes nothing about the essence: you will always see empty waves with no volume spike (low interest in a rising market), after which the market starts to fall.
The false breakout is the main attribute of our heightened attention. As always, the same characteristics: raised volume, an attempt to rise above the pin bar or the wave without volume, and as a result price starts to fall. We mark the low of the potential false-breakout bar and enter when a bearish engulfing occurs. We set a stop-loss that controls the risk in the trade. We define the target as the opposite level from which the rise in price began.
It is important to remember the 3-to-1 rule, where for every dollar of risk we want to earn at least 3 dollars of profit.
Example 4
Bitcoin, 4-hour timeframe, resistance zone. On the Bitcoin 4-hour chart, an impulsive bearish wave is marked as a resistance level and our zone of interest.
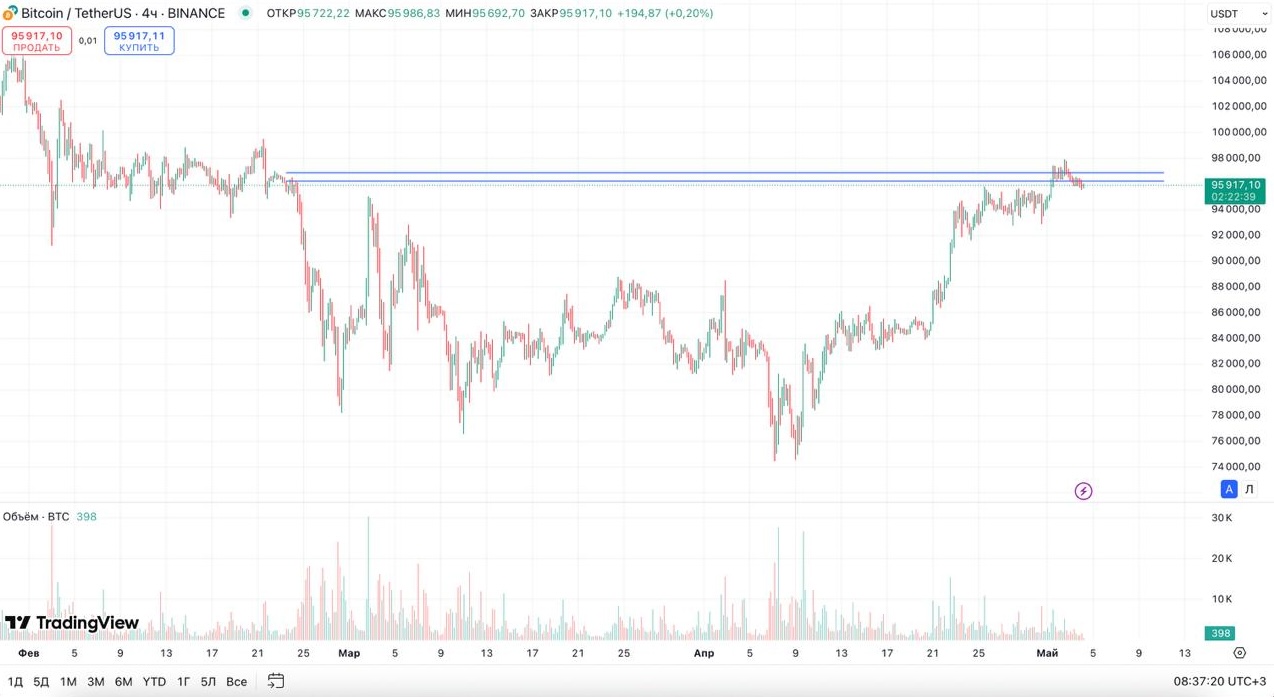
Bitcoin, a sell trade.
The resistance range on Bitcoin (98000-97000), taken from the higher x4 timeframe. A pin bar as the first sign of trouble for buyers (an inability to give higher prices, a shortage of demand). A false breakout of the level is an attempt to lift the market with a sharp change in price (here usually on raised volume). It also knocks out the stop orders of short sellers and triggers breakout orders from those who were waiting for the level to break (opening longs). Together these orders give significant demand (liquidity), which Smart Money uses to open its speculative short positions or to take profit on existing longs, which is also selling.
As usual, by the rules of Price Action we wait for a bearish engulfing pattern, which points to the dominance of bears ready to sell aggressively at market. A break of the low of the false-breakout bar signals the start of a trend in the opposite direction. A protective order is placed as the sell trade is opened, to protect the account. The target is the opposite local impulse level where buyers took control of price.
Example 5
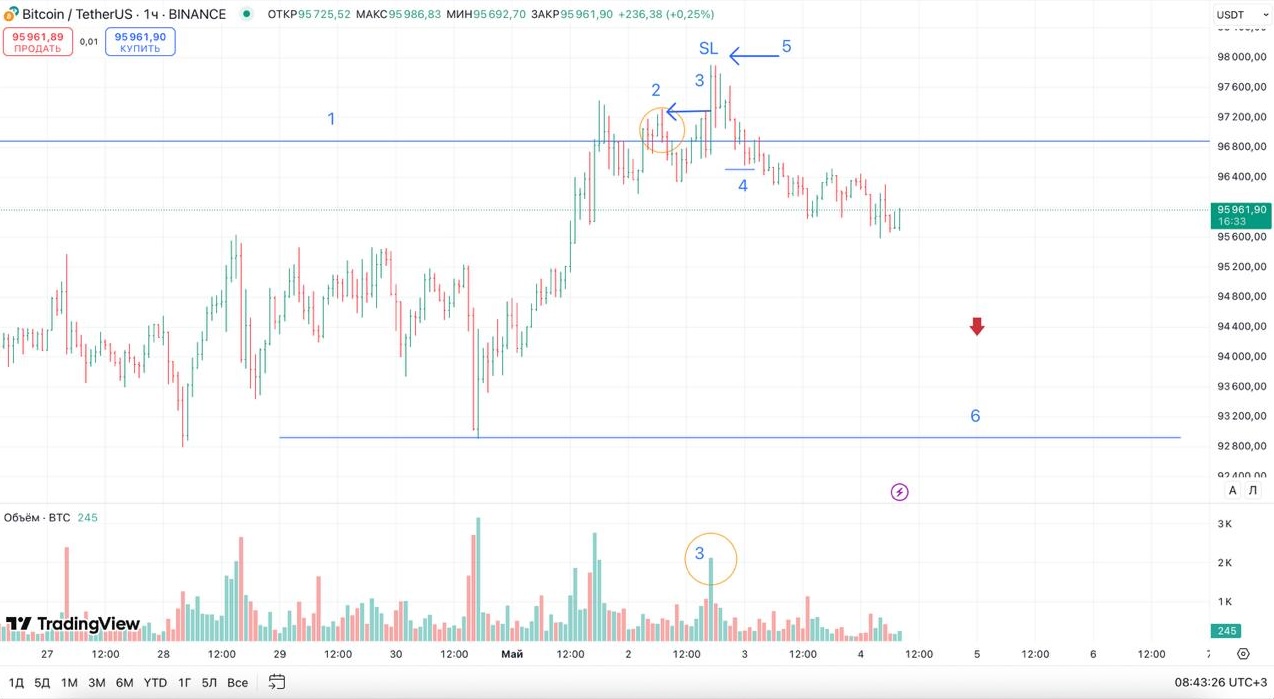
Bitcoin, a double top.
In this example we have no impulse level from a higher timeframe, just a sign of a double top. The chart shows intraday trading; schematically it is the same as the others. In the range we wait for a pin-bar pattern as an attempt to rise that breaks down. This shows buyers' inability to push price above level 1, as a rule on low volume.
The false breakout is the main attribute of our heightened attention. As always, the same characteristics: raised volume, an attempt to rise above the pin bar or the wave without volume, and as a result price starts to fall. This again shows an inability to give higher prices, now only with effort. We mark the low of the potential false-breakout bar and enter when a bearish engulfing occurs, by all the laws of Price Action. We set a stop-loss that controls the risk. We define the target as the opposite level from which the rise in price began.
It is important to remember the 3-to-1 rule, where for every dollar of risk we want to earn at least 3 dollars of profit. In this example the 3-to-1 rule is not met, so in a real situation this trade has to be skipped, even though an entry point appeared within our trading system.
A Student's Independent Trading
An example of the practical work of one of my students. The account is a demo (until the exam is passed, I recommend no one use real funds). I will say at once: this is the result of a specific student on a demo, not a promise of the same result for everyone.
Student statement, trading statistics.
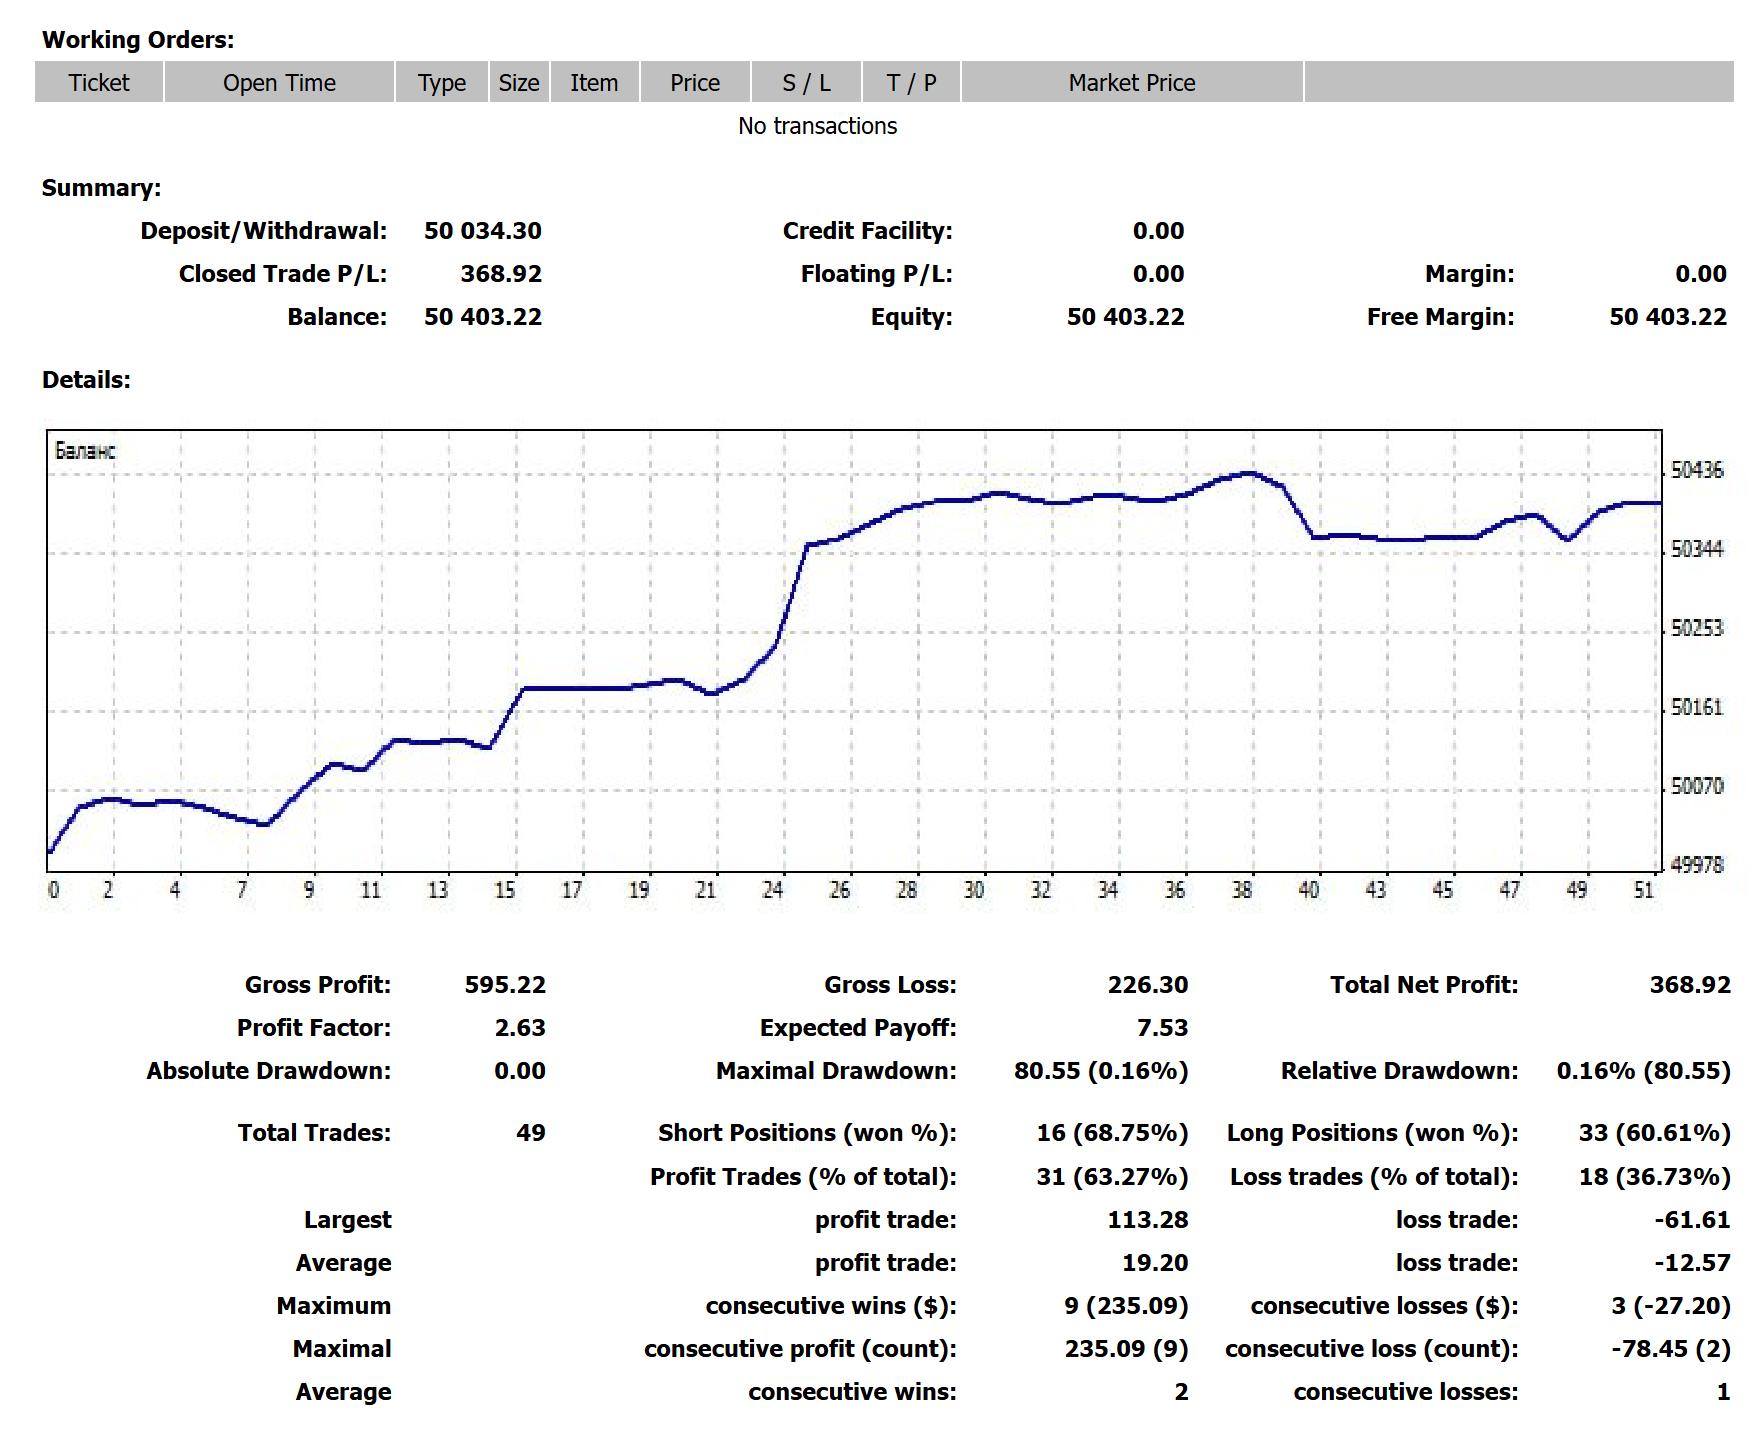
The goal of the exam is to make at least 40 trades by the rules of the trading system we study in the lessons, and to assess the result. A demo account is opened with any broker or exchange, and trading is done in the minimum lot, because the goal is not to show income in absolute terms but to see the probability distribution across the trades of the trading system.
The first important metric is the system's WinRate, visible in the Profit Trades (63.27%) and Loss Trades (36.73%) columns. It denotes the probability distribution in this trading system. In plain words, out of 100 trades there will on average be about 63 winners and 37 losers (a classic figure when working with levels).
The second metric is the Profit Factor, which shows how many dollars of profit fall on each dollar of loss. In this example it is roughly 2.5. The higher the figure, the more profitable the system. The minimally sufficient figure, in my view, is 1.8 to 2 once all commissions are accounted for. At that ratio the system has a positive expectation over the long run, although it does not guarantee the outcome of a single trade.
The third metric is the Maximal DrawDown, the deepest fall of the account. On this particular demo it came out very low, thanks to tight stop-losses and the 3-to-1 ratio. But it is important to understand: a stop-loss limits the depth of a drawdown, it does not cancel it. Drawdowns are a normal and unavoidable part of trading, since by statistics losing trades come in series. So a near-zero result on this stretch is not a property of the system and not a promise, but a consequence of strict discipline on this particular distance. How the trading system itself is built is covered separately, and I show its math in the course section on capital management.
Conclusion: the information laid out on the site as articles and videos is enough for a thorough introduction to trading. Anyone who wishes can learn this profession for free, using all the information I have gathered.
Those who wish to study the profession in detail under my mentorship can sign up for the course through the feedback form in the trading-courses section.
Frequently Asked Questions
A trading strategy is a pre-built set of clear rules that govern a trader's actions at every stage, from entering a trade to exiting it. It removes improvisation, emotional swings and subjectivity.
Because without rules, trading becomes a game of chance: commissions, the spread and emotional decisions constantly work against you, and unchecked risk eats the account. The statistics are merciless, and the majority of traders without a system and risk control lose their account.
It means that for every 1 dollar of risk you build in a potential of at least 3 dollars of profit, so the distance to the target is three times the distance to the stop-loss. If a setup does not offer that ratio, the trade is skipped.
It is an attempt to push price beyond a level that fails and quickly returns, often on raised volume, knocking out stops and pulling in breakout orders. It frequently marks the point where Smart Money grabs liquidity before a move in the opposite direction.
A win rate around 60 to 63 percent is classic when working with levels, but the figure alone means little. What matters is the win rate together with the profit factor, about 1.8 to 2 or higher after commissions, which gives a positive expectation over the long run.
About the Author
Author: Igor Arapov — independent researcher in the psychology of investment decisions and behavioral finance, practising trader since 2013, founder of arapov.trade, author of a trading book series (ORCID: 0009-0003-0430-778X).