Smart Money Strategy: How to Find Entry Points in Trading
Understanding Smart Money and Institutional Trading Dynamics
Financial markets operate under the influence of large institutional participants who possess significant capital and analytical resources. Smart Money encompasses investment banks, hedge funds, pension funds, and market makers . These entities shape market trends through strategic accumulation and distribution of positions. For a more advanced understanding, study the trade examples.
Institutional players employ sophisticated methods to analyze market structure, capital flows, and liquidity zones. Retail traders typically rely on lagging indicators and news-based decisions. Understanding how Smart Money operates provides traders with a competitive advantage in identifying optimal entry and exit points.
How Institutional Players Influence Market Movements
Large participants impact markets through several key mechanisms. The primary mechanism involves collecting liquidity by driving prices toward zones where retail traders place stop orders. This process, known as Stop Hunting, enables institutions to build positions at favorable prices without significant slippage.
Order Blocks form in areas where institutions accumulate positions before substantial price movements. These zones become support or resistance levels that price frequently revisits. The return to Order Blocks before trend continuation creates trading opportunities for informed traders.
Volume manipulation includes creating false breakouts and filling price gaps. Algorithmic trading systems allow institutional players to analyze market data and adapt to changing conditions faster than human traders. These systems recognize retail trading patterns and exploit them for profit.
High-frequency trading algorithms execute thousands of transactions per second, capturing small price inefficiencies. Market makers provide liquidity while simultaneously profiting from bid-ask spreads. Understanding these dynamics helps traders avoid common pitfalls.

Why Retail Traders Experience Losses
Private traders lose capital because they trade without understanding institutional market mechanics. Standard indicators reflect past data and fail to reveal the intentions of large players. Traders enter positions too late or place stop orders in predictable locations.
Psychological factors amplify the problem. Fear of missing profits drives traders to enter at market tops. Panic triggers selling at market bottoms. Institutional players exploit these emotional reactions through strategic price manipulation.
Inadequate understanding of market microstructure leads to systematic errors. Traders place stop orders behind obvious levels, making them easy targets for institutional manipulation. Learning Smart Money Concepts helps avoid typical traps and develop conscious trading habits.
Entry Points According to Smart Money Methodology
Institutional players seek entry points based on market structure analysis and liquidity zones. Order Blocks represent the last candles before impulsive movements and indicate areas where large participants accumulated positions.
Liquidity Sweep describes the process of triggering stop orders before price reversal. Large players artificially move prices into liquidity zones, activate stop orders, and redirect the market in the opposite direction. Fair Value Gap form after sharp movements and represent unfilled price gaps that attract price returns.
Break of Structure confirms trend changes through breakouts of key levels. Change of Character signals early indications of market direction shifts. Combining these elements increases accuracy in identifying entry moments.
Volume analysis reveals large participant activity in specific price zones. Candlestick analysis identifies reversal patterns that strengthen trading signals. Market structure analysis determines current trend phases and optimal entry areas.
Additional confirmation factors include divergences between price and volume, reaction at key psychological levels, and correlation with related instruments.
Identifying Order Blocks on Price Charts
Order Blocks represent chart zones where institutional participants accumulated or distributed positions. Bullish Order Blocks form with the last bearish candle before strong upward movement. They indicate buying areas of large players.
Bearish Order Blocks develop with the last bullish candle before decline. They mark selling zones. Strong impulse following Order Block formation should accompany increased volume. Price return to this zone confirms its significance.
Trade entry occurs after Order Block retest upon appearance of confirming candlestick patterns. Volume analysis helps determine institutional participant activity. Stop loss placement occurs beyond Order Block boundaries while take profit targets the nearest liquidity zone.
Practice identifying Order Blocks requires studying historical charts. Traders mark zones preceding significant movements and analyze price behavior upon return to these levels. Regular practice develops pattern recognition skills.
Mitigation blocks represent partially filled Order Blocks that may still hold significance. Breaker blocks form when price violates an Order Block and converts it from support to resistance or vice versa.

Using Liquidity for Entry Point Determination
Liquidity plays a central role in institutional player strategies. Large participants cannot enter markets with significant volume without preparation. This would cause substantial slippage. They create conditions for collecting retail trader liquidity.
Liquidity zones locate behind support and resistance levels, within sideways consolidations, and near daily and weekly extremes. Round psychological levels also attract order clusters. Elevated volume at specific price levels indicates large player interest.
Trading based on liquidity involves waiting for manipulation in the form of sharp movement beyond a key level with subsequent return. Confirming signals include pin bars , false breakouts, and engulfing patterns. Stop loss placement occurs beyond the nearest extreme.
Understanding liquidity mechanics allows traders to avoid placing orders in vulnerable locations. Liquidity map analysis shows potential price movement targets and probable reversal areas. This approach substantially improves trading decision quality.
Equal highs and equal lows represent obvious liquidity pools that institutional players frequently target before reversing price direction.
Applying Fair Value Gaps in Trading
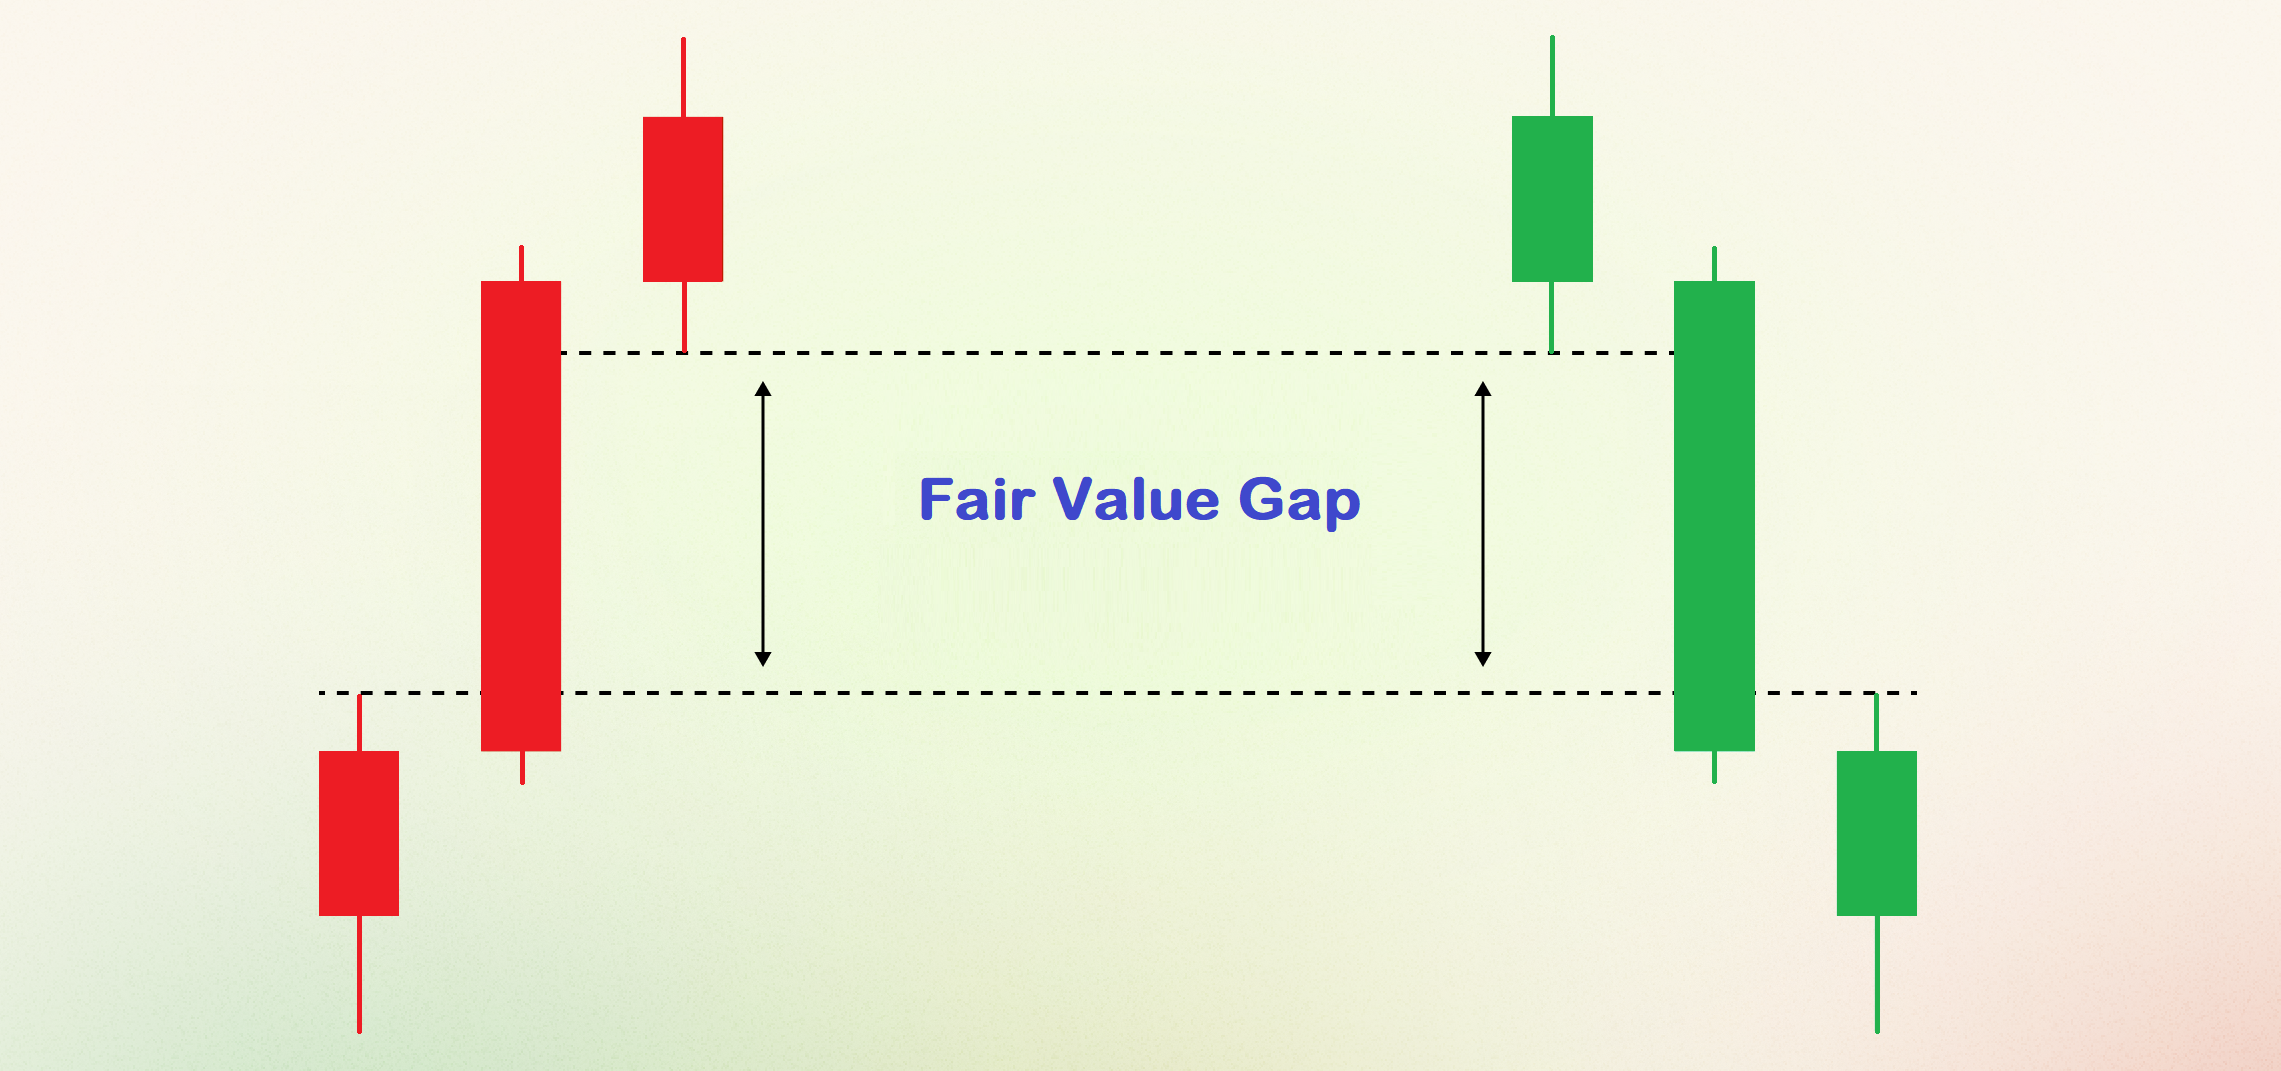
Fair Value Gaps form during rapid price movement that leaves unfilled gaps on charts. These areas indicate imbalance between buyers and sellers. Price tends to return to such zones to restore equilibrium.
Bullish FVG forms during sharp upward impulse between the first candle low and third candle high. Bearish FVG occurs during rapid decline between the first candle high and third candle low. Gap significance depends on preceding impulse strength and accompanying volume.
Position entry occurs when price returns to the FVG zone. Movement slowdown on elevated volume within the gap serves as a signal for trade opening. FVG coincidence with Order Block strengthens bounce probability. Confirming candlestick patterns increase signal reliability.
Not all Fair Value Gaps work equally effectively. Gaps on higher timeframes carry greater significance. FVGs formed in the direction of the main trend show better results. Traders consider market context when making trading decisions.
Consequent encroachment occurs when price fills approximately fifty percent of the FVG, creating a potential reaction point.
Trading Break of Structure
Break of Structure represents breakout of a key high or low confirming trend continuation. Institutional players use BOS as strategy confirmation. Bullish BOS occurs when price breaks previous high while bearish BOS happens when price breaks previous low.
Breakout should accompany strong impulsive movement and elevated volume. Price frequently returns to the broken level for testing before continuing movement. Confirming factors include candlestick patterns and liquidity presence beyond the level.
Stop loss placement occurs beyond the nearest extreme while take profit targets the next liquidity zone. Combining BOS with Order Block and FVG analysis increases entry accuracy.
Distinguishing genuine from false breakout requires analyzing accompanying factors. Volume confirmation, price consolidation beyond the level, and subsequent retest indicate genuine breakout. Absence of these signs may indicate manipulation.
Internal structure breaks occur on lower timeframes and can provide early entry signals before higher timeframe confirmation.
Identifying Reversals Through Change of Character
Change of Character indicates potential market direction change. Unlike BOS confirming trend movement, CHoCH signals transition between market phases. Bullish CHoCH occurs when price stops forming lower lows and breaks previous high.
Bearish CHoCH forms when price stops creating higher highs and breaks minimum. Structure change accompanies trend slowdown and accumulation zone formation. Volume confirmation increases successful trade probability.
Entry occurs after determining structure change and level retest. Confirmation candlestick models help identify optimal position opening moment. Early CHoCH recognition allows entry at new trend beginning with minimal risk.
Market structure shift represents a more significant change than CHoCH, often occurring after liquidity sweep at major swing points.
Combining Smart Money Concepts Elements
Reliable entry points form when multiple methodology elements coincide. Professional traders combine Order Blocks, BOS, FVG, and liquidity analysis to filter false signals. Key level breakout with subsequent return to Order Block coinciding with FVG represents high-probability trading opportunity.
Stop sweep before retest confirms institutional player activity. Confirming candlestick pattern appearance or volume increase serves as entry signal. This approach allows trading alongside large participants.
Trading plan construction includes determining priority entry zones, establishing clear confirmation criteria, and predefined stop loss and take profit levels. Systematic approach eliminates emotional decisions and improves trading discipline.
Confluence zones where multiple SMC elements align offer the highest probability setups for position entry.
Risk Management in SMC Trading
Risk control forms the foundation of stable trading. Optimal risk management involves limiting trade risk to one to two percent of capital. Stop loss placement occurs beyond liquidity zones for protection against triggering before genuine movement.
Risk to reward ratio maintains minimum one to two. Partial position closing at key levels allows profit taking while maintaining remaining position. Trailing stop maximizes returns in trending movements. Avoiding trading before important news releases reduces volatility impact.
Diversification across instruments and timeframes distributes risk. Trade statistics tracking reveals trading system strengths and weaknesses. Regular results analysis enables strategy optimization and profitability improvement.
Position sizing based on stop loss distance ensures consistent risk per trade regardless of market volatility.
Practical Recommendations for Traders
Applying Smart Money Concepts requires systematic approach and continuous practice. Market structure analysis, liquidity zone identification, and Order Block discovery constitute methodology foundation. Trading journal maintenance helps track strategy effectiveness and identify improvement areas.
Demo account testing allows concept mastery without capital loss risk. Studying price behavior on historical data develops pattern recognition skills. Gradual SMC principle implementation in trading increases entry accuracy and reduces losing trade frequency. To gain a deeper understanding of this topic, I recommend studying the trading rules.
Learning from experienced traders accelerates methodology acquisition. Trading community participation provides access to diverse perspectives and ideas. Continuous skill development and adaptation to changing market conditions ensure long-term trading success.
Backtesting across multiple market conditions validates strategy robustness before committing real capital.
Frequently Asked Questions
Smart Money refers to large institutional market participants: investment banks, hedge funds, pension funds, and market makers. They possess significant capital and analytical resources, shaping major market trends through position accumulation and distribution.
An Order Block is the last candle before a strong impulsive movement. A bullish Order Block forms with the last bearish candle before a rise, while a bearish one forms with the last bullish candle before a decline. Confirmation through elevated volume and price return to this zone is important.
A Fair Value Gap (FVG) is an unfilled price gap that forms during rapid price movement. It shows imbalance between buyers and sellers. Price tends to return to these zones, creating trading opportunities for position entry.
Break of Structure (BOS) confirms continuation of the current trend through a key level breakout. Change of Character (CHoCH) signals a potential trend change when price stops forming new extremes in the previous direction and breaks the opposite level.
Optimal risk per trade is 1-2% of capital. Stop loss is placed beyond liquidity zones. Minimum risk-to-reward ratio is 1:2. Partial position closing at key levels and trailing stop use in trending movements is recommended.
About the Author
Author: Igor Arapov — independent researcher in trading psychology and behavioral finance, practising trader since 2013, founder of arapov.trade, author of a trading book series (Open Library ), (ORCID: 0009-0003-0430-778X ).