What is a Pin Bar
The pin bar stands as one of the most recognizable and effective candlestick patterns in modern technical analysis across global financial markets. This distinctive formation derives its name from Pinocchio Bar due to its characteristic long shadow resembling the fictional character's nose and symbolizing a false price movement before a sharp reversal. Traders worldwide actively utilize pin bars to identify potential reversal points and find entries with optimal risk-to-reward ratios across various financial instruments.
Pin Bar Anatomy
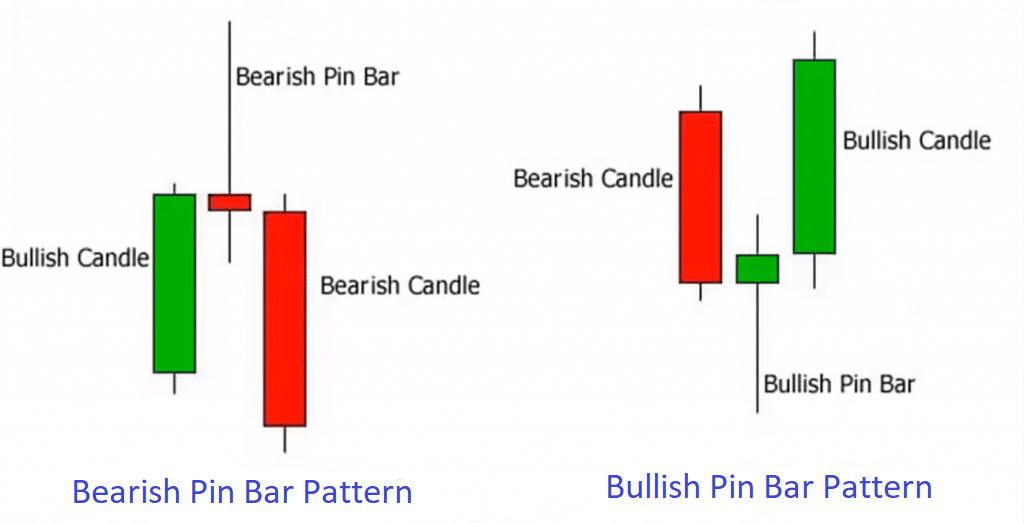
Pin bar structure consists of three mandatory key elements that form its easily identifiable appearance on any price chart. The long candle shadow represents the main defining part of the candle and should exceed the body by at least two or even three times for a classic pattern formation. The compact candle body positions itself at one end of the overall range and indicates a minimal difference between opening and closing prices during the trading session. A short opposite shadow or its complete absence significantly strengthens the pattern's significance and convincingly confirms market participants' determination to defend a particular price level.
Pin bar formation reflects the dramatic intense struggle between buyers and sellers for control over asset prices throughout the entire trading session. At the beginning of candle formation one group of participants clearly dominates and aggressively pushes price in a certain direction creating a long shadow through their decisive market actions. However by the time the candle closes the opposite side fully mobilizes its resources and decisively seizes initiative confidently returning price to opening levels or even significantly higher. This dynamic process creates the characteristic visual picture of level rejection. To understand this topic more deeply, I recommend studying the engulfing candlestick.
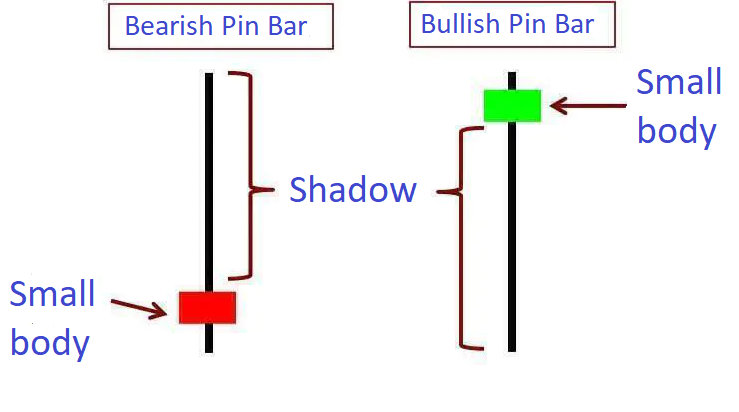
Bullish Pin Bar
A bullish pin bar forms at the bottom of price movement after extended decline and confidently signals potential market reversal upward. Its long lower shadow clearly shows that sellers temporarily controlled the situation aggressively pushing price down to a certain minimum attempting to continue the downward movement. However buyers demonstrated sufficient strength and determination to confidently return quotes to the upper part of the candle range by closing time. Such convincing dynamics indicates seller exhaustion and complete market readiness for powerful upward movement.
Bearish Pin Bar
A bearish pin bar appears at price movement peaks after extended growth foreshadowing possible market reversal downward and the start of correction or new trend. The long upper shadow clearly demonstrates buyers' failed attempt to consolidate price at higher levels and continue upward movement. Sellers successfully and decisively repelled the bull attack confidently returning quotes down to opening prices or significantly lower. Such candle configuration unambiguously indicates weakening buying pressure and potential start of downward movement.
Context and Signal Confirmation
Formation context significantly determines the pin bar's trading value and real probability of successful signal execution. Candlestick Patterns emerging at key support and resistance levels possess significantly greater reliability and trading potential for the trader. Historically significant price zones attract close attention from large institutional market participants which substantially amplifies reaction to reversal signal appearance. Pin bars in the middle of price ranges without clear level attachment rarely lead to significant directional movements.
Pattern confirmation requires thorough comprehensive analysis of additional technical factors and current market conditions. Trading volume during candle formation reliably reflects the degree of large professional player participation in price movement. Elevated volume on a pin bar indicates significant institutional trader interest in the specific price level. Low volume may indicate the formation's random nature and increased risk of receiving a false breakout signal.
Pin Bar and Fibonacci Levels
Fibonacci levels organically and effectively complement pin bar analysis creating powerful signal confluence zones on the chart. Correction levels of thirty-eight point two percent fifty percent and sixty-one point eight percent regularly serve as reversal pattern formation points. Pin bar coincidence with a Fibonacci level substantially and significantly increases successful trade probability. Experienced traders purposefully use this combination to search for high-probability trading opportunities in the market.
Indicator Confirmation
Moving averages help accurately determine the dominant trend direction and effectively filter false pin bar signals. Trading in the main trend direction substantially and significantly increases chances for successful pattern execution. A bullish pin bar above the rising two-hundred-period moving average has significantly more success chances than a similar pattern below this important dynamic line. Bearish pin bars prove most effective in downtrends below key moving averages. I also recommend studying false breakouts for a complete picture.
Oscillator-type indicators provide valuable additional confirmation of pin bar signals and help objectively assess current market conditions. RSI in the oversold zone substantially strengthens a bullish pin bar indicating significant asset price recovery potential. Overbought RSI convincingly confirms a bearish pin bar signaling possible quote decline. Divergences between price and oscillators combined with pin bars create especially powerful and reliable trading setups.
Risk Management
Risk management in pin bar trading bases itself on clear balanced rules for protective order placement and position size control. Stop-loss placement occurs beyond the long candle shadow ensuring reliable protection against false level breakouts. Distance from entry point to stop precisely determines position size through the risk management formula. Typical risk/reward ratio equals one to two or one to three to ensure positive mathematical expectation.
Trade entry point for a pin bar is determined by several different methods depending on the chosen trading strategy aggressiveness. Aggressive entry executes immediately after pin bar candle close without waiting for additional market confirmation. Conservative approach involves patient waiting for breakout of the bullish high or bearish low by the next candle. The intermediate option uses pullback to the pin bar body middle to obtain a more advantageous entry price.
Take-profit placement occurs at the nearest significant support or resistance levels in the direction of anticipated asset price movement. Fibonacci levels historical extremes and psychologically important round numbers serve as reliable profit-taking landmarks. Partial position closing at intermediate levels allows locking in profit portion while preserving further movement potential. Moving stop-loss to breakeven after achieving certain profit substantially reduces trading risks.
Timeframe Selection
Timeframe substantially and directly affects pin bar signal reliability and their real trading potential for the trader. Daily and four-hour charts generate the most reliable patterns with clearly expressed structure and high signal execution rates. Weekly pin bars indicate long-term reversals and ideally suit position traders with extended horizons. Lower timeframes contain significant market noise substantially reducing overall pattern effectiveness.
Pin Bar Across Different Markets
Pin bar trading in the forex currency market has its specific characteristic features related to high liquidity of major currency pairs. Dollar pairs demonstrate clear technical patterns thanks to enormous daily trading volume in this market. Economic news and central bank decisions can provoke false pin bars during high market volatility periods. Avoiding trading thirty minutes before and after important news substantially reduces the risk of falling into traps.
The cryptocurrency market features elevated volatility substantially amplifying pin bar amplitude and range on charts. Bitcoin and Ethereum form expressive clear patterns on daily and four-hour charts. Using wider stop-losses adequately compensates for increased cryptocurrency asset volatility.
Commodity markets actively respond to macroeconomic factors forming significant pin bars at key price levels. Gold and oil demonstrate technically clean patterns thanks to high liquidity and broad participation from various trader categories. Seasonal factors and geopolitical events substantially affect commodity asset dynamics.
Psychology and Discipline
Psychological aspects of pin bar trading require iron discipline and unwavering adherence to the trading plan without exceptions. Patient waiting for quality setups effectively prevents overtrading and emotional ill-considered decisions. Accepting losses as an integral part of trading helps maintain a rational professional approach. Regular analysis of completed trades reveals patterns and consistently improves trading skills.
Trading journal maintenance carefully records all pin bar trades indicating context entry and exit points and final results. Combining pin bars with other candlestick patterns creates a comprehensive effective technical analysis system within the Price Action methodology. Multi-timeframe analysis enhances pin bar signal reliability and the overall market picture.
Frequently Asked Questions
A pin bar is a candlestick pattern with a long shadow and small body signaling potential price reversal. The long shadow shows rejected price level while the compact body indicates market indecision. The name derives from Pinocchio Bar.
A bullish pin bar has a long lower shadow and forms after decline signaling upward reversal. A bearish pin bar has a long upper shadow and appears after rally indicating potential downward reversal.
Pin bar is most effective at key support and resistance levels, Fibonacci levels (38.2%, 50%, 61.8%), round numbers, and high volume zones. Patterns without level attachment have low reliability.
Stop-loss is placed beyond the long shadow. For bullish pin bar — below shadow minimum, for bearish — above shadow maximum. Recommended risk-to-reward ratio is minimum 1:2.
Most reliable pin bars form on daily (D1) and four-hour (H4) charts. Lower timeframes (M5, M15) contain significant market noise and false signals.
About the Author
Author: Igor Arapov — independent researcher in trading psychology and behavioral finance, practising trader since 2013, founder of arapov.trade, author of a trading book series (Open Library ), (ORCID: 0009-0003-0430-778X ).