Introduction: The Foundation of Consistent Trading
Financial markets offer countless opportunities daily, yet the majority of participants end up losing money. The difference between winners and losers rarely comes down to intelligence or market knowledge. Rather, it stems from the presence or absence of a structured approach. A trading system transforms random decision-making into a disciplined process with measurable outcomes. To understand this topic more deeply, I recommend studying the trader's plan.
Markets function as complex adaptive environments where millions of participants act on diverse information and motivations. Prices move in response to economic releases, geopolitical events, institutional flows, and collective psychology. Navigating this environment through intuition alone proves challenging even for experienced traders.
A systematic approach addresses several fundamental challenges. First, it removes subjectivity from the decision-making process — when rules are defined beforehand, the trader acts consistently regardless of emotional state. Second, a system enables objective performance evaluation through historical testing before risking real capital. Third, documented rules create a foundation for analyzing mistakes and continuous refinement of methodology. I also recommend studying the Smart Money Strategies for the full picture.
Components of a Complete Trading System
A trading system integrates market analysis methodology, criteria for position entry and exit, capital management rules, and risk control mechanisms. Each component connects with others and contributes to overall performance.
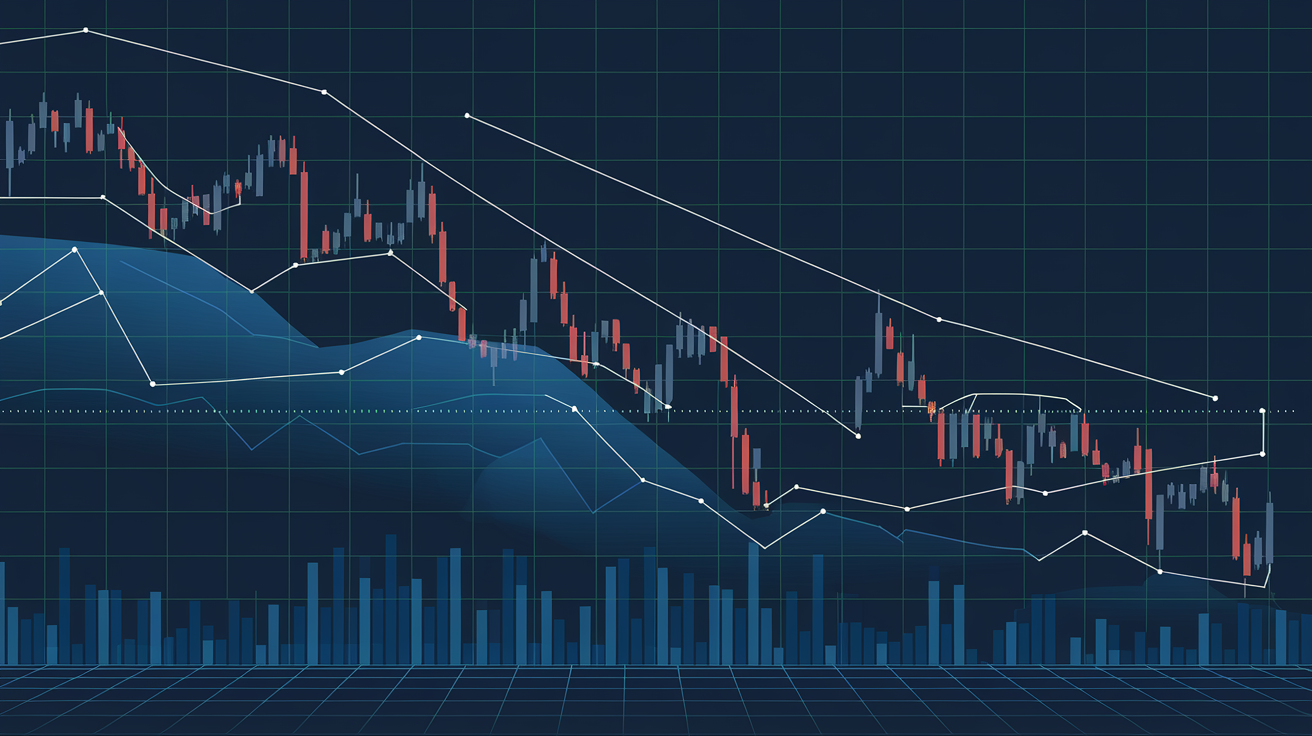
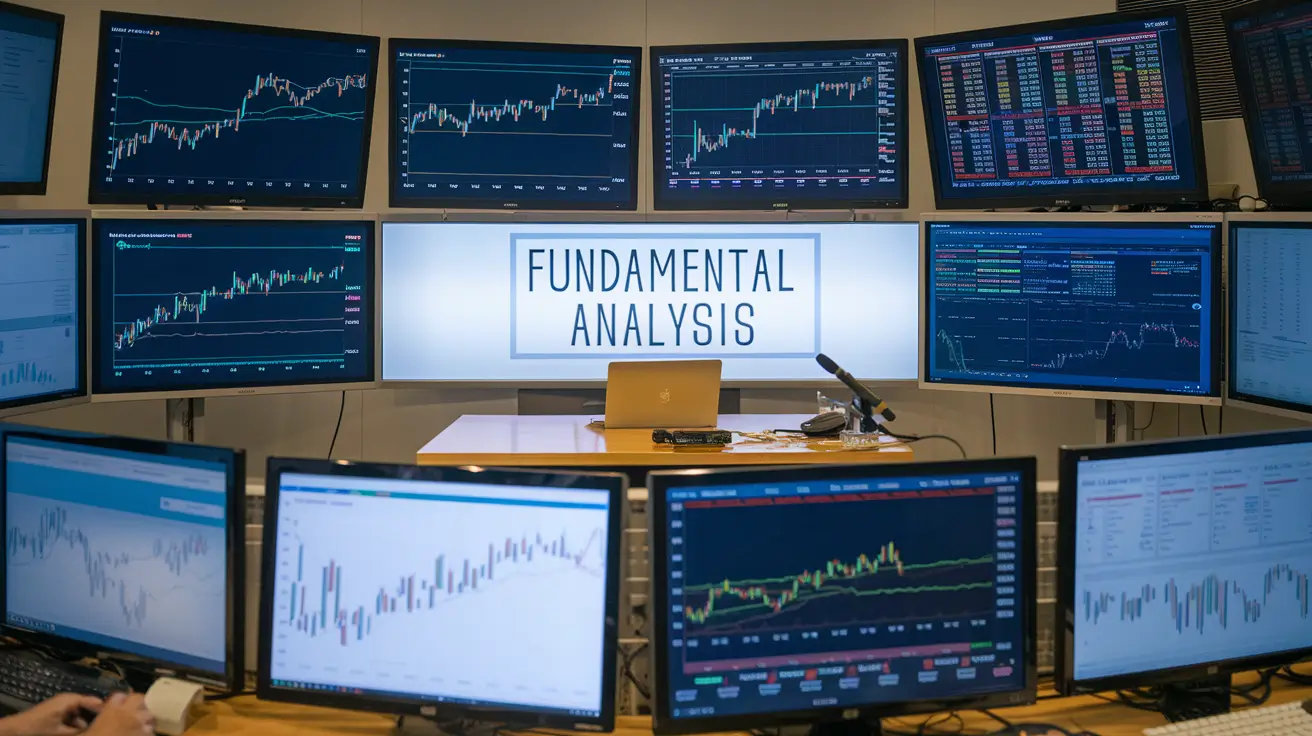
Market analysis may rely on technical approaches studying charts and price patterns, or fundamental methods examining economic indicators and news flow. Many professionals combine both methodologies to gain a more complete market perspective. I recommend beginners first study technical analysis.

Entry criteria specify exact conditions for opening a position. These might include breakouts of key levels, formation of specific candlestick patterns, signals from technical indicators , or combinations of multiple factors. Precise formulation of these criteria minimizes room for subjective interpretation.
Exit rules establish when to close a position — both for taking profits and cutting losses. Professionals define stop-loss levels to limit downside and take-profit targets to lock in gains before entering any trade. This protects against emotional decisions during live trading.
Capital management, or money management, determines position size relative to total capital. A standard guideline suggests risking no more than one to two percent of the account on any single trade. This approach ensures survival even through extended losing streaks.
Classification of Trading Systems by Approach
Trend Following Strategies
A trend following system operates on the principle that prices tend to continue moving in their established direction. When a sustained move develops, the probability of continuation exceeds that of reversal. The trader enters positions aligned with the trend and holds until exhaustion signals appear.
Trend identification employs moving averages of various periods, the ADX indicator for measuring trend strength, and visual analysis of higher highs and higher lows structure. A classic buy signal occurs when a faster moving average crosses above a slower one while ADX reads above twenty-five.
The advantage of trend systems lies in their ability to capture large moves that generate substantial profits. The drawback emerges during ranging markets, where the absence of clear direction leads to whipsaws and consecutive losses. Experienced traders add filters to avoid trading during sideways conditions.
Counter-Trend Methods
Counter-trend systems build on the assumption that prices revert to mean values after extreme deviations. When markets become overbought or oversold, correction probability increases. The trader seeks extreme levels to enter against the prevailing move.
Analytical tools include oscillators such as RSI, Stochastic, and Bollinger Bands. A buy signal forms when price enters oversold territory and begins reversing upward. Support and resistance levels strengthen such signals by marking potential reversal zones.
Counter-trend trading demands precise timing and strict risk control. Misjudging a reversal can result in substantial losses if the trend continues. Such systems typically employ smaller position sizes and wider stops to account for this uncertainty.
Scalping Strategies
Scalping represents a trading style involving numerous quick trades throughout the day. Each operation generates small profits, but volume compensates for modest individual gains. Scalpers may execute dozens or hundreds of trades per session, working on one-minute and five-minute charts.
Success in scalping requires minimal spreads, fast order execution, and high instrument liquidity. The trader must react instantly to market changes and maintain iron discipline. Technical indicators on short timeframes generate many signals, and the scalper must filter out false ones.
Psychological pressure in scalping significantly exceeds other trading styles. Constant tension and rapid decision-making suit not every personality. Additionally, commission costs from high trade frequency can erode a substantial portion of profits.
Swing Trading
Swing trading focuses on capturing medium-term market swings by holding positions from several days to several weeks. This approach allows time for thorough analysis and does not require constant screen monitoring.
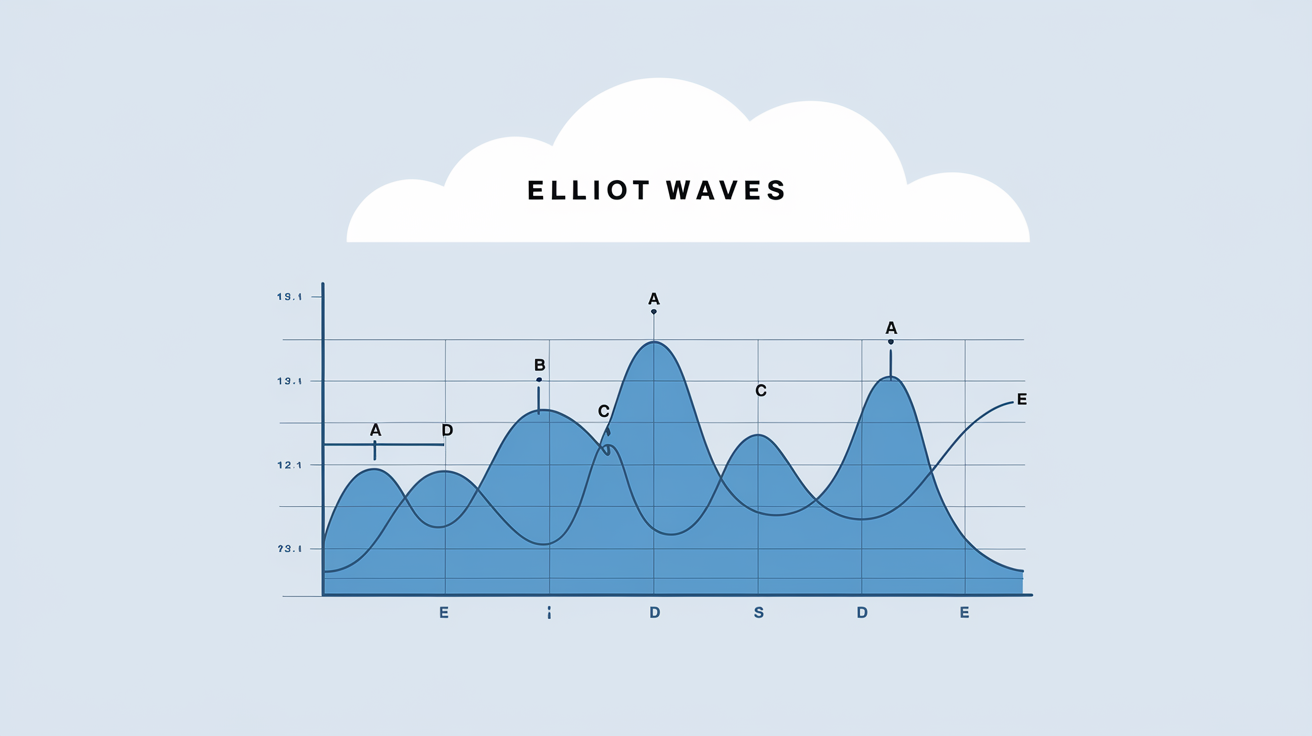
Swing traders primarily work on daily and four-hour charts, utilizing Fibonacci levels to identify targets and retracements, chart patterns to find entry points, and fundamental analysis to understand broader context.
The advantage of swing trading lies in balancing trade frequency with profit potential. Traders avoid the noise of shorter timeframes while not locking capital for months as in position trading.
Classification by Holding Period
Time horizon shapes numerous system aspects: chart timeframe selection, indicator types, stop and target sizes, and psychological demands on the trader.
Intraday trading requires closing all positions before the session ends. Traders avoid overnight gap risk but must monitor markets continuously. This approach demands significant time and concentration throughout the trading day.
Medium-term systems operate on horizons from several days to several weeks. Analysis occurs on daily charts, with decisions made once or twice daily. This allows combining trading with other professional activities.
Long-term approaches focus on months and years. Positions open based on major trends and fundamental factors. This style requires patience and the ability to ignore short-term fluctuations.
Automation in Trading
Modern technology enables full or partial trading automation. Algorithmic systems execute trades according to predefined rules without human intervention, eliminating emotional factors and ensuring instant signal response.
Fully automated robots independently analyze markets, open and close positions, and manage risk. The trader only monitors overall parameters and periodically evaluates results. This approach frees time but requires careful algorithm development and testing.
Semi-automated systems combine human analysis with automatic execution. The trader determines direction and levels while software places orders and monitors their execution. This reduces workload and eliminates manual entry errors.
Automation carries risks as well. Technical failures, incorrect data, or changing market conditions can lead to losses. An algorithm performing brilliantly on historical data may prove ineffective in live trading. Therefore, automated systems require constant monitoring and readiness for manual intervention.
System Performance Metrics
Objective system evaluation relies on measurable indicators rather than subjective impressions. Key metrics enable comparison between different approaches and tracking performance changes over time.
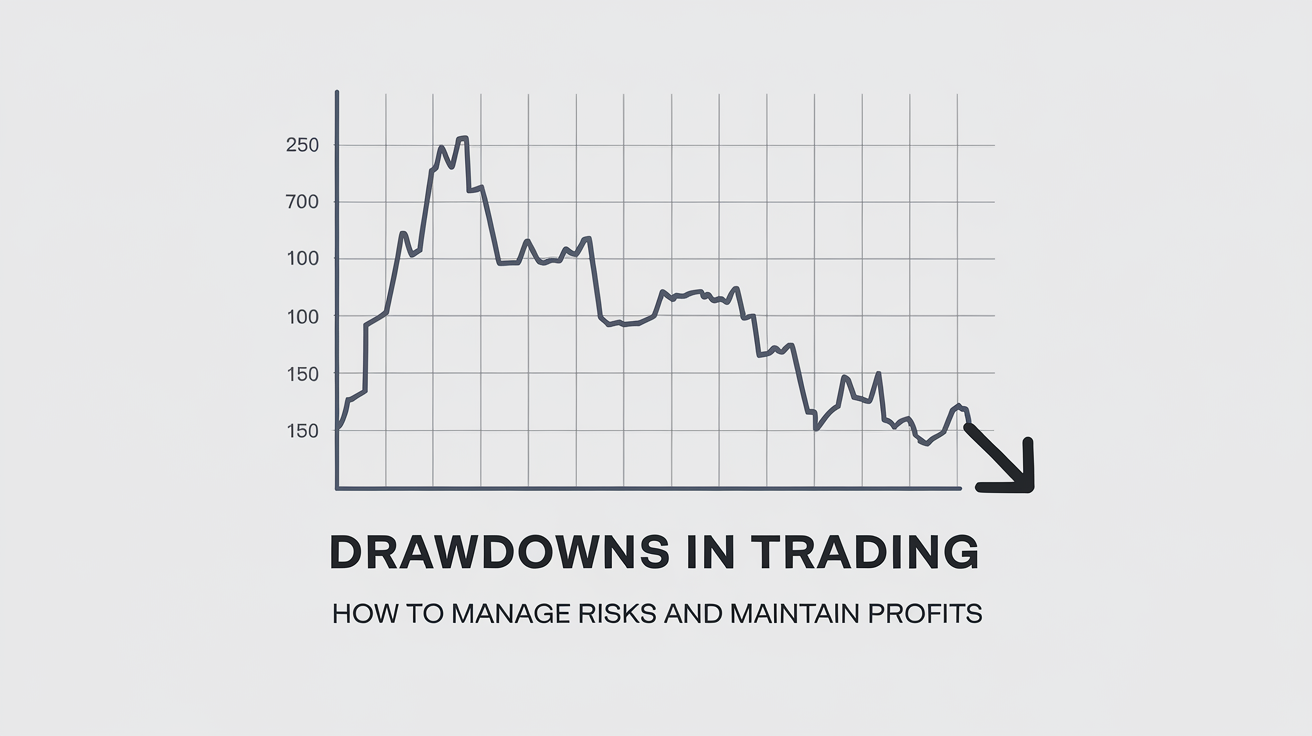
Profitability shows absolute and percentage capital growth over a period. However, profitability alone proves insufficient for evaluation — relating it to risk taken matters equally. High returns achieved through critical drawdowns do not characterize a system as reliable.
Drawdown reflects maximum capital decline from peak value. This metric demonstrates the worst-case scenario and helps understand what psychological and financial stress awaits the trader. Systems with drawdowns exceeding thirty to forty percent carry elevated risks.
The Sharpe ratio measures return per unit of risk. Values above one are considered acceptable, above two are considered good. This metric enables comparison between systems with different result volatility.
Win rate, the percentage of profitable trades, matters in context of the reward-to-risk ratio. A system with thirty percent win rate can prove profitable if average gains triple average losses. Conversely, high win rate guarantees nothing with unfavorable ratios.
Testing Methodology
Testing represents an essential phase in system development. Backtesting on historical data reveals how a strategy would have performed in the past. This serves as the first filter, eliminating obviously unworkable ideas.
Quality backtests require sufficient data volume covering various market conditions: trending and ranging periods, high and low volatility, crisis events. Testing only on favorable historical segments produces distorted pictures.
Forward testing, or demo account verification in real-time, reveals problems invisible in historical data: slippage, execution delays, news impact. Recommended forward test duration spans at least two to three months.
Transition to live trading begins with minimal sizes. Gradual position increases allow adapting to the psychology of trading real money and confirming result consistency.
Guidance for Beginning Traders
Beginners should focus on mastering one simple system rather than attempting to cover everything at once. Understanding basic strategy principles creates a foundation for further development.
Maintaining a trading journal represents an essential habit from day one. Recording every trade with entry reasons, levels, and outcomes enables error analysis and progress tracking. Without such analysis, learning becomes aimless wandering.
Risk management must take priority over chasing profits. Preserving capital during the early stage matters more than quick gains. Small losses form a normal part of trading, but critical losses can permanently close the path to the profession.
Continuous learning and adaptation remain integral to a trading career. Markets evolve, new instruments and analysis methods emerge. Willingness to learn and reassess approaches distinguishes successful traders from those stuck at one level.
Conclusion
A trading system forms the foundation of professional market engagement. It transforms trading from gambling into a measurable business process with clear rules and expected outcomes. System development, testing, and refinement require time and effort, but this represents an investment in long-term success. To consolidate the material, also study the trade examples .
Choosing a specific system type depends on individual characteristics: temperament, available time, capital size, and risk tolerance. No universal solution exists — each trader must find an approach matching their personality and circumstances.
Start simple, test thoroughly, manage risk strictly. This path demands patience and discipline, but leads to sustainable results in financial markets.
Frequently Asked Questions
A trading system is a structured set of rules and algorithms that define entry and exit conditions, position sizing, and risk management. The system eliminates emotional decision-making and ensures consistency in trading decisions.
Main types include: trend-following systems (trading with the trend), counter-trend systems (trading against the trend), scalping systems (multiple quick trades), swing trading (holding positions for days), and arbitrage systems (exploiting price discrepancies).
Testing includes backtesting on historical data, forward testing on a demo account, and gradual transition to live trading with minimal position sizes. Key metrics to analyze include profitability, drawdown, Sharpe ratio, and win rate.
Key elements include: market analysis rules, entry and exit criteria, capital and risk management system, position sizing rules, and performance evaluation metrics.
Automated systems eliminate emotional bias, provide instant signal execution, operate around the clock without fatigue, enable testing strategies on large datasets, and can monitor multiple instruments simultaneously.
About the Author
Author: Igor Arapov — independent researcher in trading psychology and behavioral finance, practising trader since 2013, founder of arapov.trade, author of a trading book series (Open Library ), (ORCID: 0009-0003-0430-778X ).