Free Trading Course for Beginners
This free, self-paced course takes you from the basics to a complete trading system you can practise on a demo account. It is built around volume analysis and the Wyckoff method, without indicators sold as ready signals and without promises of quick profit. Work through the 32 sections in order, then prove the system over 100 demo trades before you risk real money.
I kept only what I actually use at the chart: how to read structure and volume, where professional money acts, how to size a position and manage the exit. The goal is not to make trading sound easy, but to give you a clear method and an honest picture of what consistency really takes.
Course Contents
Introduction
- Course Roadmap
- How to Start Learning Trading
- What is a Quick Start in Trading
- How to Work Through the Course
Terminal and Demo Account
Basic Concepts
Technical Analysis
Reversal Patterns and Trend Strength
Volume Analysis and Orders
Wyckoff Method
- Working with Levels: Liquidity Deficit
- The Wyckoff Method
- The Effort vs Result Principle in the Wyckoff Method
Entry Point
Psychology and Risk Management
- Trading Psychology
- How to Calculate Position Size with Risk Control
- Fear and Greed in Trading
- About Indicators in Trading
- Fundamental Analysis in Trading
Trading System
Position Management and Mathematical Expectation
Preparing for Practice
- Common Mistakes of Beginner Traders
- How to Choose a Broker for Trading?
- What Should a Beginner Trade on the Exchange?
- How to Start Trading on a Demo Account?
- The Trader's Trading Journal
My name is Igor Arapov. I have been trading financial markets since 2013. Over that time I kept the methods I actually rely on and compiled them in this course. No unnecessary theory, only what I use in my own live trading.
Course Roadmap:
- Introduction to the Market — terminal, chart, bar, timeframe, volume
- Technical Analysis — trend, range, PCL levels, reversal patterns, trend strength
- Volume Analysis and the Wyckoff Method — effort vs result principle, entry point, professional capital behavior
- Psychology and Risk Management — position sizing, fear and greed, indicators, fundamental analysis
- Trading System — three live trade breakdowns, position management, mathematical expectation
- Preparing for Practice — common mistakes, choosing a broker, instruments, leverage, basic concepts, trading journal
- Demo Account Practice — open a demo account, apply the system, complete 100 trades, calculate mathematical expectation, transition to a live account
The course covers everything you need to get started: from basic concepts to a complete trading system with a positive mathematical expectation. The material follows the principle of "from simple to complex." I recommend against skipping sections — each one builds on the previous.
How to Start Learning Trading
If you are just getting acquainted with trading, follow this simple plan:
- Study the course in full — read the sections in order, do not skip. Each section builds on the one before it.
- Open a demo account — this can be done for free with any broker. Real money is not needed at this stage.
- Apply theory immediately — as you study each section, open a chart and look for what you just read about. Range, trend, PCL — all of this exists on any chart right now.
- Complete 100 trades on the demo account — only after this will you be able to objectively evaluate your trading system and its mathematical expectation.
- Transition to a live account — only when the demo account shows a stable result over the distance of trades.
Do not rush. The market is not going anywhere, and capital lost through impatience is far harder to recover than spending an extra month on preparation.
What is a Quick Start in Trading
I want to clarify one thing upfront — a beginner who is only starting to trade on the market simply cannot physically become a complete trader, because they lack the skill and experience, and often the theoretical foundation. This is exactly what training solves — when a beginner learns from an experienced trader, they not only gain theoretical knowledge, but most importantly receive a ready-made trading system. A trading system is the fastest possible way to start trading on financial markets!
A trading system is a set of clear rules for determining when to enter and exit the market. Minimum deliberation — just a clear plan of action. When a beginner adopts such a system during training, they have not yet become an experienced market participant, but they can already operate on the same level as those who have been doing this for years — because in essence the experienced trader's system does the work for them.
The course you are about to study gives you not only the theoretical foundation but also a complete trading system — all you need to do is practice it on a demo account. In the "Trader's Trading System" section you will see how the trend structure of the market changes and what stages it passes through before changing. I always wait for this complex of factors before determining which direction to open trades — if you do the same, you will reach practice as quickly as possible!
How to Work Through the Course
The course consists of 31 sections — arranged sequentially from the basics to practice. Each section includes theory and how it is applied in practice to forecast the market. In this course I do not cover the operation of trading terminals, as there are many of them, but they all share a similar operating principle — the trader must buy or sell an asset through a broker or exchange in order to profit from the price difference.
We will study only the key principles of technical analysis which you can then practice on a demo account. All general trading theory is outside the scope of this course, but it is available in the articles on the site and you can always refer to it if you want to learn more.
I deliberately limit the amount of information at the start, because over many years of teaching trading I have noticed that beginners struggle with the specific terminology of this profession, which in turn slows down the learning process and takes them away from the goal.
The step-by-step plan is in place — now we need the tool. Let us open the terminal and learn how to read the chart we will be working with throughout this course.
Introduction to Charts and the Trading Terminal
Now that the plan is clear and the trading system has been defined as the goal — we need a working tool. The terminal and demo account will be your working environment throughout this entire course.
Using the TradingView platform as an example, let us cover the basic information you need to absorb before starting the course. Most platforms are built on one principle — there is a main workspace where the trader sees price movements for the assets they follow, and a supplementary lower area for indicators that assist in analysis and market forecasting.
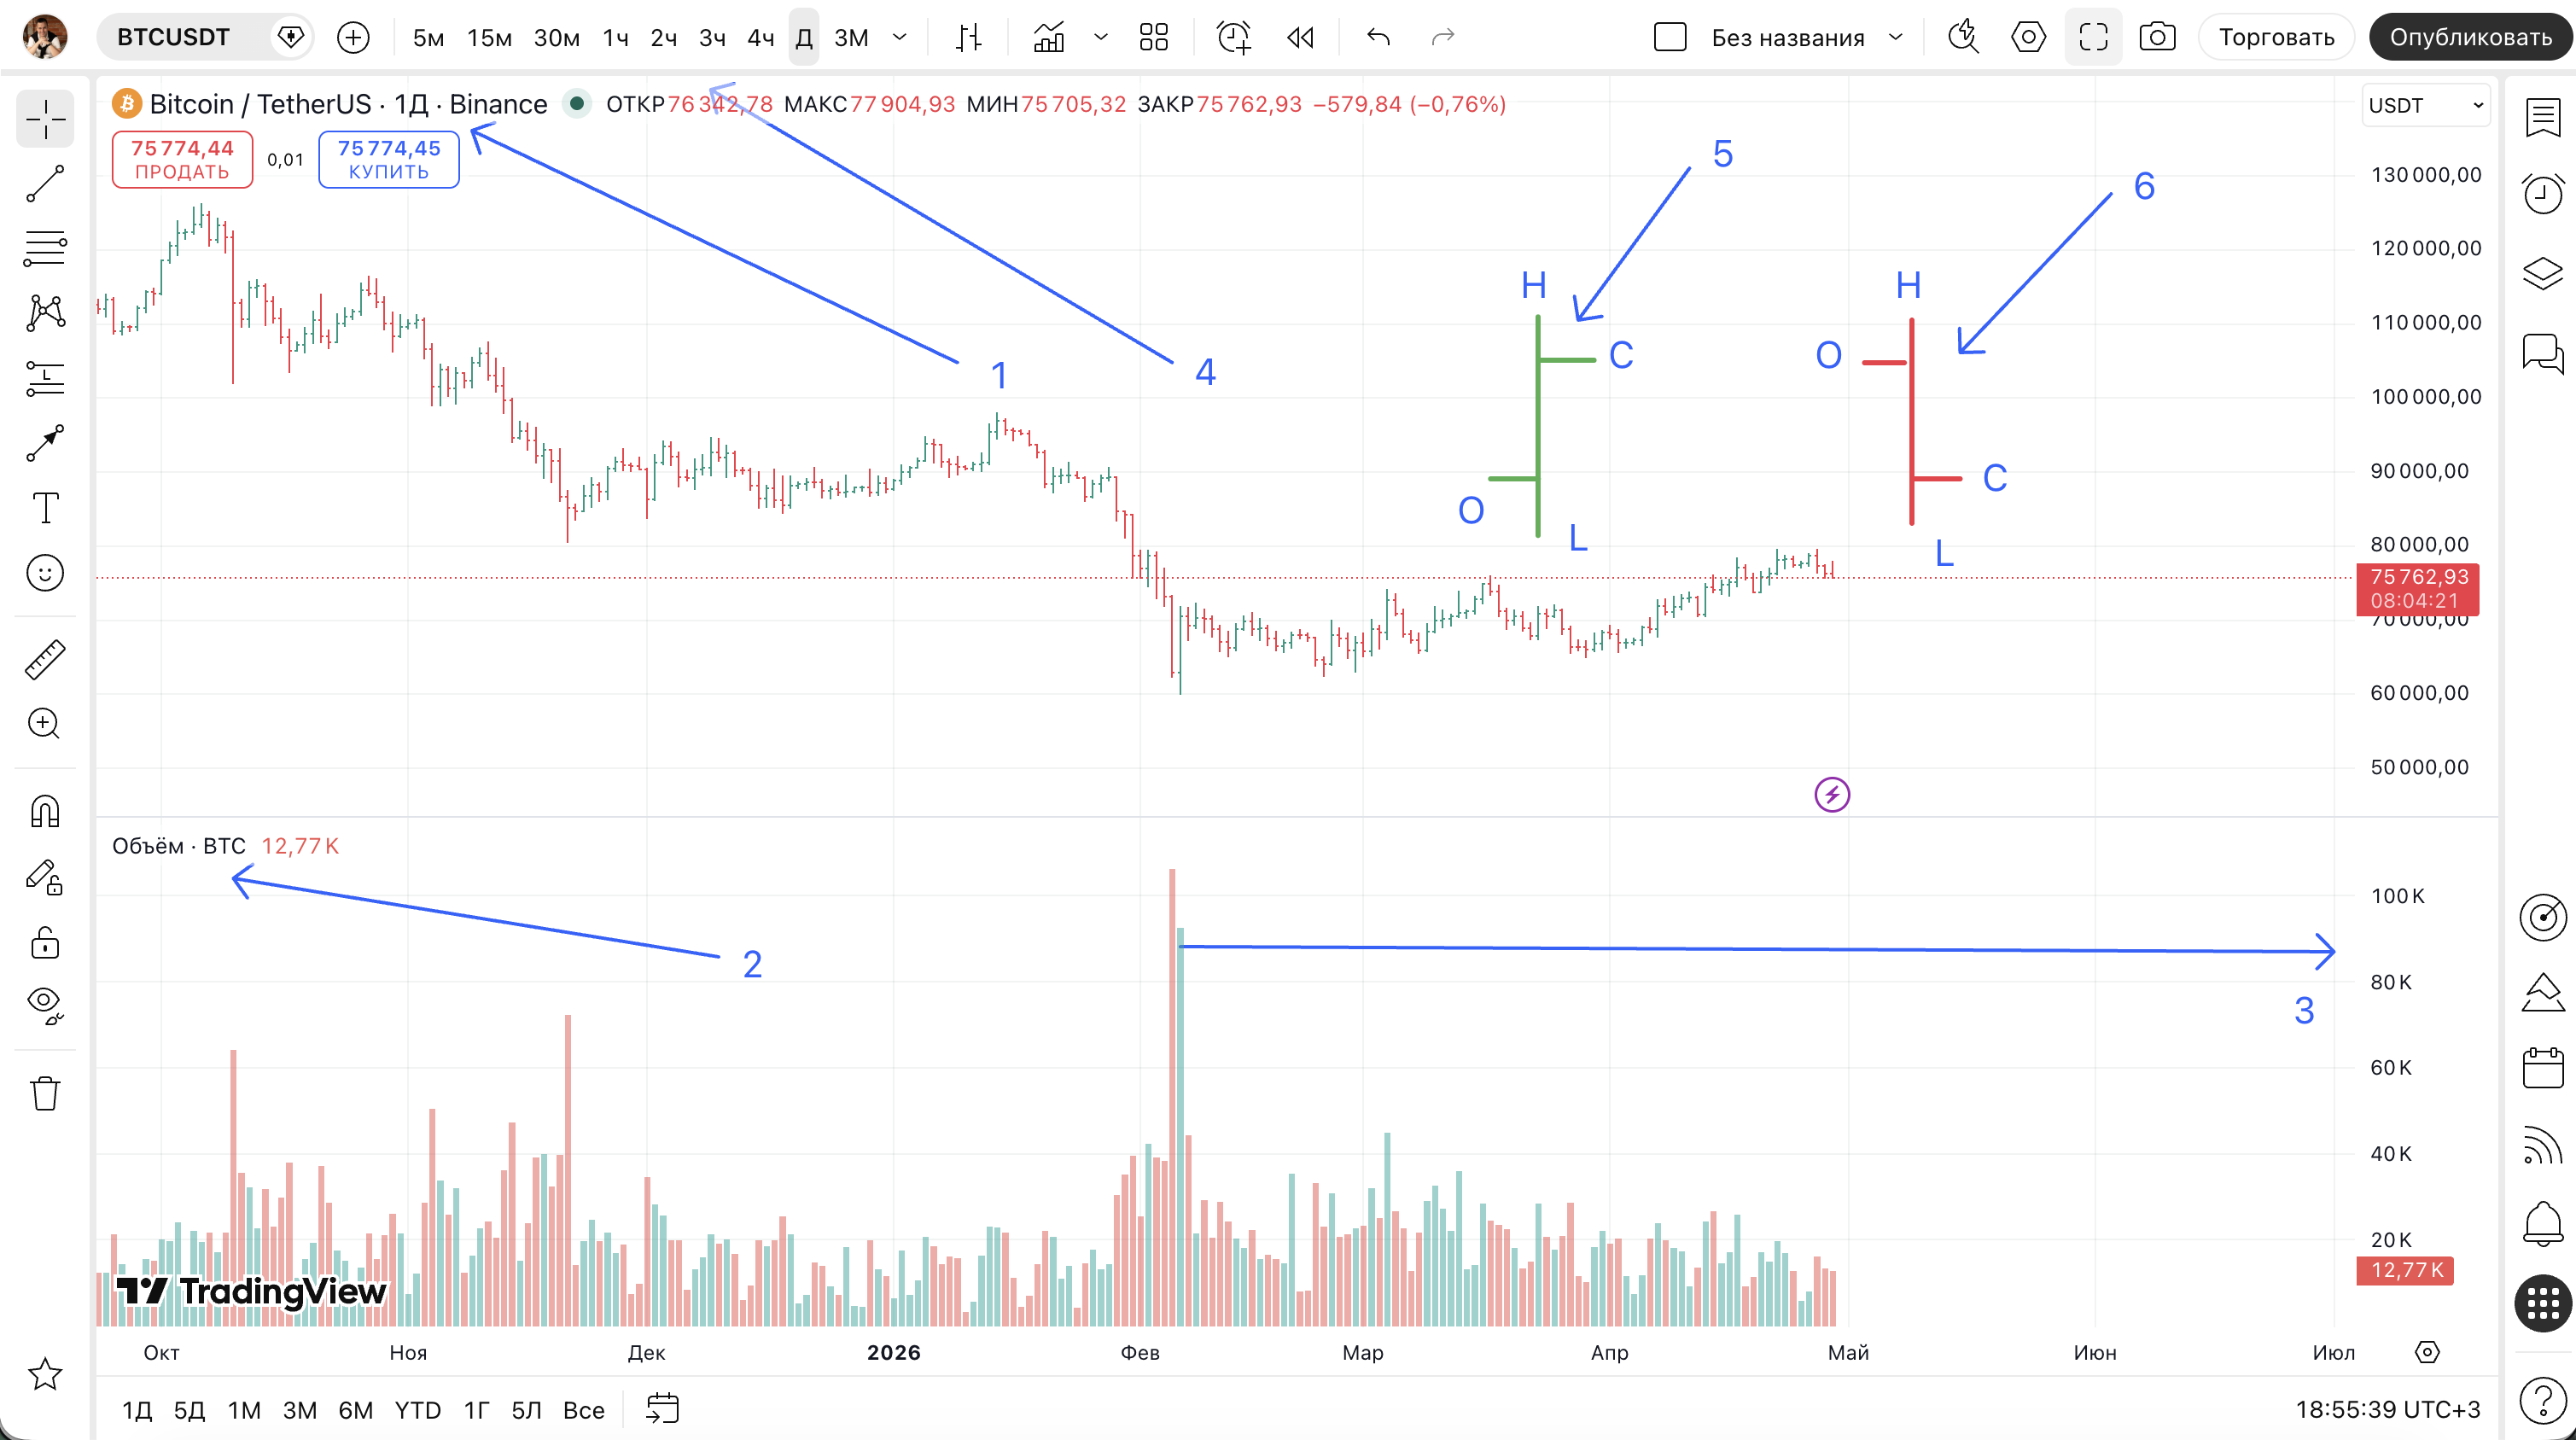
As an example, let us look at the most popular cryptocurrency — Bitcoin. We will see how the trading terminal displays price dynamics and what data we need for market analysis within this course. The chart is annotated with arrows and numbers — let us examine each element.
Instrument Name, Timeframe and Data Source
The upper part of the terminal displays all basic information about the instrument. In our example: Bitcoin/TetherUS · 1D, with the data feed coming from the connected exchange.
- Bitcoin/TetherUS — Bitcoin expressed in US dollar equivalent via the Tether stablecoin
- 1D — each bar on the chart represents 1 day
- Exchange feed — the data source from which price quotes and trade volume are received
At the time of analysis one Bitcoin is worth $75,762 — this is the current price visible on the right side of the price axis.
How to Read Current Instrument Data
The top row of the terminal next to the instrument name always shows four key indicators of the current bar — they update in real time:
- OPEN — the price at the moment the current bar opened
- HIGH — the maximum price reached during the bar's period
- LOW — the minimum price reached during the bar's period
- CLOSE — the last recorded price (for an unclosed bar this is the current market price)
In our example: OPEN 76,342, HIGH 77,904, LOW 75,705, CLOSE 75,762. This means that during the current day Bitcoin opened at $76,342, rose to $77,904, fell to $75,705, and at the time of analysis is trading at $75,762. These four indicators form every bar on the chart.
Bar vs Japanese Candlestick — What is the Difference?
Different terminals can display the same chart differently. The two most common display types are bars and Japanese candlesticks. They are essentially the same thing — both display four identical indicators: open, close, high and low. The difference is purely visual.
A bar displays its body as a vertical line with two horizontal ticks — the left tick is the open price, the right tick is the close price. A Japanese candlestick body is filled with a rectangle — green if the price rose, red if it fell. The thin lines above and below are called "wicks" and show the high and low.
This course uses bars, but if your terminal defaults to candlesticks — that is not a problem. The analysis logic is absolutely identical.
Volume Indicator
The lower supplementary window is the volume indicator. It takes data from the connected exchange and shows the number of trades between buyers and sellers over the selected period — in our case, one day. This is exactly the tool we will use in volume analysis following the Wyckoff method. The scale on the right side of the lower window gives a sense of exchange trading volumes and allows activity comparison across different periods.
Why Switch Timeframes
A timeframe is the time scale of a chart. The same asset looks completely different on different timeframes, but the market structure does not change — only the level of detail changes.
The practical rule is simple:
- Higher timeframe (daily, weekly) — shows the overall market structure, global PCL levels and the direction of the main trend. This is where you determine which direction to trade.
- Lower timeframe (15 minutes, 1 hour) — shows details within the movement, helps find the precise trade entry point and set the stop-loss.
This is why all live examples in this course are shown on the 15-minute timeframe — it provides sufficient detail to see the structure and find entry points. The same logic applies on any other timeframe — from 5 minutes to the daily chart.
Bullish Bar and Bearish Bar
The main workspace displays a bar chart. A bar is the standard way to represent price behavior over a time period. Each bar contains 4 key indicators:
- O (Open) — the opening price
- C (Close) — the closing price
- H (High) — the maximum price for the period
- L (Low) — the minimum price for the period
A bullish bar — a green bar where the closing price is higher than the opening price. This indicates that buyers were more active than sellers during that period.
A bearish bar — a red bar containing the same four indicators as the green one, but with one difference — the closing price is lower than the opening price. This indicates that sellers dominated buyers during that period.
Understanding bar structure is the foundation of technical analysis — all patterns and signals we study in this course are built on the interaction of these four indicators.
From Bars to Waves — How to Read Market Structure
An individual bar on its own provides little information. Real analysis begins when you look not at a single bar but at a sequence of bars — this is how price waves form.
A wave is a series of bars moving in the same direction. Several consecutive rising bars form a wave up; several falling bars form a wave down. The alternation of such waves creates the entire market structure we will analyze.
Look at any chart — you will see that price never moves in a straight line. It moves in waves: impulse up, pullback down, impulse up again. Or the reverse. This is the living breath of the market — the constant interaction of buyers and sellers.
This is why in the sections that follow we will view the market not through individual bars but through schematic examples of waves and structures — range, trend, priority change levels. All of this is built on the same foundation: bars form waves, waves form structure, structure tells us which direction to trade.
The terminal has been mastered and bar structure is understood. Now we open a demo account — this is where you will practice everything you learn going forward, without the risk of losing real money.
What is a Demo Account and How to Open One
A demo account is a virtual trading account with real market data but without real money. You see live quotes, open and close trades — but all results are virtual. This is the only way to practice skills without the risk of capital loss.
Using the TradingView platform as an example, let us look at what a demo account looks like from the inside. Key elements are marked on the screenshot:
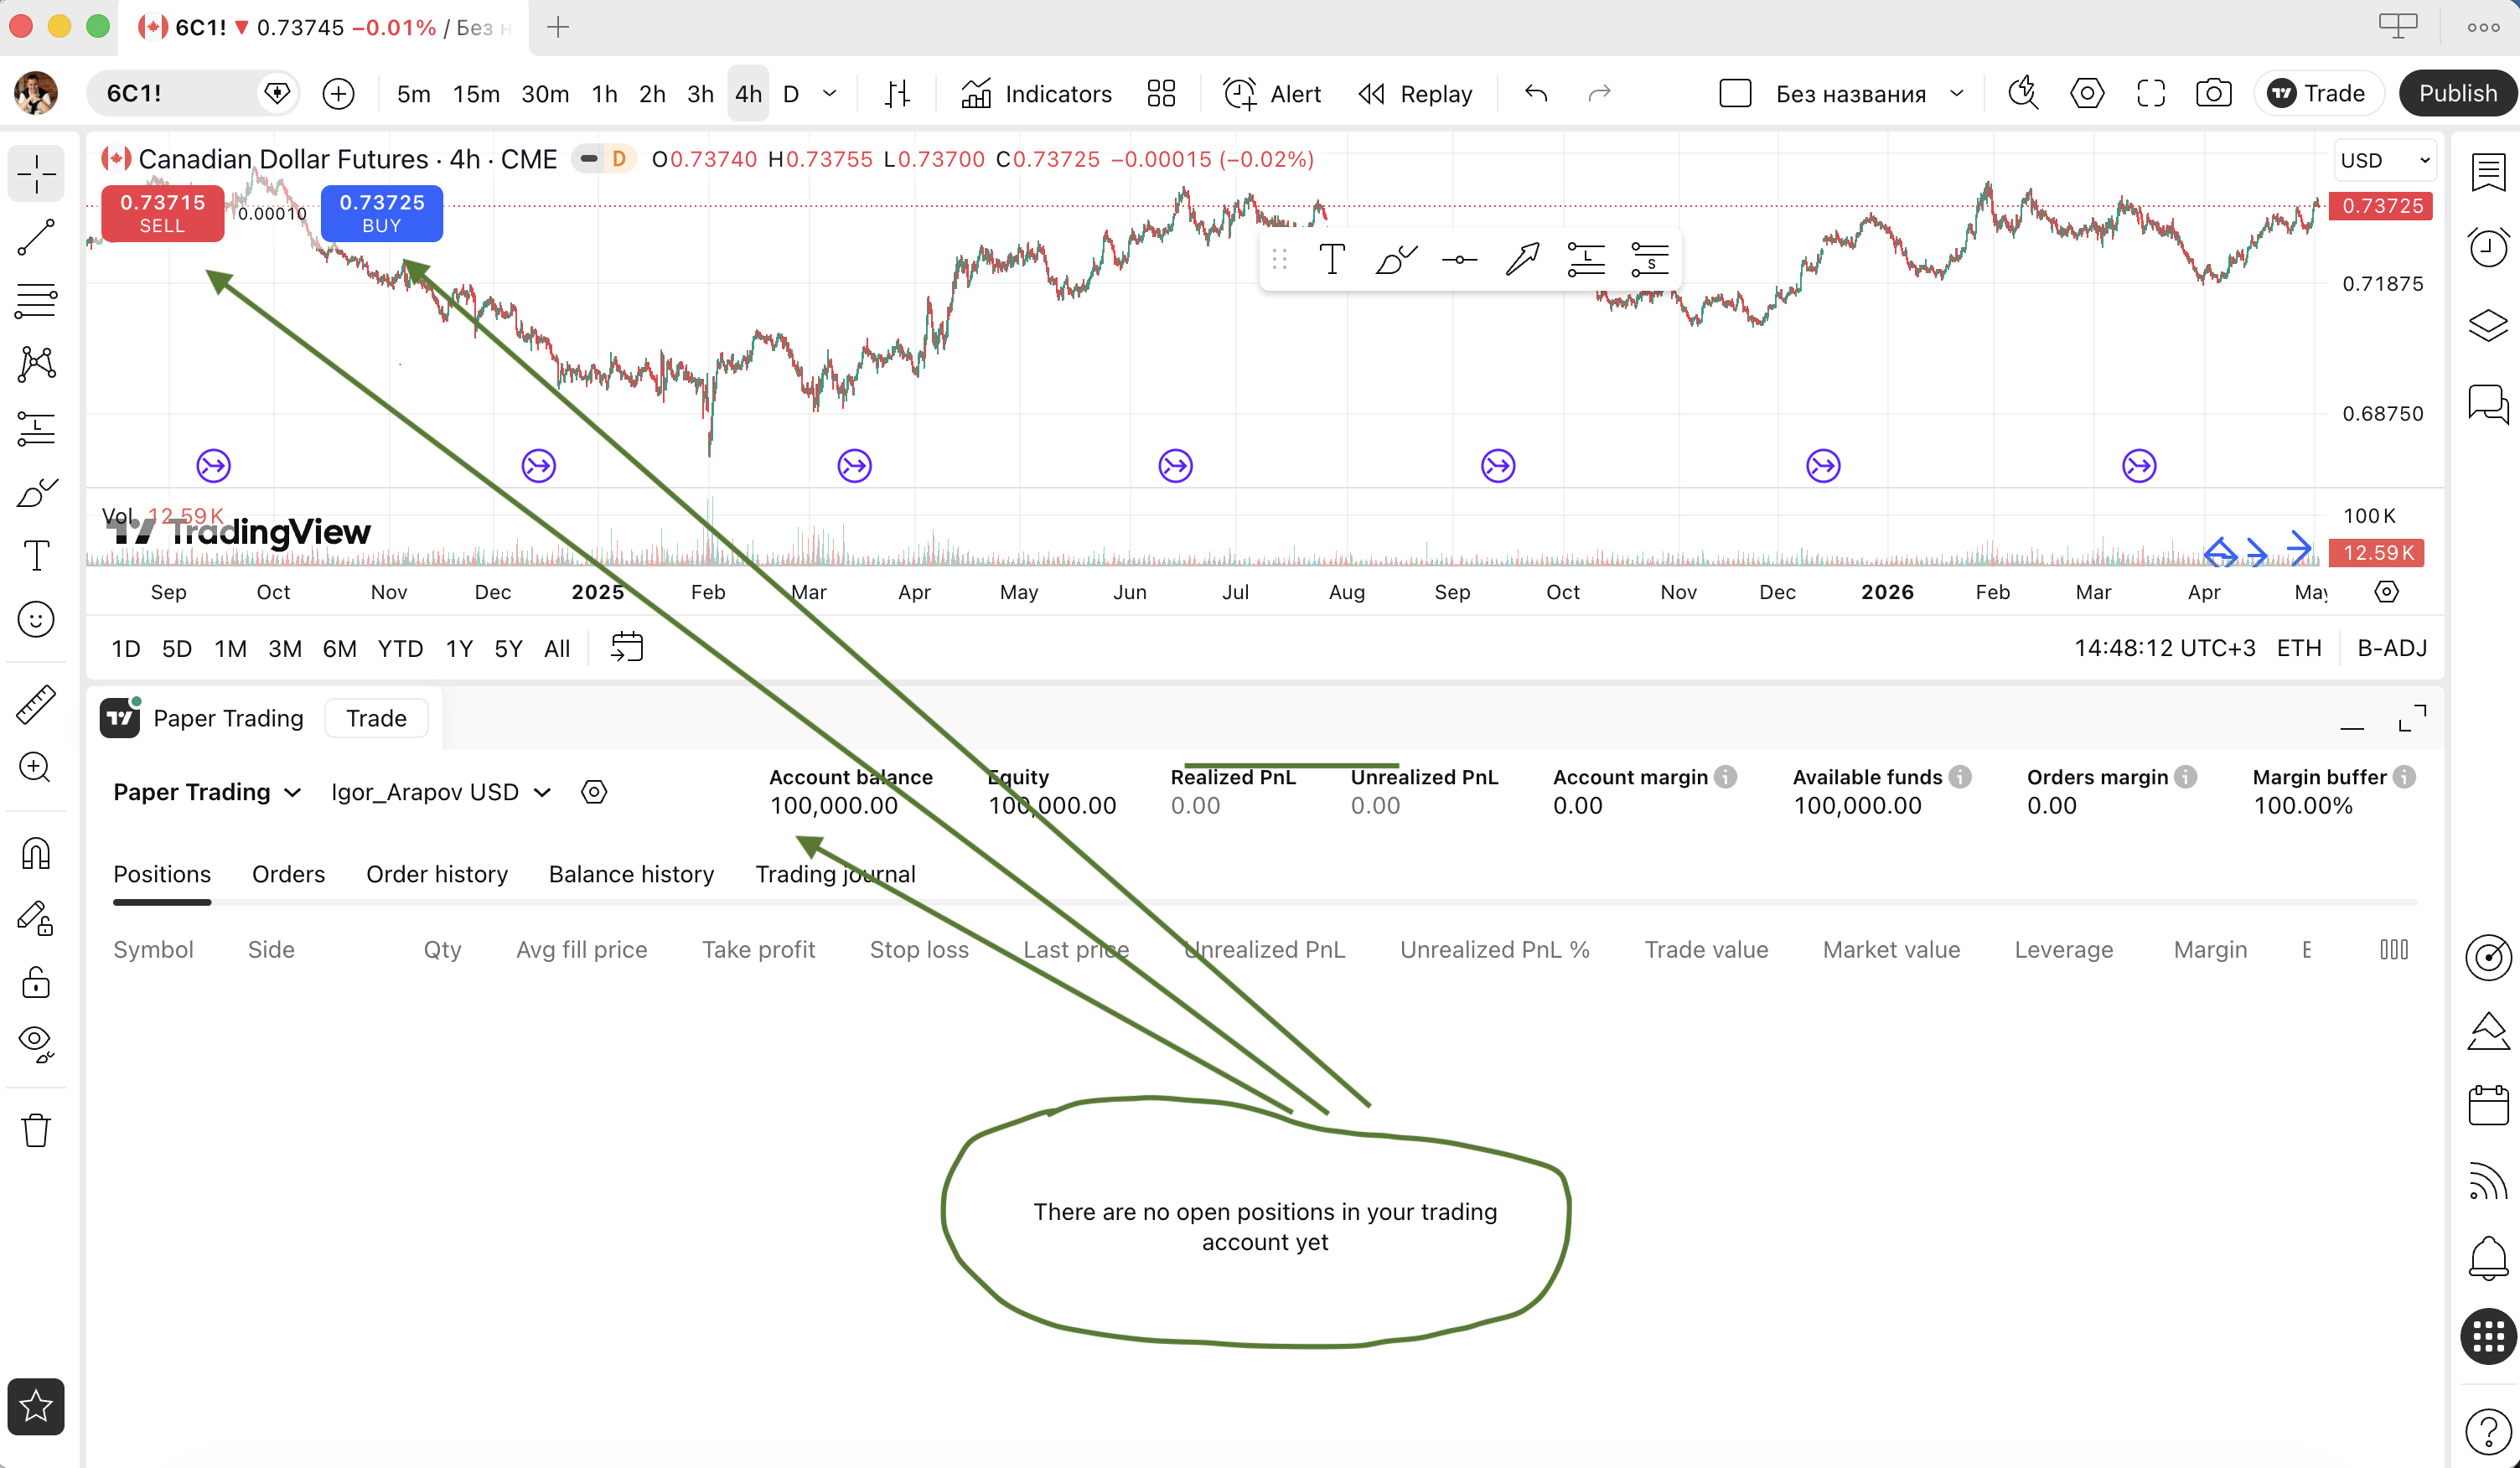
Account balance — when you open a demo account on TradingView, you are automatically credited with $100,000 in virtual funds. This is your starting capital for skill development. You can trade any volume within this amount.
Demo / Trade — there are two buttons at the bottom of the screen. "Demo" is virtual trading mode; "Trade" switches to a live account with a broker. Always work in demo mode at the start.
Positions — all open trades are displayed here. When there are no trades, you see the message "You have no open positions." After the first trade, all information appears here: instrument, direction, volume, take-profit, stop-loss, current result.
How to open a demo account on TradingView:
- Go to TradingView
- Register a free account
- Open any chart
- Click the "Paper Trading" button at the bottom of the screen
- Virtual capital is credited automatically — you can start trading immediately
Demo account with a broker — in addition to TradingView, virtually every broker provides their own demo account for free. This is convenient if you have already chosen the broker through whom you plan to trade with real money — it is better to practice skills on the same platform and with the same instruments you will use in live trading. As a rule, opening a demo account with a broker simply requires registering on their website and selecting "demo" as the account type — no documents or real money required.
A demo account is completely free everywhere. Real quotes, real order execution — only the money is virtual. This is where you will practice all the methods from this course until you accumulate 100 trades with a positive mathematical expectation.
The demo account is open. Before placing your first trade, you need to understand the basic mechanics: what is a spread, a lot, and in which direction you can trade.
Trading Basics: Spread, Lot, Long and Short
What is a Spread and Commission
The terminal is open and the demo account is ready. Before placing your first trade, you need to understand three basic concepts: how much does entering the market cost (spread), in what units is volume measured (lot), and in which direction can you trade (long and short).
When you open your first trade on a demo account, you notice that the position immediately shows a small loss. This is not an error or a loss — it is the spread.
The spread is the difference between the buy price and the sell price of an asset. Look at any terminal — there are always two prices: "Buy" and "Sell." They differ slightly. This difference is the spread — it is what you "pay" at the moment you enter a trade.
Simple example: the buy price for euro is 1.0850, the sell price is 1.0848. Spread — 2 points. The moment you opened the position, your account decreased by the cost of those 2 points. This is why the trade is immediately in the red — you have not yet earned enough to cover the spread.
In addition to the spread, brokers charge a commission — a fixed fee for opening and closing a trade. Some brokers work only through the spread; others charge commission separately. Always clarify these terms before choosing a broker — over hundreds of trades, the difference in spread and commission significantly impacts the final result.
What is a Lot in Trading
A lot is the standard unit for measuring trade volume. When you open a position, you specify a number of lots rather than a dollar amount.
A standard lot in forex is 100,000 units of the base currency. This sounds intimidating, but leverage and fractional lots exist precisely for this reason. In practice, beginners trade micro lots:
- 1 lot = 100,000 units
- 0.1 lot = 10,000 units (mini lot)
- 0.01 lot = 1,000 units (micro lot)
Futures are simpler — one lot equals one contract. The value of one point of movement depends on the instrument. This is why in the position sizing section I used the example of $10 per point per contract — these are the actual parameters of the Euro futures on the CME exchange.
The rule for beginners is simple: start with minimum volume. On a demo account this does not matter, but the habit of trading small volume will protect you from large losses when you transition to a live account.
Long and Short Positions
One of the first questions a beginner asks is: how can you sell something you do not own? That is exactly what a short is.
A long position — buying an asset in anticipation of a price rise. You bought low and sold high — the difference is your profit. This is intuitive.
A short position — selling an asset in anticipation of a price decline. The mechanics: the broker lends you the asset, you sell it at the current price, the price falls, you buy it back cheaper and return it to the broker. The difference is your profit.
Simple example: the euro is at 1.0850. You open a short — you sell euros you do not own. The price falls to 1.0800. You close the position — you buy back euros at 1.0800 and return them to the broker. Profit — 50 points.
This is why a trader can profit from both rising and falling markets. When the market is in a downtrend, we open shorts from resistance levels. When it is in an uptrend, we open longs from support levels. This is the same logic we cover in the market phases section.
What is Leverage in Trading
Before opening a live account with a broker, you need to fully understand how leverage works — there are important nuances to its use.
Leverage is the ability to trade a volume larger than what you have in your account. For example, with 1:10 leverage and $1,000 you can open a position worth $10,000. This sounds appealing — profit multiplies by 10. But so does the loss.
This is where most beginners lose their account. The logic is simple — the higher the leverage, the smaller the market move against you needed to wipe out your account. With 1:100 leverage, a 1% move against your position is enough to lose your account entirely.
Another important point — margin call. This is the situation where the broker forcibly closes your positions because there are insufficient funds to maintain the open position. This happens automatically without your involvement — and usually at the worst possible moment.
My recommendation for beginners: at the start use minimum leverage or trade without it at all. Your task on the demo account and at the beginning of live trading is to refine the system and understand how the market works. Leverage is a tool for experienced traders who already have a stable system and an understanding of risk.
Remember — professional market participants never risk more than 1–2% of capital in a single trade precisely because they understand how quickly everything can be lost with aggressive use of leverage.
The mechanics of trading are now clear. Now we move to the main subject — how to read the market and determine which direction to open trades. This is the domain of technical analysis.
Technical Analysis of the Market
The trading mechanics are clear — spread, lot, leverage, position direction. Now the main question: how do you determine which direction to open trades? The answer comes from technical analysis — the tool for reading market structure.
Technical analysis of the market — the primary tool you will use to forecast the market. The market does not move randomly — every movement follows a certain logic and passes through repeating phases. Understanding these phases is the foundation for determining trade entry points.
Market Phases: Trend and Range
In the market you will constantly observe two repeating phases — sideways movement (range) or directional movement (trend). Understanding which phase the market is currently in is critical, as your strategy for opening positions depends on it.
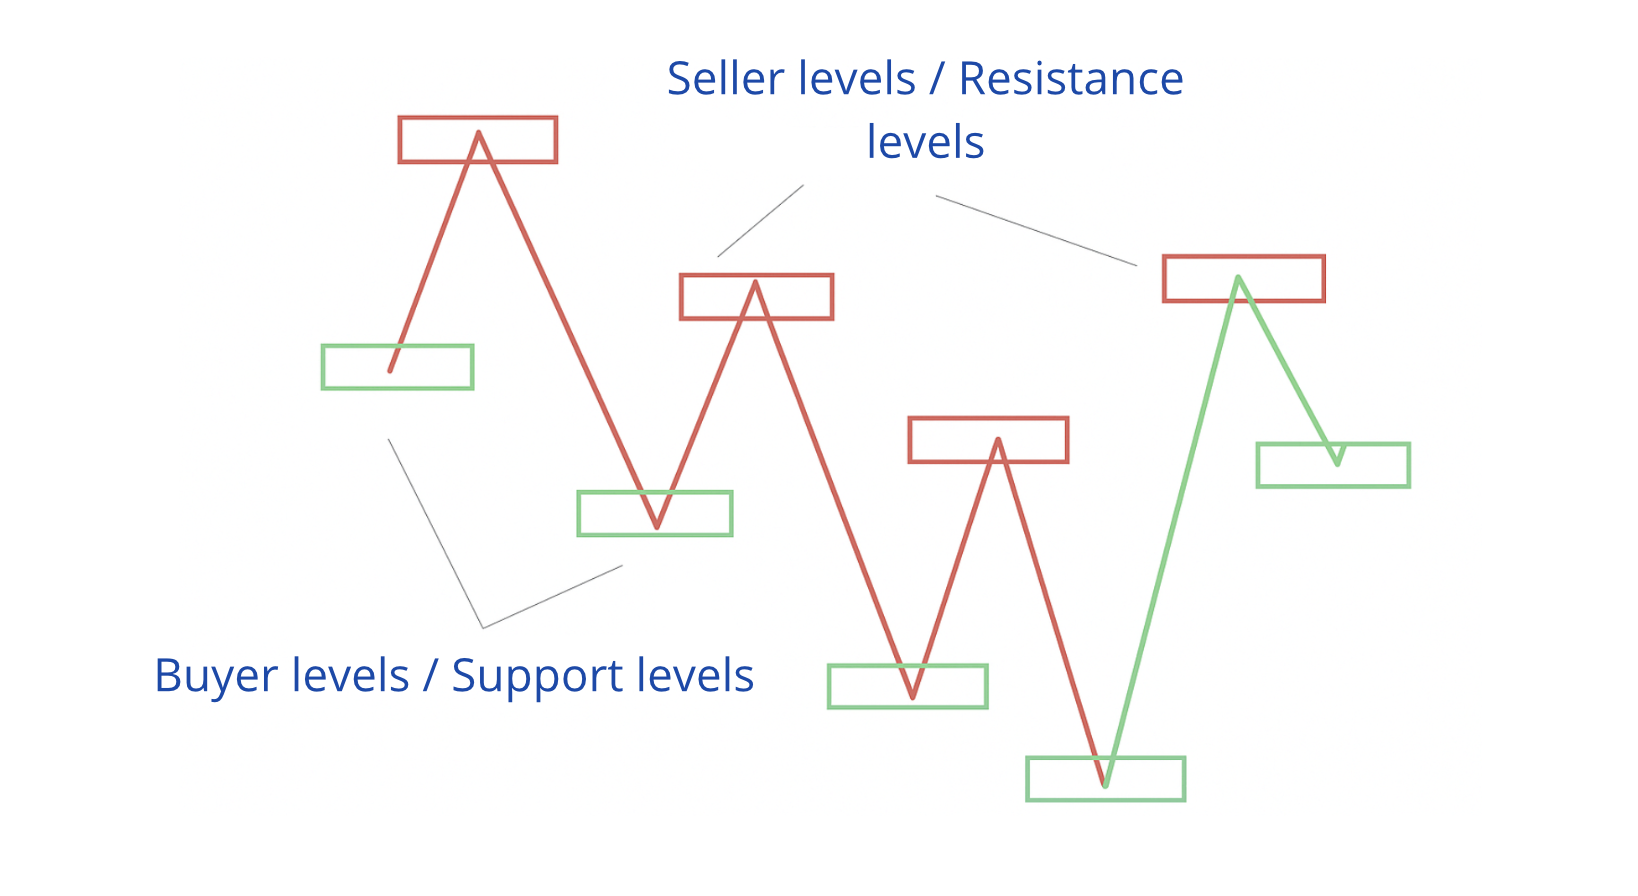
A range — sideways market movement with clearly defined boundaries. Sometimes price can breach these boundaries slightly (creating false level breaks), but schematically it remains within the obvious range.
Special attention is paid to the range boundaries, because they define the "support and resistance levels." The upper boundary is called the "resistance level" and the lower is called the "support level." Below is a schematic example of a range with its boundaries.

A trend — directional price movement characterized by a fast price change in the trend direction and a slow one in the pullback phase. The best trading opportunities form when there is a trend, because you move with the flow and get maximum efficiency from your trades.
Two main types of trends:
- Downtrend (bearish) — a sequential lowering of highs and lows. Each new peak and trough is lower than the previous one.
- Uptrend (bullish) — a sequential raising of local highs and lows: each new peak is higher than the previous one.
As already noted, the trader's task is to determine which phase the market is in, because this dictates the strategy. In a downtrend the trader opens sells from resistance levels; in an uptrend the trader buys from support levels. We will determine the active market phase using priority change levels (PCL), which show who is in control of the market at any given moment: buyers or sellers.
Priority Change Levels (PCL)
A Priority Change Level (PCL) — a dynamic zone on the chart from which an impulse move begins (a wave of buying or selling) that leads to an update of price extremes.
This level indicates the potential activity and strength of the side currently dominating the market — whether buyers or sellers. Our primary objective is to identify who holds the initiative and join that initiative.
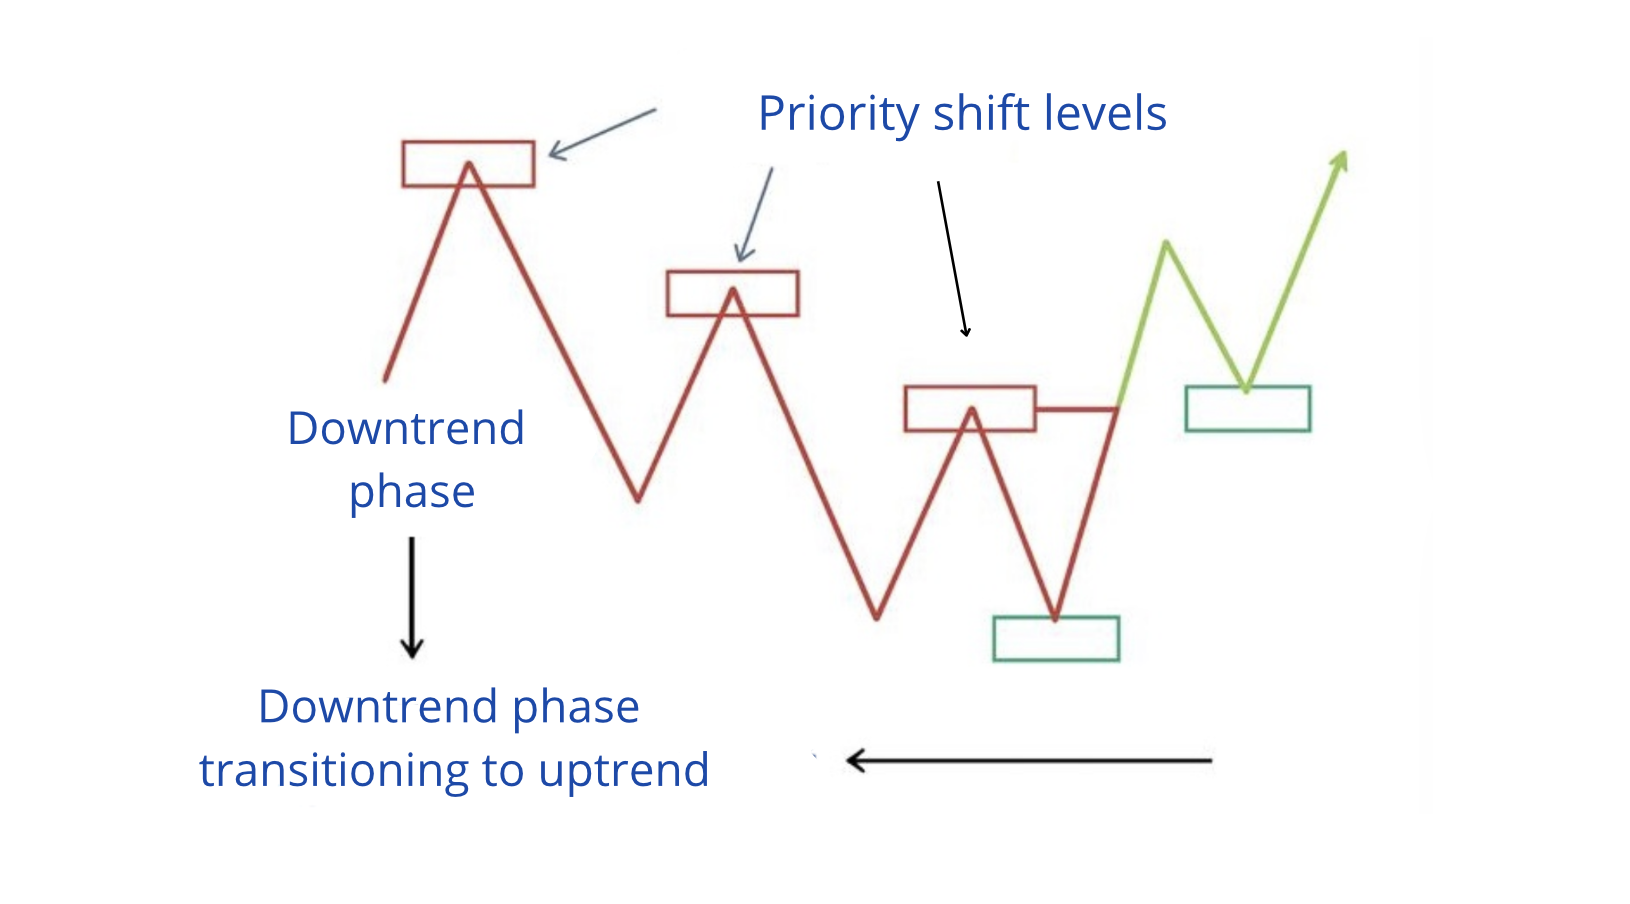
The schematic example shows how PCLs form in a downtrend and what needs to be observed before it transitions to an uptrend. For us, PCL levels are beacons that signal when the current trend has either paused or become irrelevant and a new trend has begun.
A PCL also forms in areas of price consolidation (position accumulation). This area is defined by a level with three or more price touches.
Let's examine a live chart where we have marked the key PCL levels using the EUR/USD currency pair as an example.
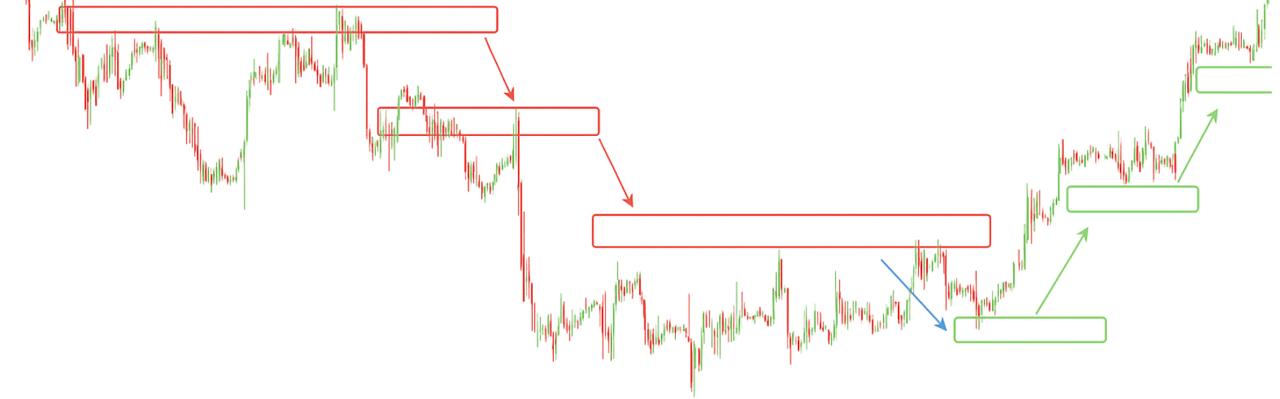
Every time price updated its low, we marked a resistance level, which in turn told us about the bearish tendency in the market. In our example, before the trend changed, a range formed with fairly clear boundaries. After the price exited that range, a rising bullish price structure began to form. It is very important to remember: as long as the market itself has not changed its current market structure to a new one, we do not forecast that it will happen! The trader's task is not to fantasize about future price movement, but only to react to objective reality!
While the bearish structure was in place, we could open sell positions from resistance levels. Once the market rewrote the structure — we no longer open sells, but work only from buy positions at support levels within the new bullish structure.
PCL levels have been marked on the chart. The next step is to learn how to recognize when the current trend ends and a new one begins: reversal patterns.
Reversal Patterns in Technical Analysis
We have analyzed market phases — trend and range — and learned to identify them through PCL levels. The next step: learning to recognize when the active trend is ending and the structure is reversing in the opposite direction.
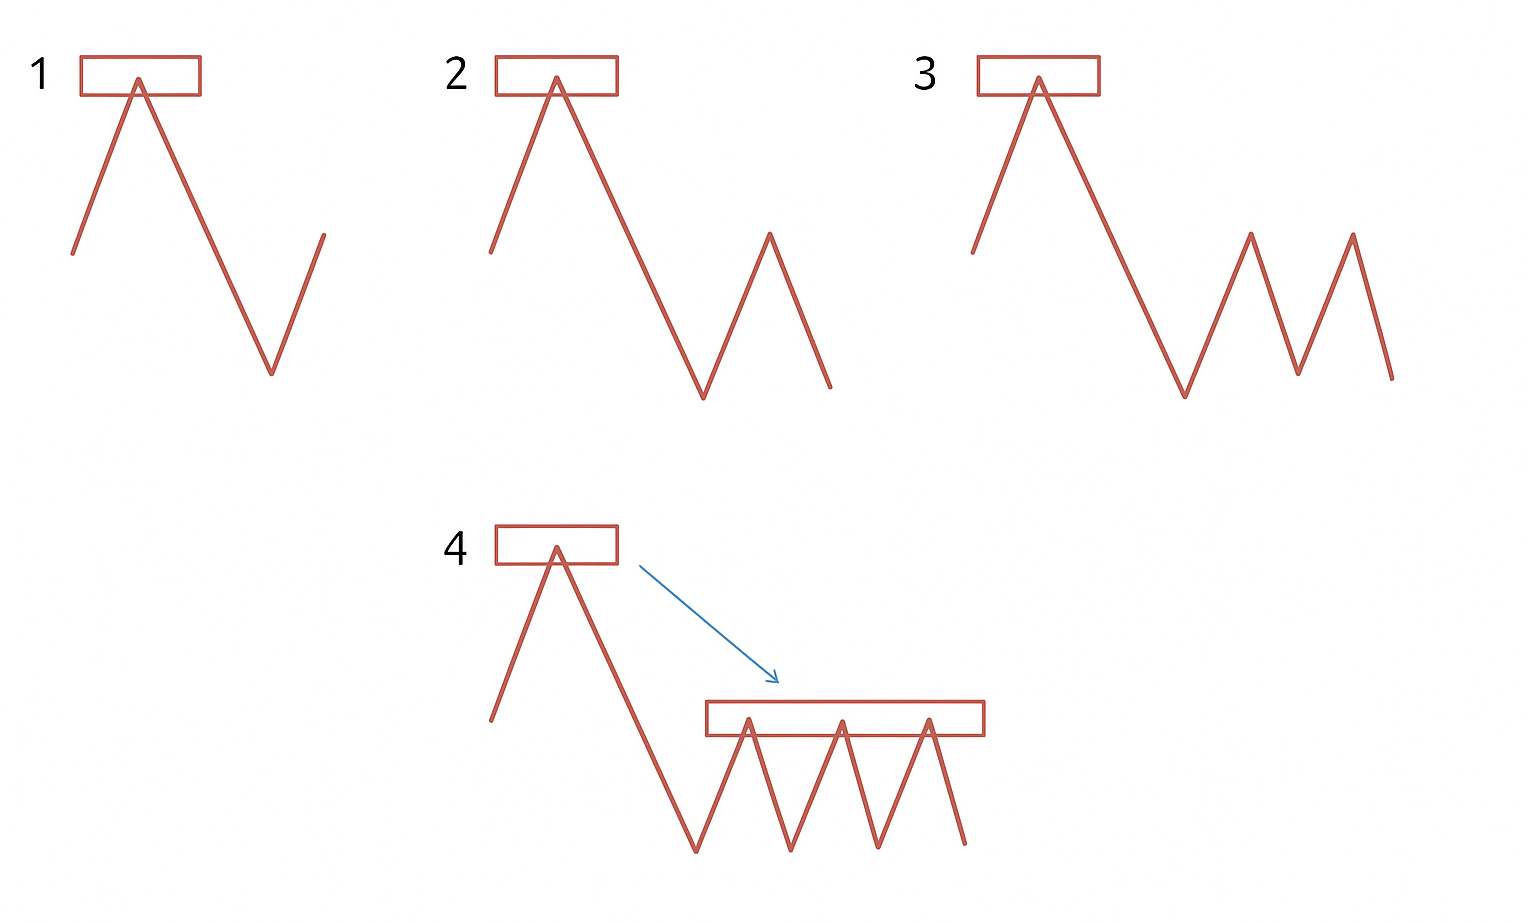
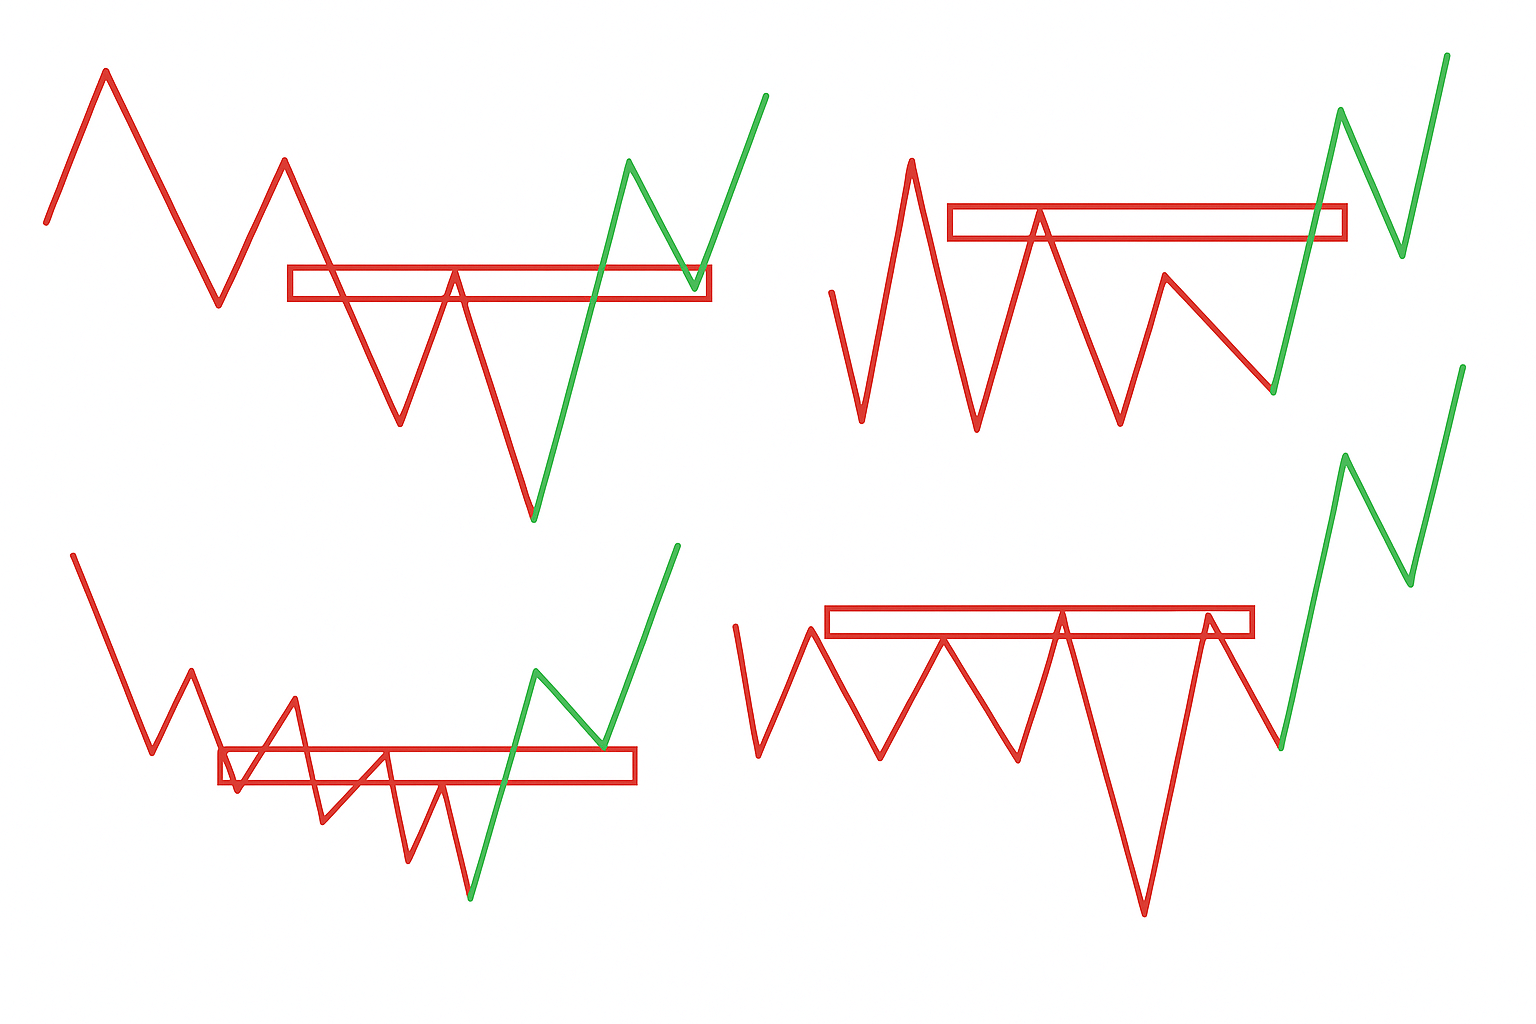
Below we will look at the main types of reversal patterns found on charts. The core idea of these schemes is to show how "resistance" gradually transitions to "support" and buyers take control of the market. This is the key principle of technical analysis when working with levels.
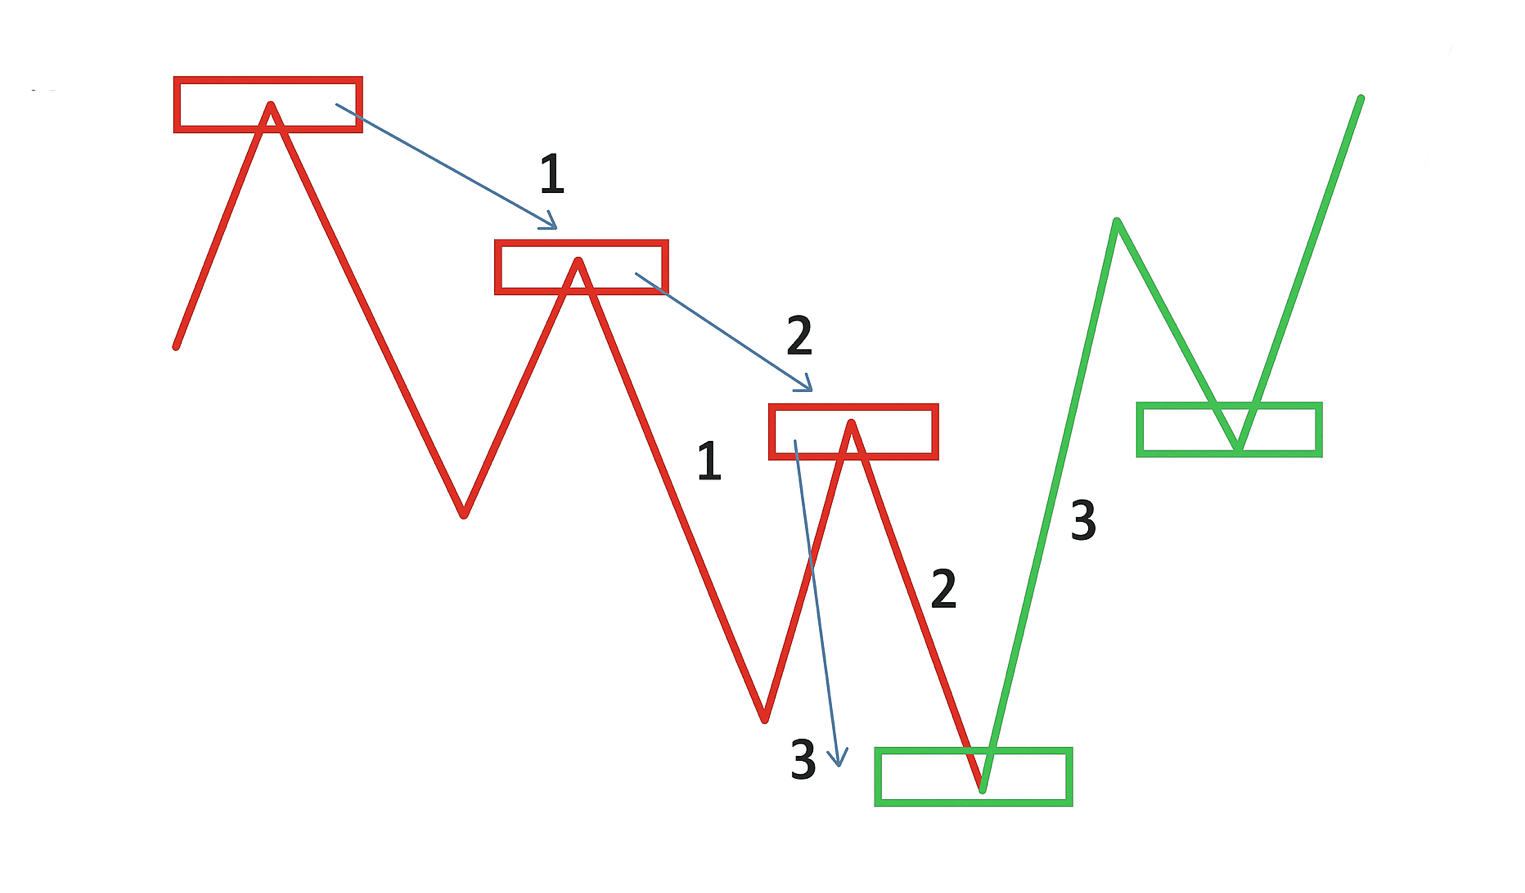
In this example we can see how on a bearish market (Wave 1-2-3) lows were being updated with PCL formation. Wave 1-2 shows the inability to update the low of wave 2-3 — often characterized on charts as a false breakout — after which price breaks the PCL "2" and forms a new bullish structure.
Most often before a trend change we see a range forming, as in the live example above or the schematic example below, but this does not change the essence — only a break of the active trend's PCL gives us reason to speak of a change in the balance of supply and demand.
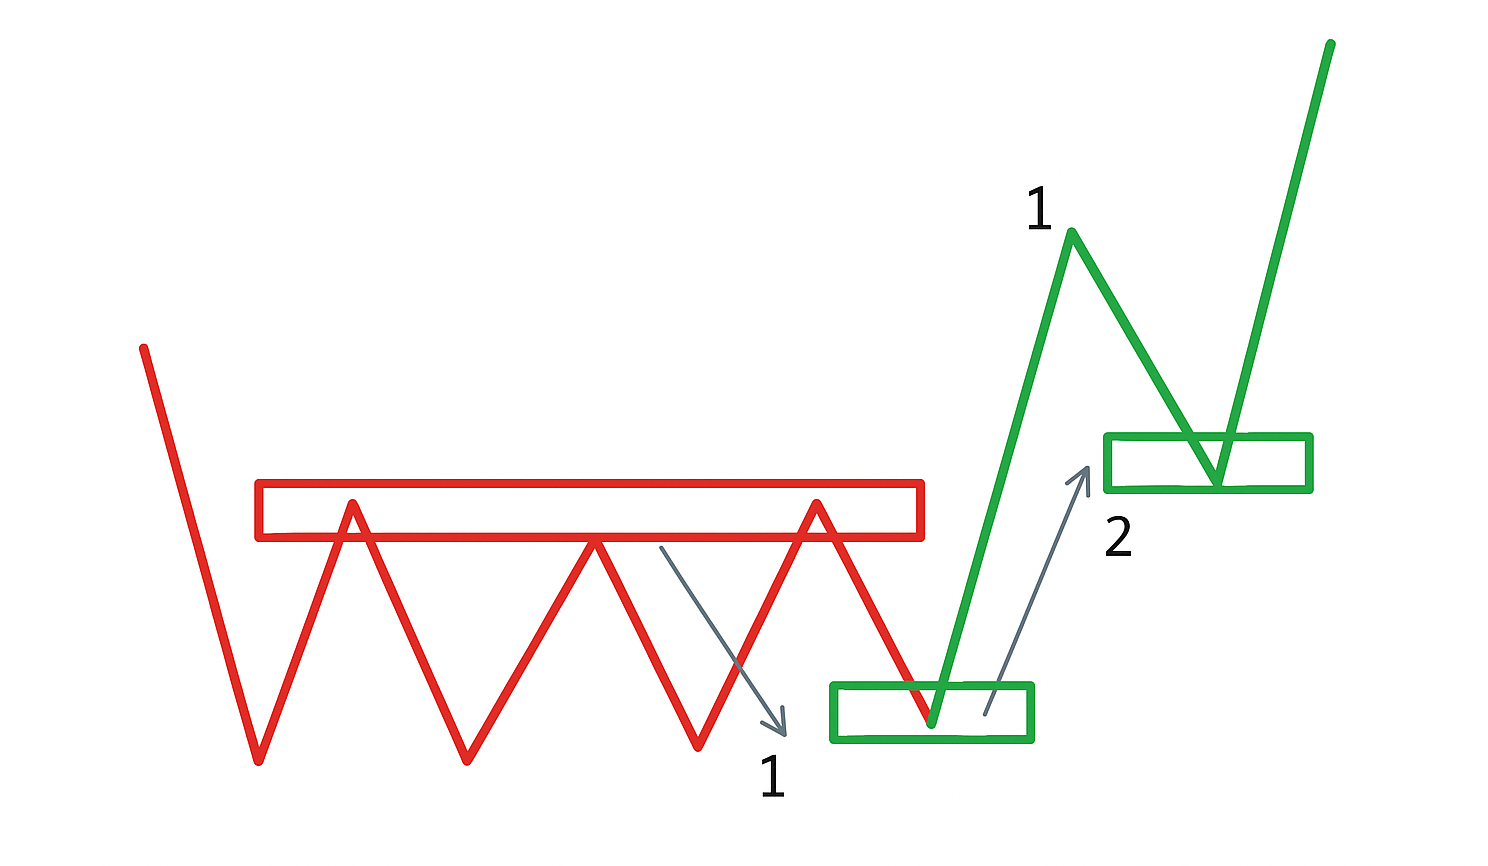
In the schematic example we see how the market breaks the resistance level and consolidates, forming support and a bullish price movement structure. The schematic examples of trend changes with possible formations are shown below. It is important to remember that on the market these can be found in completely different forms, but the structure will not change! Before every change of the active trend we will always observe a break of the active PCL with the formation of a new trend.
Key takeaway: The market itself tells you which phase it is in — all you need to do is carefully read the information about active levels and react when they change.
How to Determine Trend Strength
Trend waves must display signs of strength and be aggressive (fast, impulsive) and longer than pullback waves! Pullback waves must display weakness. Sometimes pullback waves can be flat (balance-like, "range-like").
Weakening of trend waves and strengthening of counter-trend waves is one of the signs of a weak trend that is close to a reversal or balance, but it is not a signal to change direction.
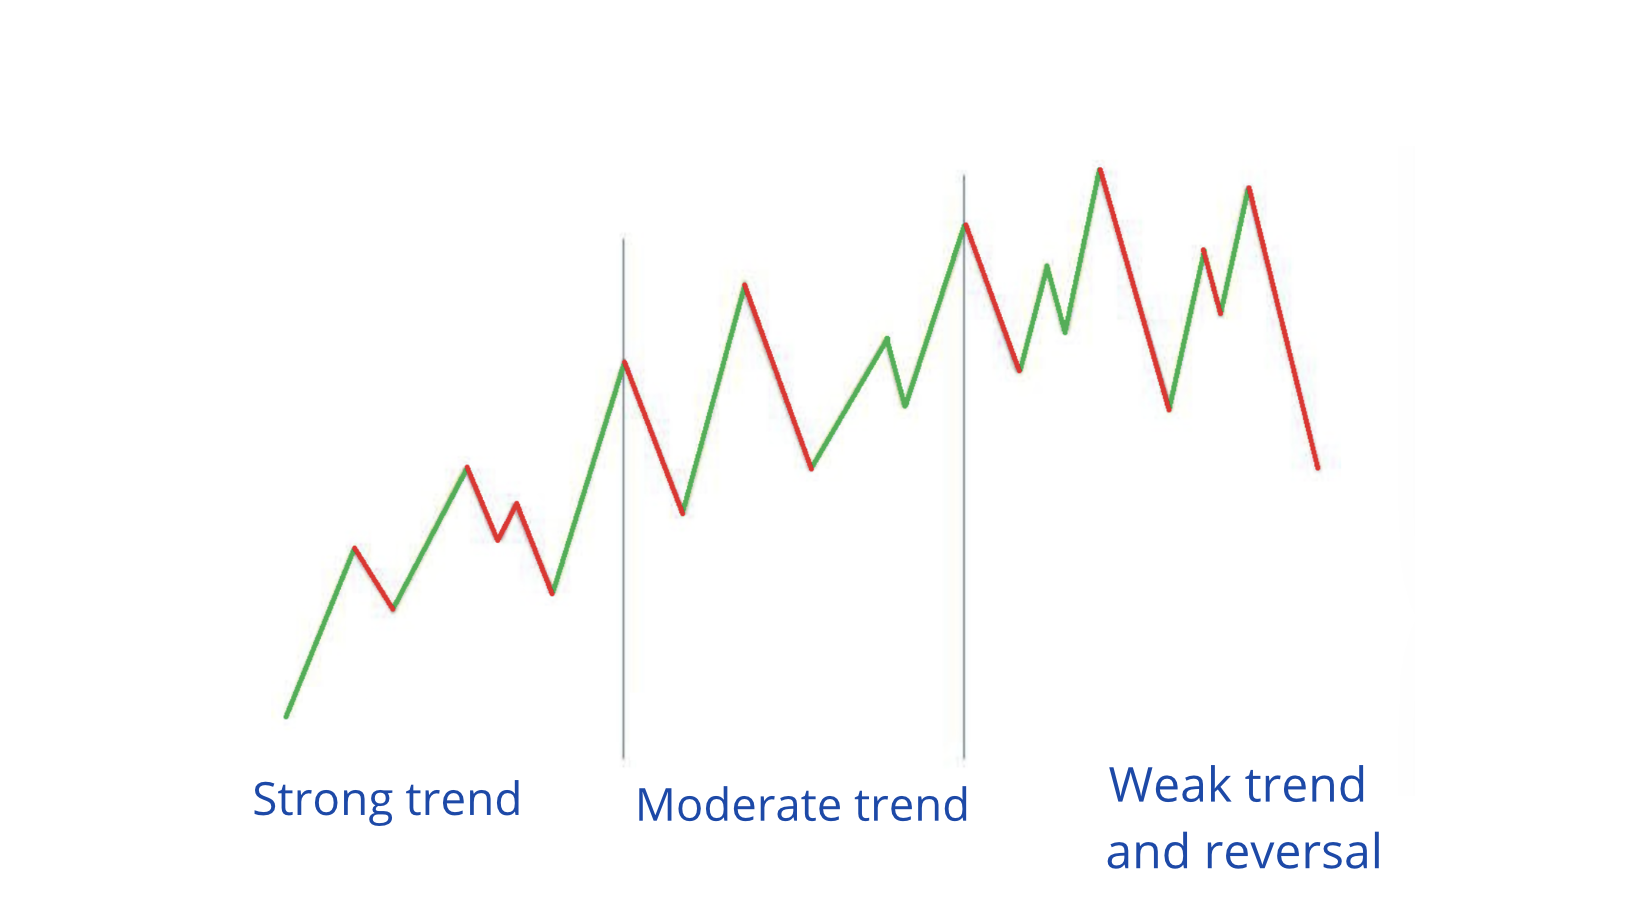
No matter how strongly the chart seems to be telling you it "wants to reverse" — you cannot react to that until the structure itself has changed. PCL levels are the key points for determining a change in the active trend.
We have covered what a trend looks like structurally — impulse waves, pullbacks, weakening. But structure alone does not answer the main question: who is behind this movement? This is exactly where technical analysis ends and volume analysis begins — the tool that lets you see not just the form of a movement but the real balance of forces between buyers and sellers through exchange trade data.
Volume Analysis of the Market
The trend structure and signs of its weakening are now understood. But technical analysis only describes the form of price movement — it does not answer who is behind it. This is where volume analysis comes in: the tool that lets you see the real balance of forces between buyers and sellers.
Volume analysis of the market — a method of reading and forecasting the market through data on the number of trades made between buyers and sellers.
In volume analysis we look for traces of professional market participants in order to understand which direction they are accumulating or distributing their positions. Since these participants trade large volumes they cannot go unnoticed.
Key aspects of analysis:
- Elevated volume activity — large volumes, spikes, clusters. This generally means professionals are very active and executing trades. It is a clearly visible vertical volume spike that stands out even without additional indicators.
- Reduced activity — indicates a lack of interest from professionals and often precedes sharp movements after a period of quiet, usually after a position has already been built.
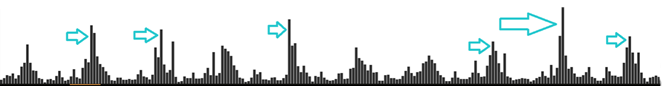
The example shows the "Volume" indicator, which displays the number of trades executed over a specific time interval based on the selected timeframe. The "skyscrapers" on this indicator are easy to spot — they signal one thing only: active trading among the largest market participants. Later we will study the Wyckoff method, which covers in detail the behavior patterns of professional capital and how to interpret these spikes of professional activity.
Volume shows the activity of professionals. To understand exactly how they act — we need to understand the mechanics of orders: it is orders that create the levels and volume spikes we see on the chart.
Types of Exchange Orders
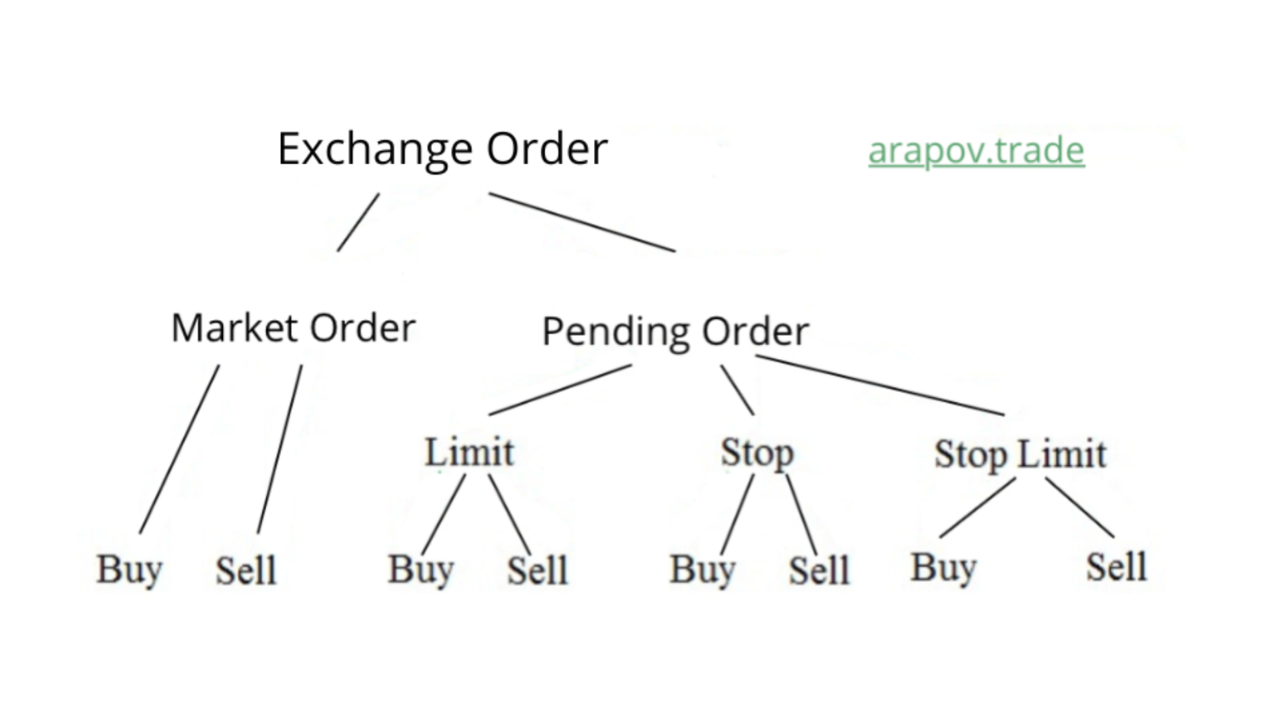
An order is an instruction to the broker to buy or sell an asset. All orders fall into two main types: market and pending.
Market Order
A market order is executed immediately at the current market price. Two types:
- Buy — purchase at the current price
- Sell — sell at the current price
Advantage — instant execution. Disadvantage — the price may differ from expected due to slippage, especially during major news releases when the order book thins out.
Pending Order
A pending order is only executed when price reaches a specified level. Three categories:
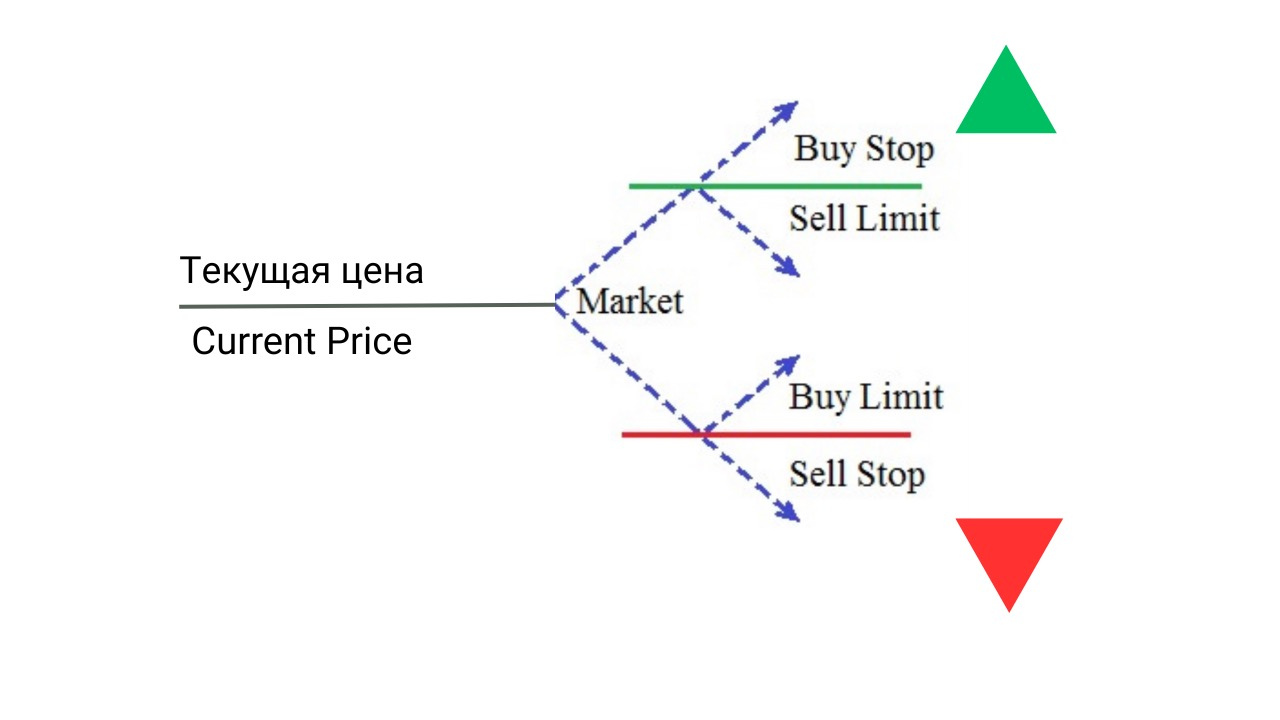
Limit:
- Buy Limit — buy below the current price. Used when the trader expects price to first dip to the required level before moving up.
- Sell Limit — sell above the current price. Used when the trader expects price to rise to a resistance level and reverse downward.
Stop:
- Buy Stop — buy above the current price. Used to enter in the direction of the impulse when a resistance level breaks. This is the order type that triggers when price breaks a PCL upward.
- Sell Stop — sell below the current price. Used to enter in the direction of the impulse when a support level breaks. This is the order type that triggers when price breaks a PCL downward.
Stop Limit:
- Buy Stop Limit — a combined order: activates as a Stop above the market, executes as a Limit. Provides control over the execution price when a level breaks.
- Sell Stop Limit — the same, but for selling below the market.
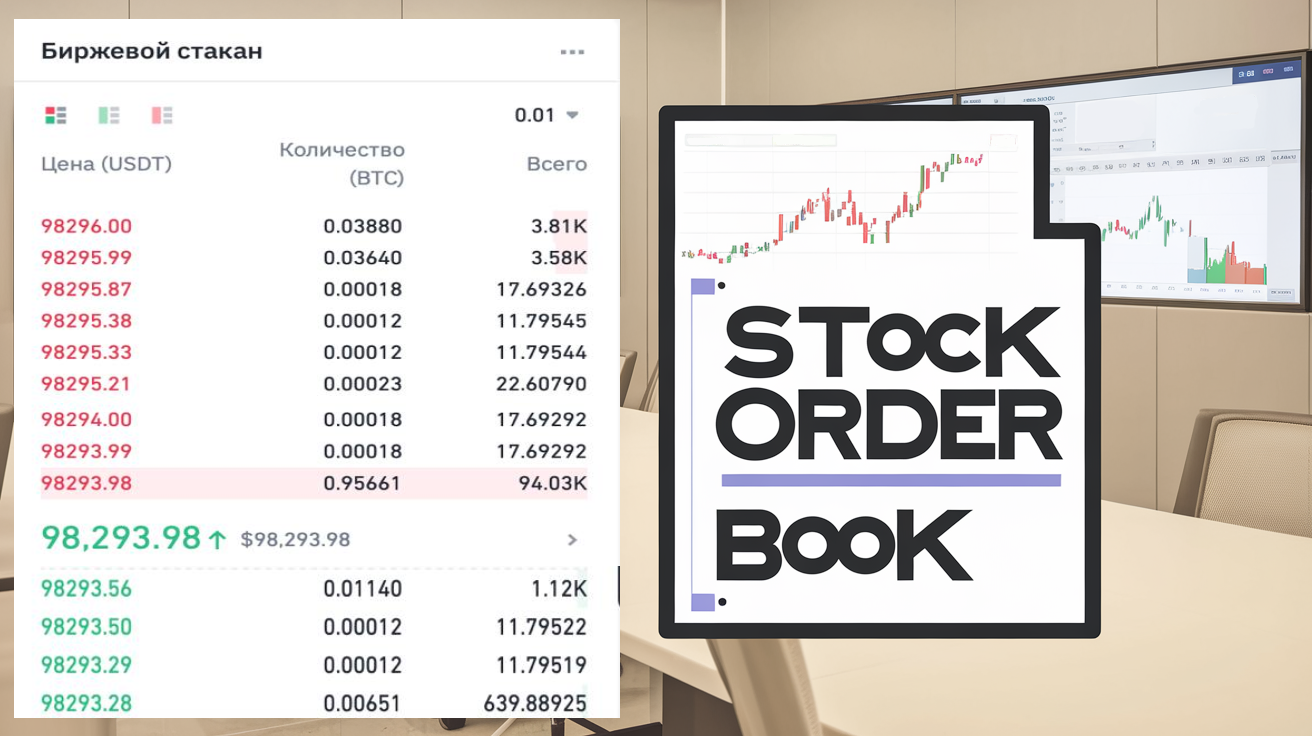
The Order Book — How Pending Orders Look
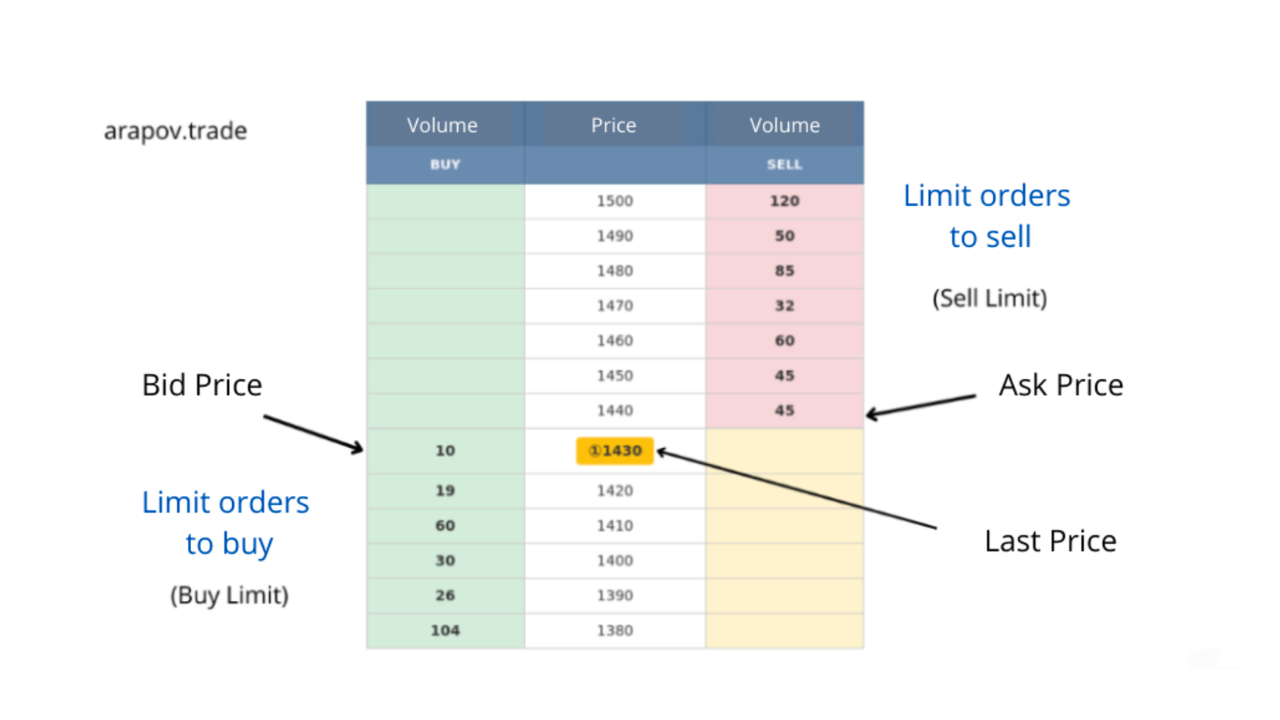
Bid price — the best buy price: the maximum price buyers are willing to pay right now. Ask price — the best sell price: the minimum price sellers are willing to accept. The difference between Bid and Ask is the spread. Last price — the price of the most recently completed trade.
The key thing to understand schematically: pending orders act as a "barrier" to price movement in either direction.
Example of How Market Orders Affect Price
Looking at this picture it is immediately clear that limit buyers are preventing price from moving downward, while limit sellers are preventing price from moving upward. On this logic we will build the next principle for working with levels and market liquidity.
Now that the mechanics of orders are understood, let us apply them to the real market. It is precisely the interaction of large capital with pending orders that creates the explosive price movements we will analyze next.
Working with Levels: Liquidity Deficit — Live Chart Example
Volume analysis shows the activity of professional participants, and order mechanics explain how they act through the order book. Now let us apply this logic to the real market — examining how large capital uses levels and orders for its own purposes.
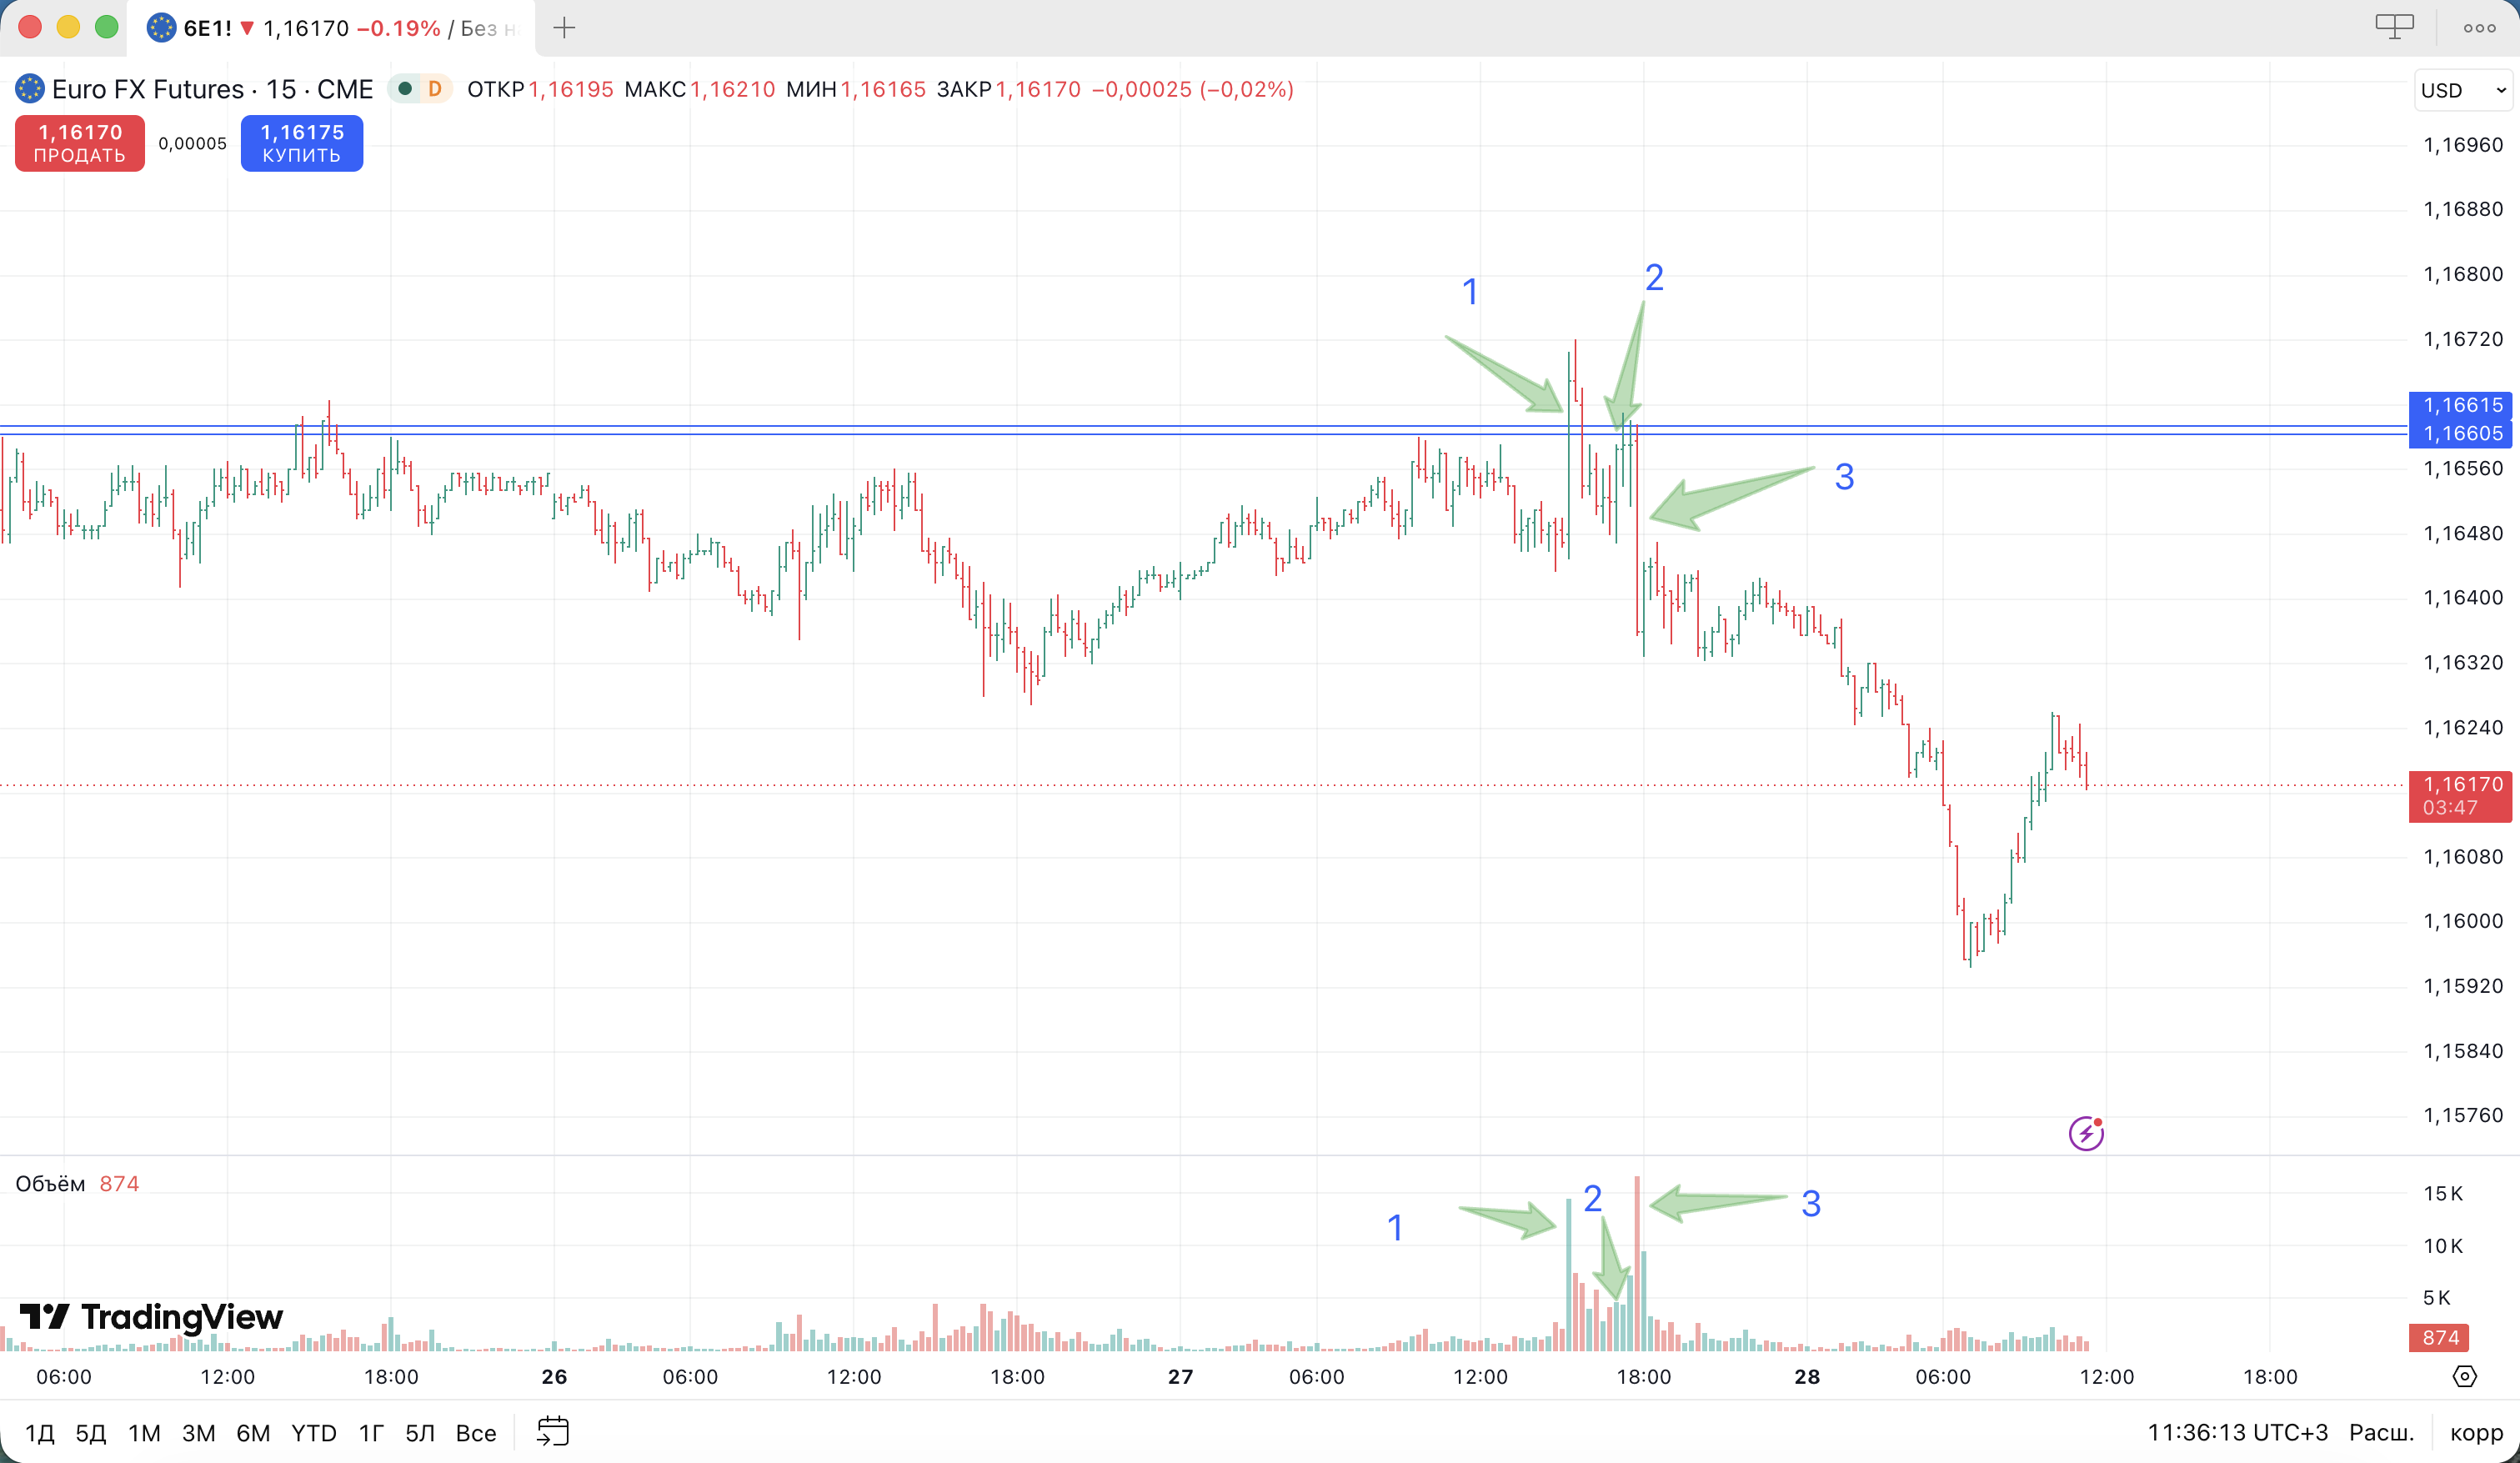
Now that we understand the types of orders, let us apply the logic of their influence on price. We will analyze a schematic example using Euro futures (CME Group data) to see how the market reverses at a level following a "false break."
From the Wyckoff method we take the following principle for working with levels: large capital, wherever it wants to sell, will always need buyers. This logic is based on the fact that smart market participants share roughly the same view of the instrument's fair value — which means wherever they sell, there will never be enough buyers to hold the price, since large capital in aggregate controls more than 50% of market turnover.
From the Wyckoff method we therefore examine the technique known as the "Spring" or "false level break" — the moment when, on news or for any other reason, price is pushed beyond a level where a large number of pending orders reside, activating them.
1 — We see a massive rising bar. The obvious conclusion: a large number of Buy Stop orders have been triggered, creating a surge of buyers into the market. Additionally, a level break is a signal for many systems to go long — which adds further demand. At this moment of buyer influx, large capital is executing hidden sells (Buy Stop + Sell Limits), doing so until buying-side turnover begins to fade at their price levels of interest. This is a direct manifestation of the Wyckoff "effort without result" principle — volume being applied to move price exists, but there is no progress.
2 — We see rising bars progressively narrowing in range, now approximately half the size of the first active-buying bar.
3 — Aggressive market selling with large orders, breaking through all local support levels. This bar typically initiates a local trend. This occurs because in a zone of elevated activity when a liquidity deficit begins — large orders have no counterparty and begin actively influencing price, in this case moving it downward.
The example we analyzed is a consequence of large capital interacting with the current state of market liquidity. For us as traders, the levels at which such explosive price movements occur are of special importance — they are excellent starting points for identifying market imbalance and the beginning of a trend.
The Wyckoff Method
The Wyckoff method — a market analysis system developed by Richard Wyckoff in the early 20th century. The core idea: the market is controlled by large players (banks, funds, market makers), and their actions leave traces on the chart through price and volume.
The Effort vs Result Principle in the Wyckoff Method
The key to understanding volume and the Wyckoff method is the "volume + price = result" relationship, also called the effort vs result principle.
We always examine trading volume in the context of price movement in order to determine the direction of imbalance between buyers and sellers and assess volume efficiency.
This relationship can be used to analyze:
- Trend strength
- The efficiency of individual movement waves
- Individual bar behavior
If volume is high but the price result is weak — this signals a potential loss of strength or absorption. If volume is accompanied by strong movement — the effort produced a result, and the side behind that volume controls the market. In simple terms, we can quantify the size of the imbalance and more precisely identify which side the professional participants are on.
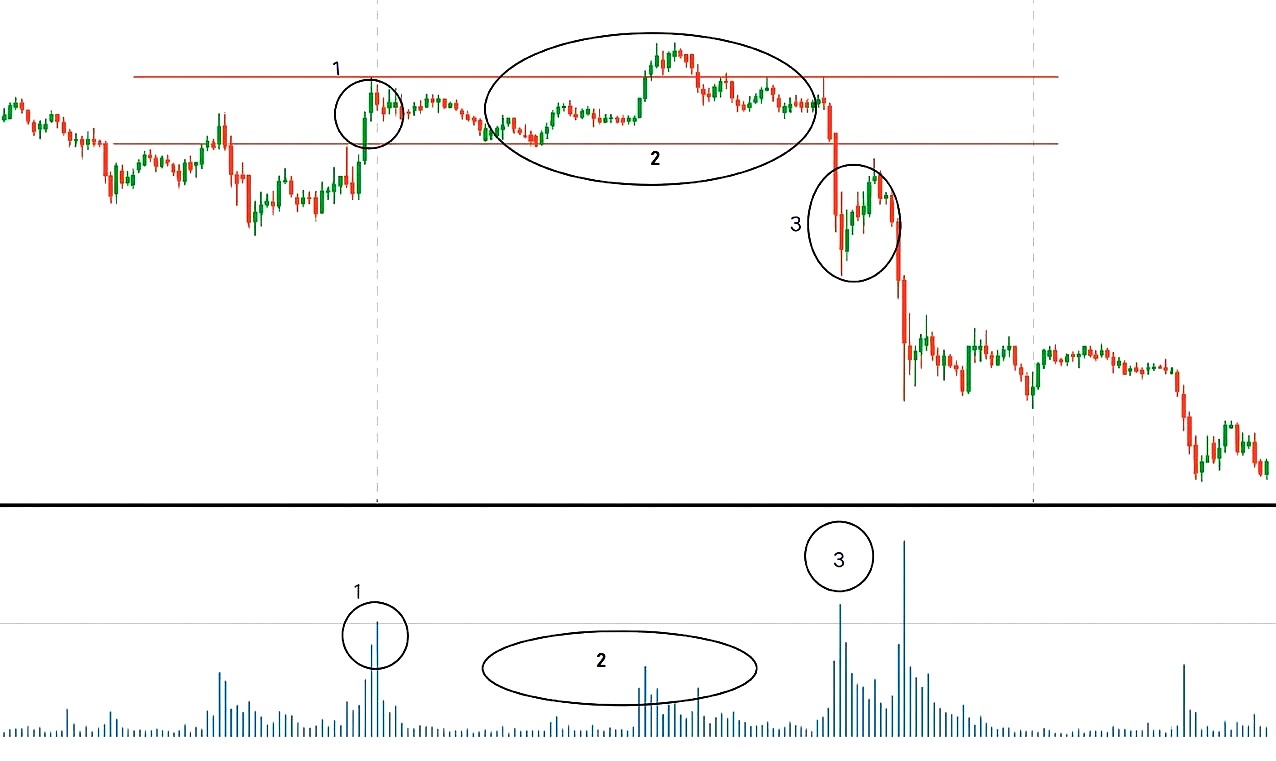
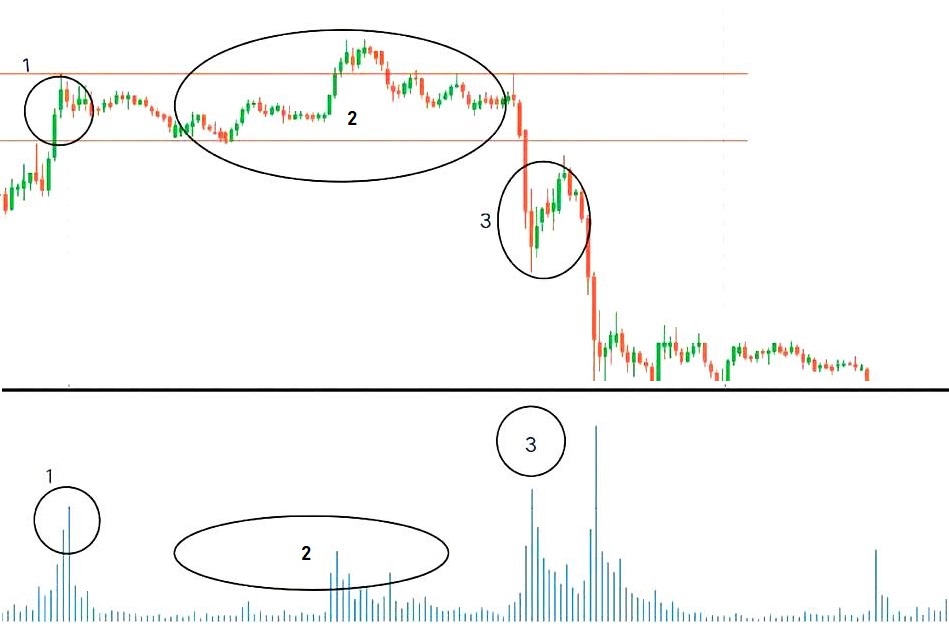
Let's look at a schematic example of how the effort vs result principle works on the Gold futures ("GC") chart from the CME Group exchange.
Zone 1: A rising bar with ultra-high volume appears on the chart. The spread (bar body width) is noticeably wider than previous bars. This is clear effort from buyers. However, instead of continuing upward, price stops and moves sideways — a range phase begins. We observe effort without result: volume was present, but price did not go up. This signals that selling within the rising bar exceeded demand — the first weakness appeared in the market.
According to Wyckoff volume analysis: "Market weakness always shows on up-bars, and strength shows on down-bars." This means professionals never sell without a surge of demand — otherwise their large volumes would crash the price against themselves and their profits would suffer greatly. To avoid this they wait until there is sufficient demand in the market to sell without an obvious price shift.
Zone 2: Sideways market movement with a failed attempt to rise above the ultra-high-volume bar from Zone 1, followed by the formation of a bearish priority change level. A failed attempt to break past a key level is called a false break — it reflects the absence of interest from large participants in moving the market in the previous direction.
Zone 3: The beginning of impulsive (trend) movement in the new direction, with the formation of new priority change levels at lower prices. All further trades are recommended exclusively in the direction of the impulse movement. Trading with the trend is the foundation of successful trading over the distance of trades.
This schematic example of the Wyckoff method and PCL changes shows how professional money tends to work in the market — you will often observe that they enter the market only to change the active trend, which strongly underlines their "predatory nature."
The effort vs result principle gives us a signal about the intentions of large capital. Now let us use this knowledge practically — we will identify the precise trade entry point.
How to Identify a Trade Entry Point
The Wyckoff method has given us an understanding of professional capital logic — false breaks, the effort vs result principle, accumulation phases. Now let us use this knowledge for a specific practical action: identifying the precise trade entry point.
Our objective is to enter the market after an impulse move on the price pullback — in the direction of the impulse.
The pullback move — when a support or resistance level breaks, the stop-losses of participants who believed in a bounce from the boundary trigger. Since a stop-loss is a reverse market order — an instruction for immediate position closure — price is simply "dragged" along the chart. Participants who were originally on the correct side close their profits (buy back at market), and this creates the pullback. It is on understanding this market mechanism that we will build our strategy.

I have specifically provided two schematic examples to illustrate the following point: the market is not mathematics — it is primarily the psychology and emotions of its participants. Price does not always have to move the way you are used to seeing it (as in the "calm market" example). Price will often move entirely without a pullback, ignoring its standard behavioral patterns — especially when unexpected news breaks.
Returning to the gold chart, let us examine wave "3."
Wave 3 — an impulse wave with ultra-high volume and a wide bar body. A wide bar body signals "hysterical" market selling (market sell orders). Any consolidation break inevitably triggers the stop-losses of traders positioned at the boundaries.
Then a pullback move begins — exactly the one we will always wait for after an impulse, to determine whether the break was genuine or false. I always wait for price to pull back to the consolidation boundary before making a trade decision, because market participants almost always resume their movement from the prices at which they originally applied effort!
If the break was genuine, selling will resume from the break price level. If the break was false ("Spring"), we will see price move back above the level.
In this specific case we observed that price approached the consolidation zone on ultra-low volume and resumed its downward movement. Our entry point was after the formation of a new priority change level in the downtrending market.
The entry point is identified. But knowing where to enter is only half the task. The other half — properly sizing the position and not letting emotions destroy the analysis.
Trading Psychology
The entry point is identified, the stop-loss is known, the market logic is understood. But even perfect analysis can be destroyed by a single bad psychological decision. This is why risk management and psychology are not supplementary to the system — they are a mandatory part of it.
Our objective is to learn how to calculate the working position volume, place a stop-loss correctly, and identify the main psychological traps of the market that prevent many traders from profiting consistently.
Capital management — risk management — is the key to a stable growth of your account. The risk in any individual trade is directly proportional to the trader's experience, but even the most experienced can make mistakes!
There is nothing permanent in the market, so never allow yourself to risk too much!
Your account and your risk per trade must always satisfy two criteria:
- They must be comfortable for you at your current stage of development
- They must not threaten your financial security

A schematic example of stop-loss placement after entering a position. The chart shows how a protective order is typically placed to limit maximum risk in a trade. The size of the stop order depends on the goals being set. A stop order is generally placed beyond the local extreme that shows signs of the pullback move ending.
How to Calculate Position Size with Risk Control
Let's calculate position size based on the allowable risk.
Input data:
- 💰 Capital: $35,000
- 📉 Allowable risk: 1% of capital
- 📏 Risk per trade: 150 points
- 💵 Value of one point: $10 (per 1 contract)
Calculation formula:
Position size = (Capital × Risk % × 0.01) / (Risk in points × Point value)
Position size = (35,000 × 1 × 0.01) / (150 × 10) = 350 / 1,500 = 0.233 lots
Verification of loss at stop-loss trigger:
Loss = 150 × 10 × 0.233 = $349.50
This corresponds to approximately 1% of capital, as specified.
Many participants work both through brokers that provide market access and directly through exchanges. It is important to clarify the parameters of the instrument being traded (point value) before calculating position size, after which you can calmly apply the formula. This is how I approach risk in my own trading, not personal advice for your situation, so practise every rule on a demo account first until the skill is solidified.
Fear and Greed in Trading
The core idea of volume analysis is that market prices are driven by fear and greed. It is on these emotions that professional traders trap the "crowd" and take their money.
Many beginner traders make the mistake of applying amateur or recreational thinking to trading. They treat trading as entertainment. If you are serious about trading, it is vitally important to change your mindset. Trading can be enjoyable, but the primary goal of professional trading is to generate profit.
About Indicators in Trading
Indicators — one of the first tools a beginner trader encounters. You open the platform, see dozens of beautiful lines, arrows and signals — and it seems like the solution. But this is exactly where one of the most insidious traps for beginners lurks.
The main problem with indicators is not that they do not work. The problem is the psychology of using them. When a trader uses an indicator as their basis, they unconsciously transfer responsibility for the result to the tool. Was the trade a loss? The indicator's fault — time to find a new one. And so the cycle continues — months and years are spent searching for "the one" indicator that will finally work all the time.
I spent several years looking for an indicator that would help me forecast the market — tried everything possible, but there were no results.
Indicators by their nature are derivatives of price — they process already-occurred events and display them differently. They do not predict the future; they describe the past. This is exactly why any indicator always lags behind real market movement.
Does this mean indicators are useless? No. An experienced trader can use them as a supplementary tool to confirm their analysis. But the key word here is supplementary. The foundation must always be an understanding of market structure, volume and price behavior — which is exactly what this course is about.
My advice: do not waste time searching for the perfect indicator at the start of your training. Master the fundamentals — market structure, PCL levels, the effort vs result principle. Once you understand how and why the market moves, you will be able to judge which tools help you and which create unnecessary noise.
Fundamental Analysis in Trading
Fundamental analysis — the study of economic factors that influence the value of an asset. Interest rates, inflation, GDP data, central bank decisions, geopolitics — all of these drive markets at a global level.
This sounds logical and important. And it truly is. But there is one problem — for a beginner trader, fundamental analysis is an entirely separate profession. Correctly interpreting inflation data or an Fed decision requires understanding macroeconomics, monetary policy, inter-market relationships. That takes years of study.
This is exactly why at the initial stage I recommend focusing on technical and volume analysis. The market already reflects all fundamental factors in the price — your task is to learn to read that price, not to predict it through economic data.
This does not mean fundamental analysis is unnecessary. In time, when you have a solid trading system and a stable demo account result, fundamental context will begin adding value to your analysis. You will understand why the market is moving in one direction or another on higher timeframes.
My simple advice: first learn to read the chart — structure, volume, price behavior. That is the foundation. Fundamental analysis is the next level that will come with time and experience.
Psychology and risk management are covered. Now let us put everything together — seeing how these principles work in real trades on live charts.
The Trader's Trading System
Live Example: Euro Futures
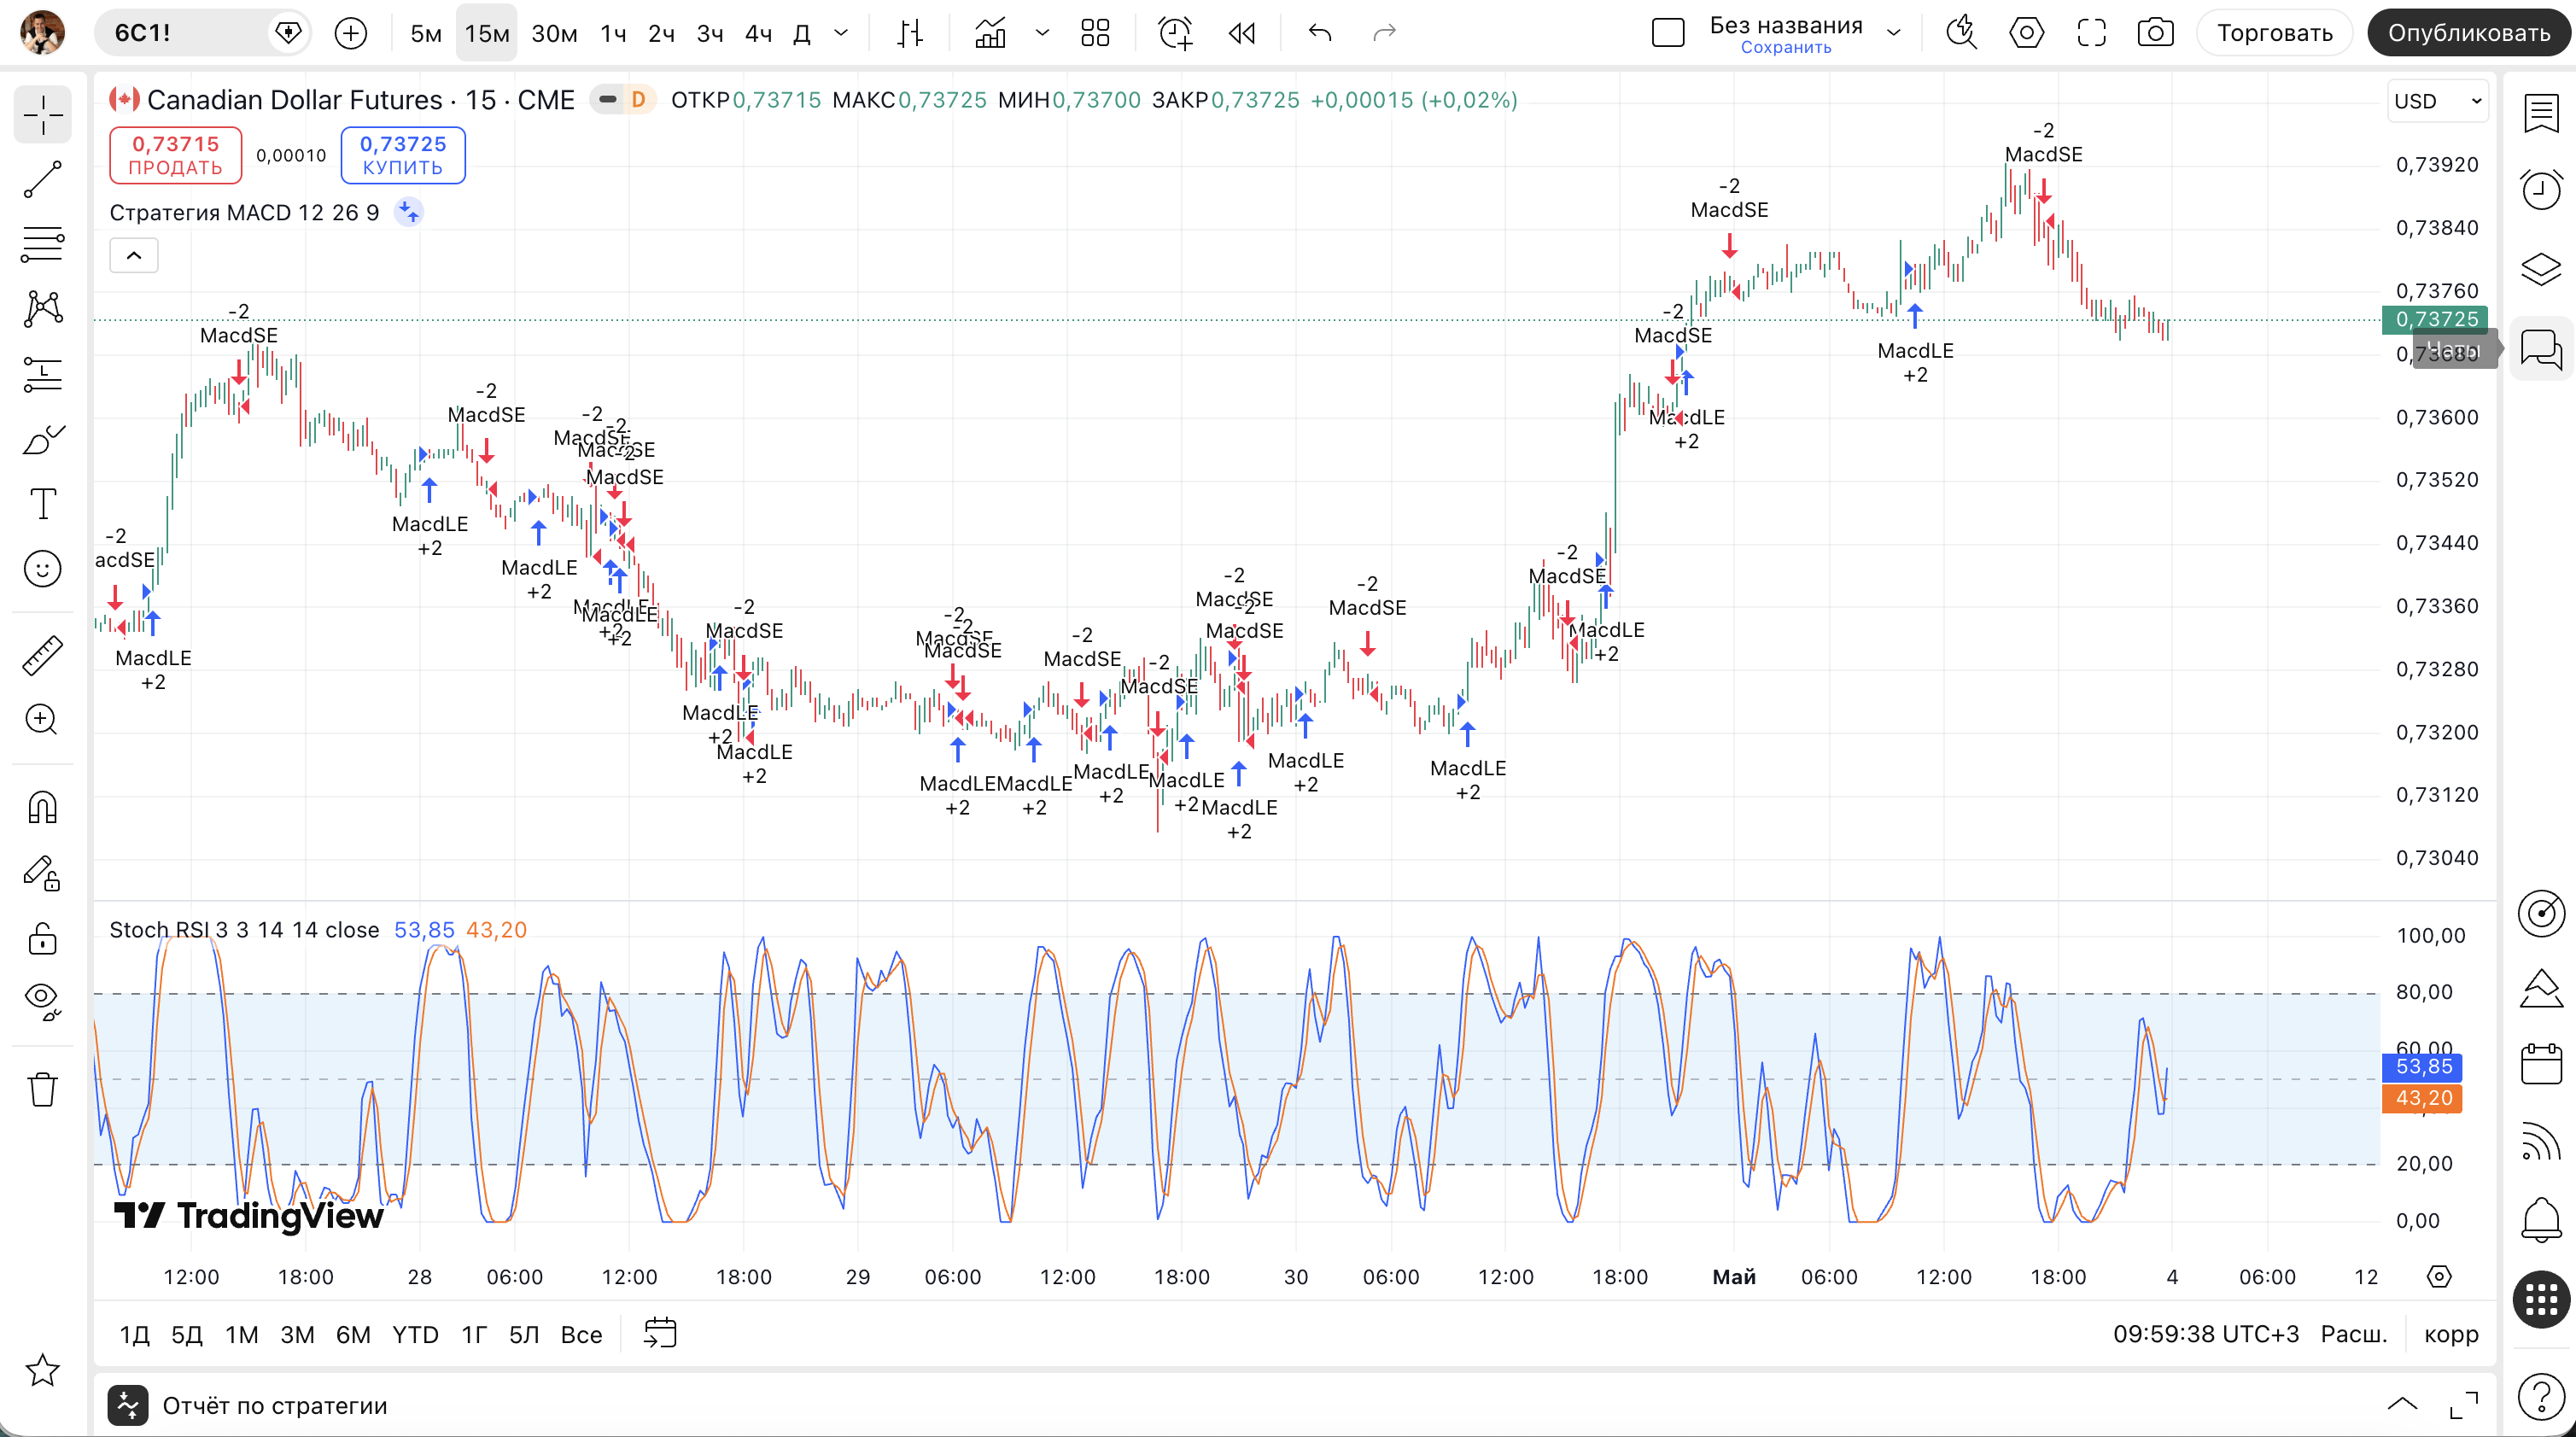
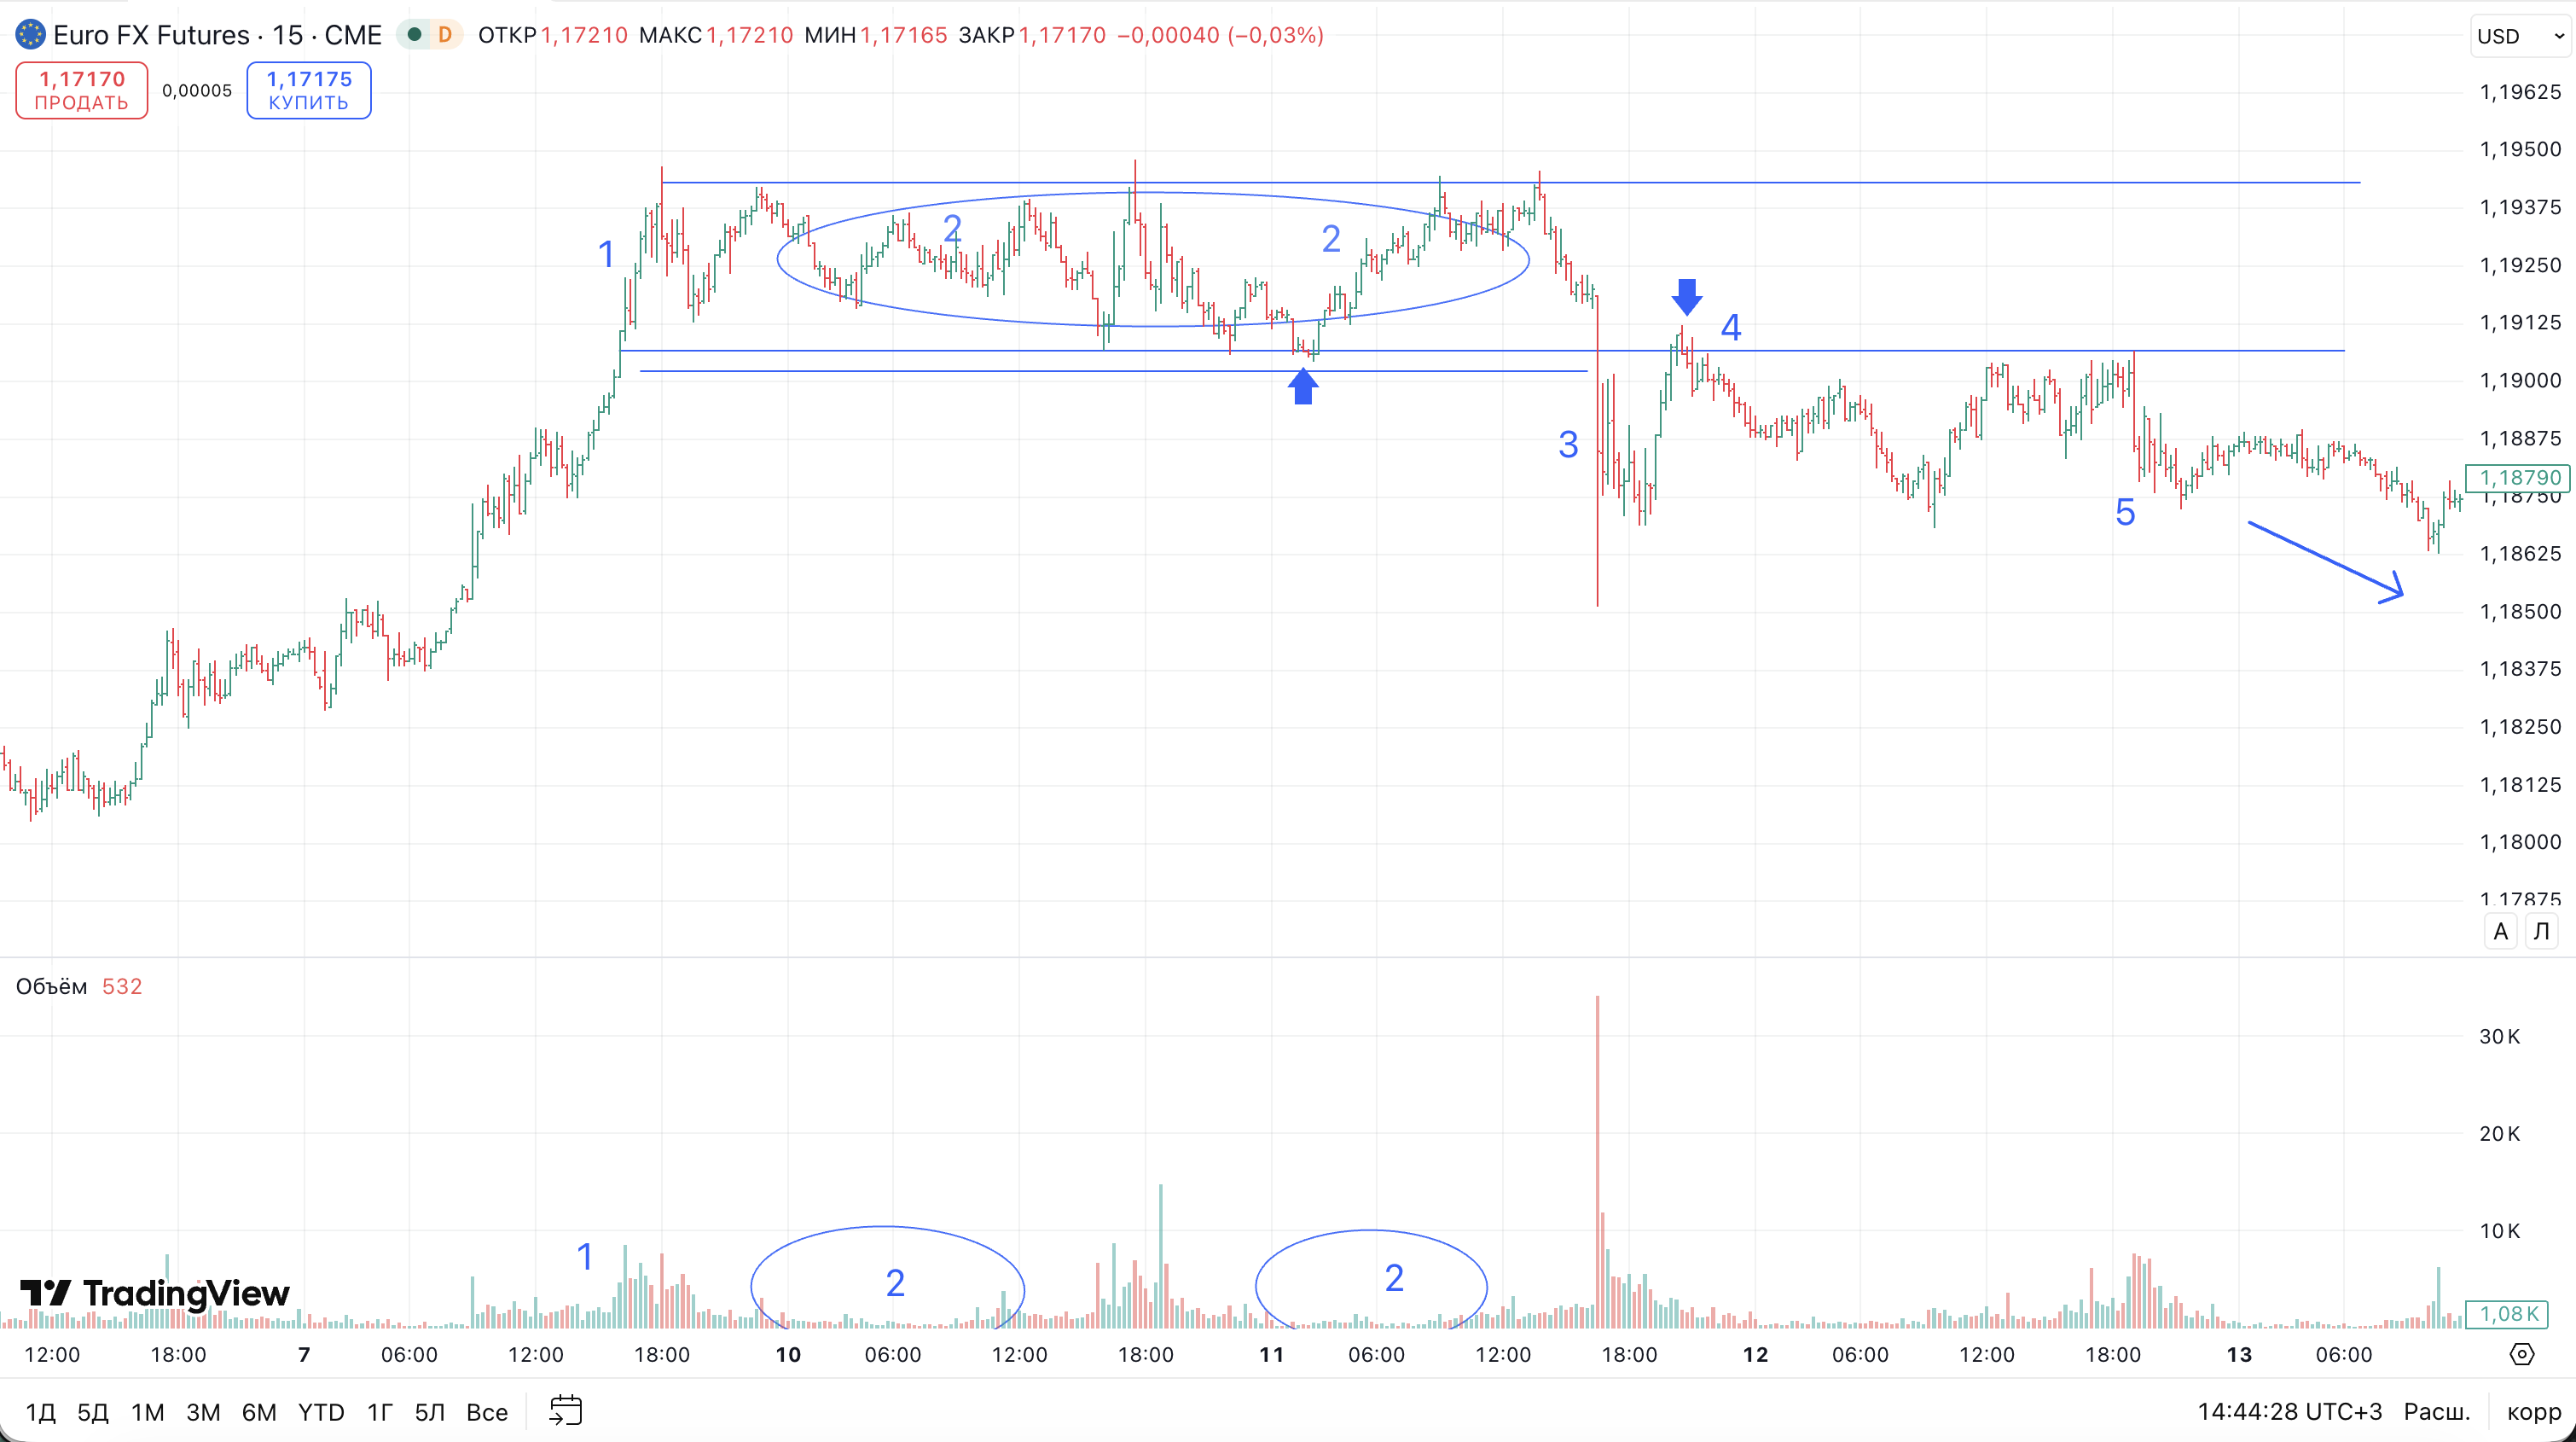
Let's analyze a live example on the Euro futures chart (the forex equivalent of EUR/USD). This example is a classic illustration of the Wyckoff concept — we will apply the effort vs result rules to identify the intentions of professional money, and also mark a structural change through the PCL level. Important sections of the chart are numbered; descriptions follow. The chart timeframe is 15 minutes, but it can be any timeframe.
1. In the Wyckoff method, wide down-bars on ultra-high volumes generally mark the beginning of accumulation by professional money. If in the gold example we saw how they sell at highs on elevated demand so as not to drive price against their own sales, in this example they are doing the opposite — buying when supply is at its maximum so as not to drive price against their own purchases. The conclusion: professional money always looks for opportunities to buy or sell without influencing the price. The fact that at point 1 price refuses to fall further after such a surge of selling confirms our thesis.
2. Point 2 is an entire range in the zone of ultra-high volumes. We can see how over time the selling pressure steadily decreases, which is additional confirmation that hidden buying in zone 1 prevented price from collapsing further. Zone 2 is also essentially a wave that should have rewritten the low — which we naturally did not see.
3. The key trigger for our attention. If at first we were reading hints from the market and drawing logical conclusions about what might be happening in the background, now the market speaks unambiguously: "I am changing the trend" — structure break, break of the PCL resistance level.
4. Recalling the theory covered above in schematic examples, we see a pullback to the resistance level — but now from above — and we mark a completed retest. The level held and the first higher low appears with a characteristic bullish pin bar. This example falls under "calm market behavior" — no obvious frenzy, everything within classic parameters. Point 4 is also the best place for a protective stop order, as the first higher low within the rising structure.
5. A new effort upward — volume is ultra-high, which is a good sign of a developing new trend, as price is holding schematically within the rising structure.
After the new structure formed as marked on the chart, all trades must be exclusively trend-following in nature, from support levels, as covered in the schematic examples.
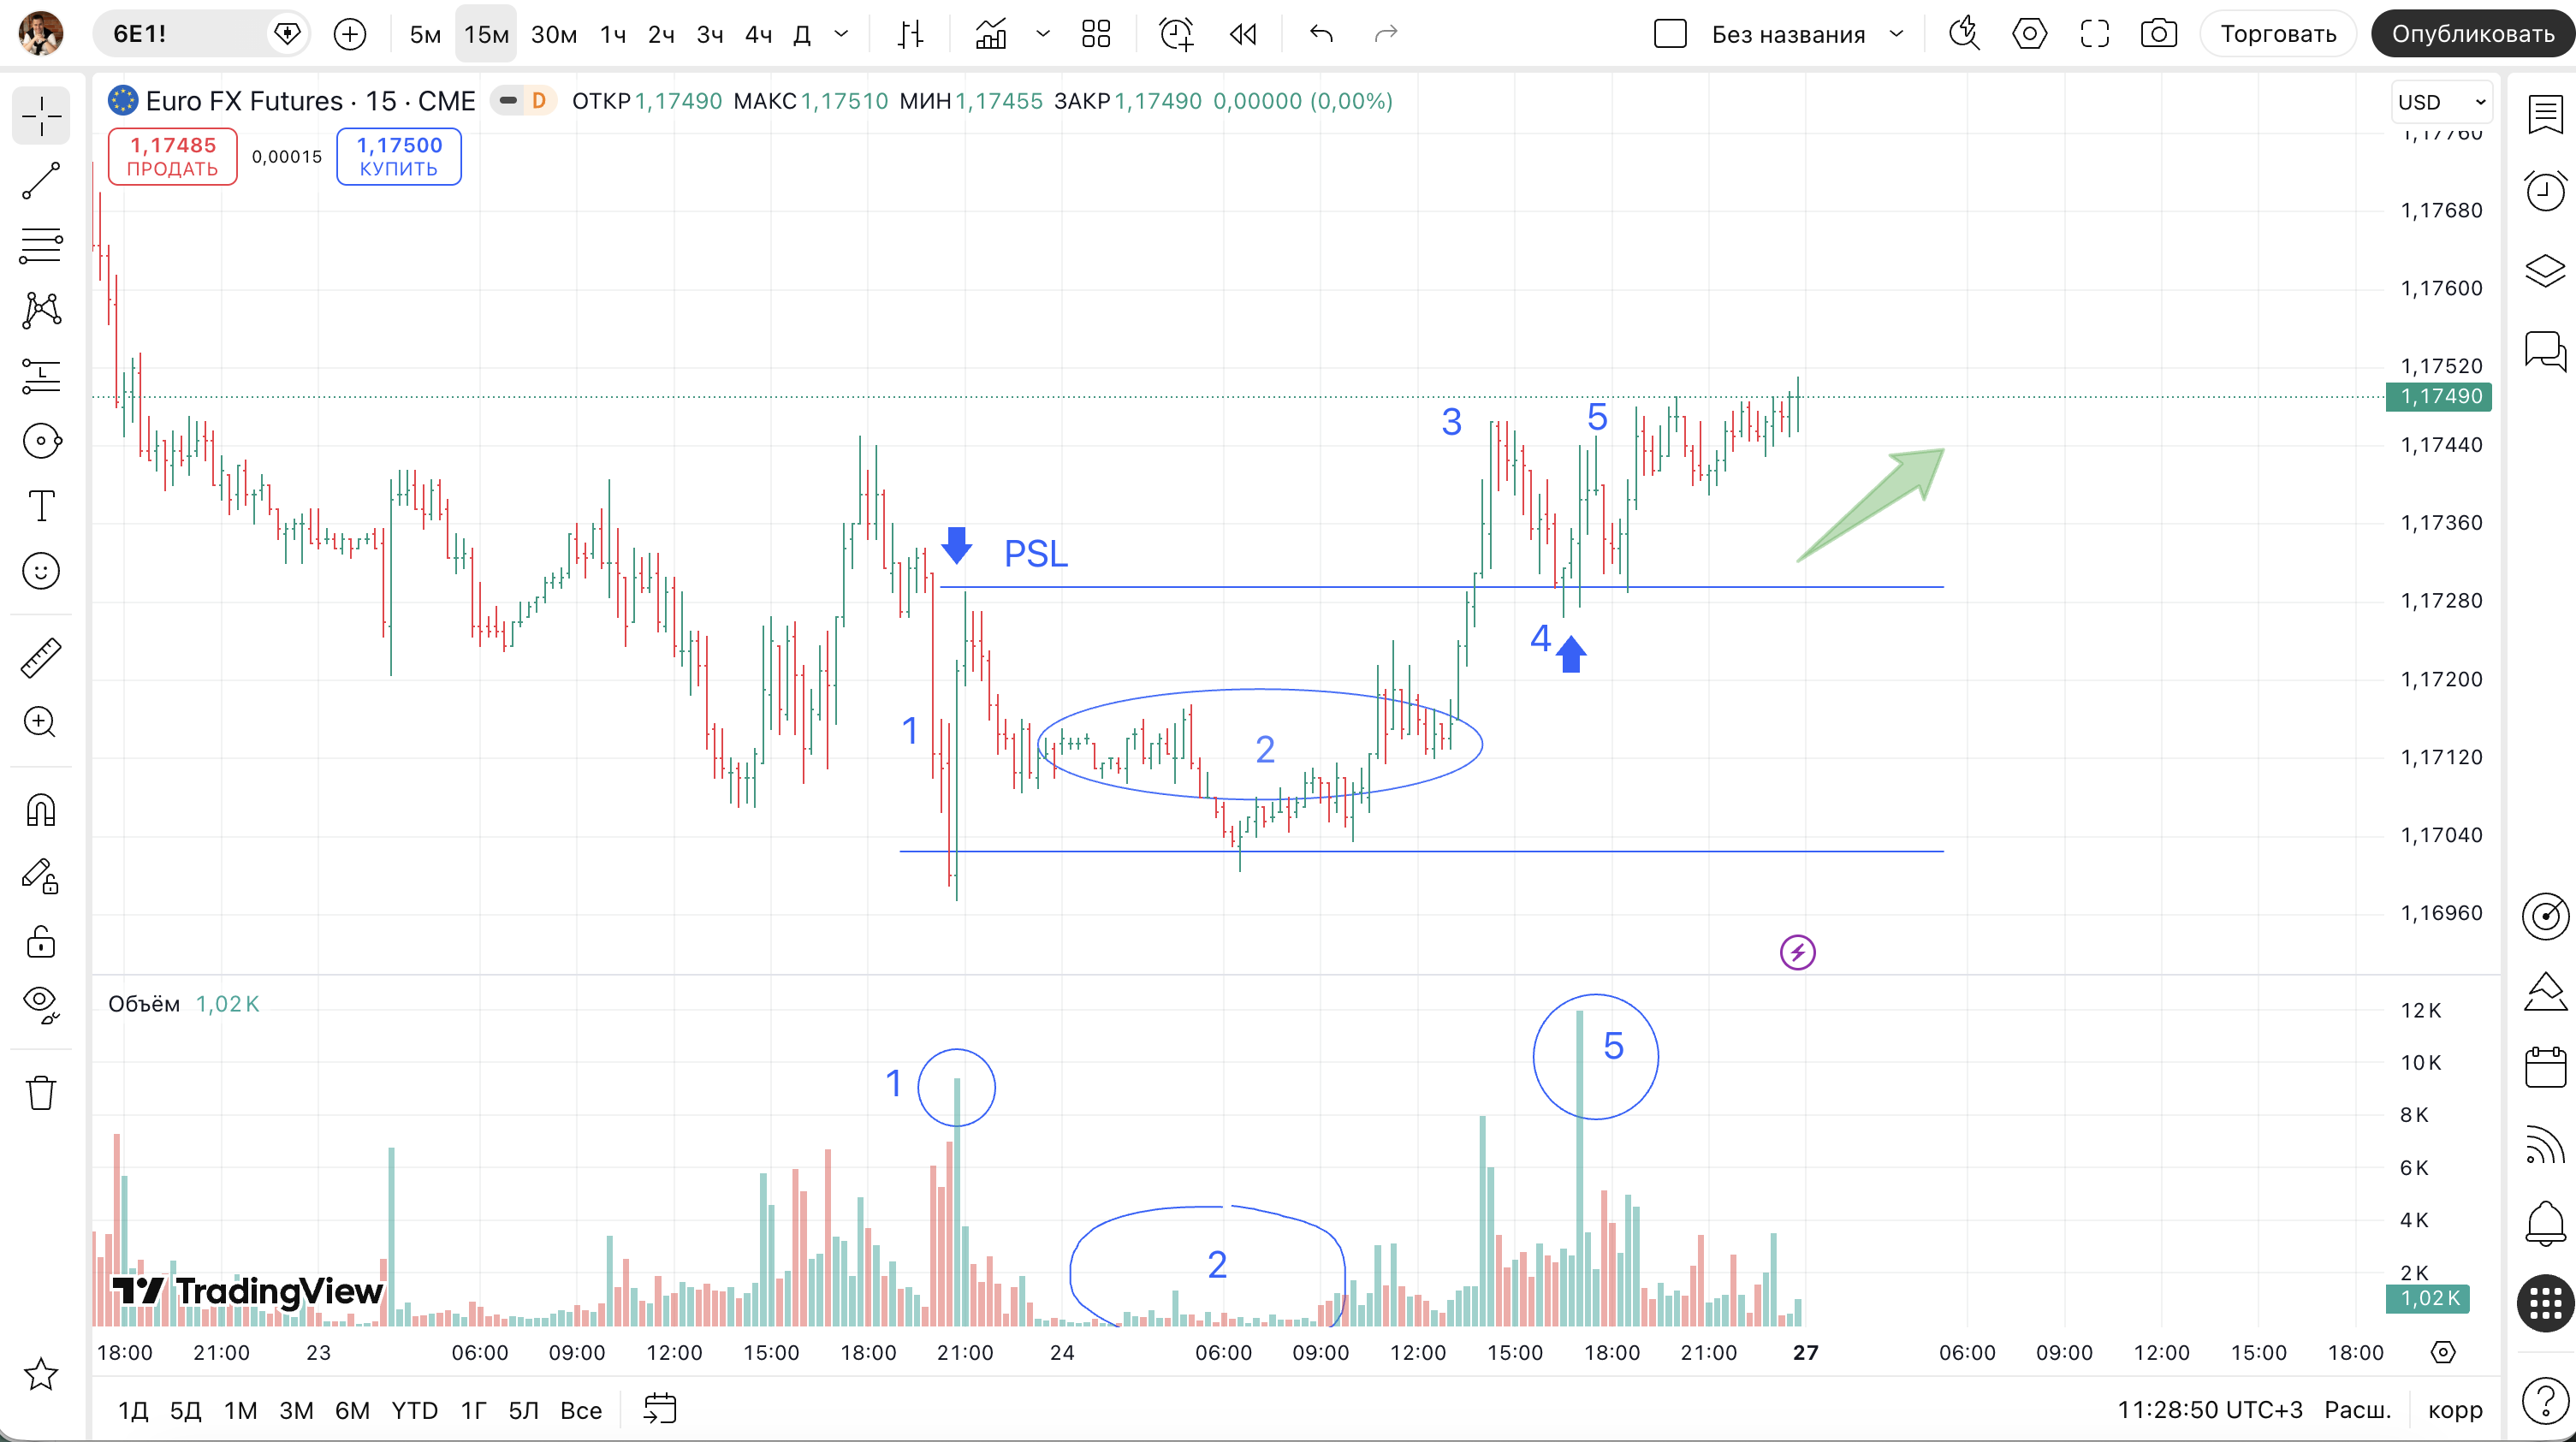
Live Example: Japanese Yen Futures
Let's analyze a live example on the Japanese Yen futures chart (the forex equivalent of USD/JPY). This example is also a classic illustration of the Wyckoff concept — we want to see the intentions of professional money and mark a structural change through the PCL level (marked with a blue arrow). Important chart sections are numbered as usual; descriptions follow. The chart timeframe is 15 minutes, but it can be any timeframe.
1. As usual, we wait for the selling climax signal — when at the level of interest there is a surge of supply, which professional money exploits by buying without shifting prices against their own purchases. This is always a down-bar (a surge of market sell orders), after which price reverses and does not go lower. The "selling climax" is also the beginning of the accumulation phase by smart money.
2. Point 2 is always an entire range in the zone of ultra-high volumes. Until selling pressure eases, the market will not respond with upward movement. But the moment bearish bar volumes begin to fade, we will always see the market respond with rising prices. And of course, this is additional confirmation that what was happening in point "1" is truly an accumulation phase.
3. As usual, the most critical moment — we see the first attempt to break through the PCL after selling pressure eased in the range. We always wait for a price reaction after the first level break! We must wait for the 3-4 wave as "market testing."
4. The first higher low after testing the PCL resistance boundary — the most important factor in the trading system. If the market forms the first higher low at point 4, we have every reason to call a trend change. Point 4 is the best location for a protective stop order, as the first higher low within the rising structure.
5. A new effort upward — volume is ultra-high or high, which is a good sign of a developing new trend as price holds schematically within the rising structure. Point 5 is the market's response after a successful test (wave "3-4").
This example is analogous to the previous one. The trading system looks like a set of specific events that the market gives us. If you do not see the sequential appearance of 1-2-3-4-5 — you have no entry points within the trend structure. If you have marked them — you have every reason to trade in the trend direction.
I want to note an important point: in this beginner course I only provide schemes for working with the trend, because in a trend you always achieve a risk-to-reward ratio of 1:3 or better — which is the mandatory condition for positive mathematical expectation, which I detail in one of the sections. The site also has a "Practice" section with examples of working from boundary bounces — in simple terms, range trading. I recommend this method only to those who already have sufficient experience to identify Price Action patterns on a chart.
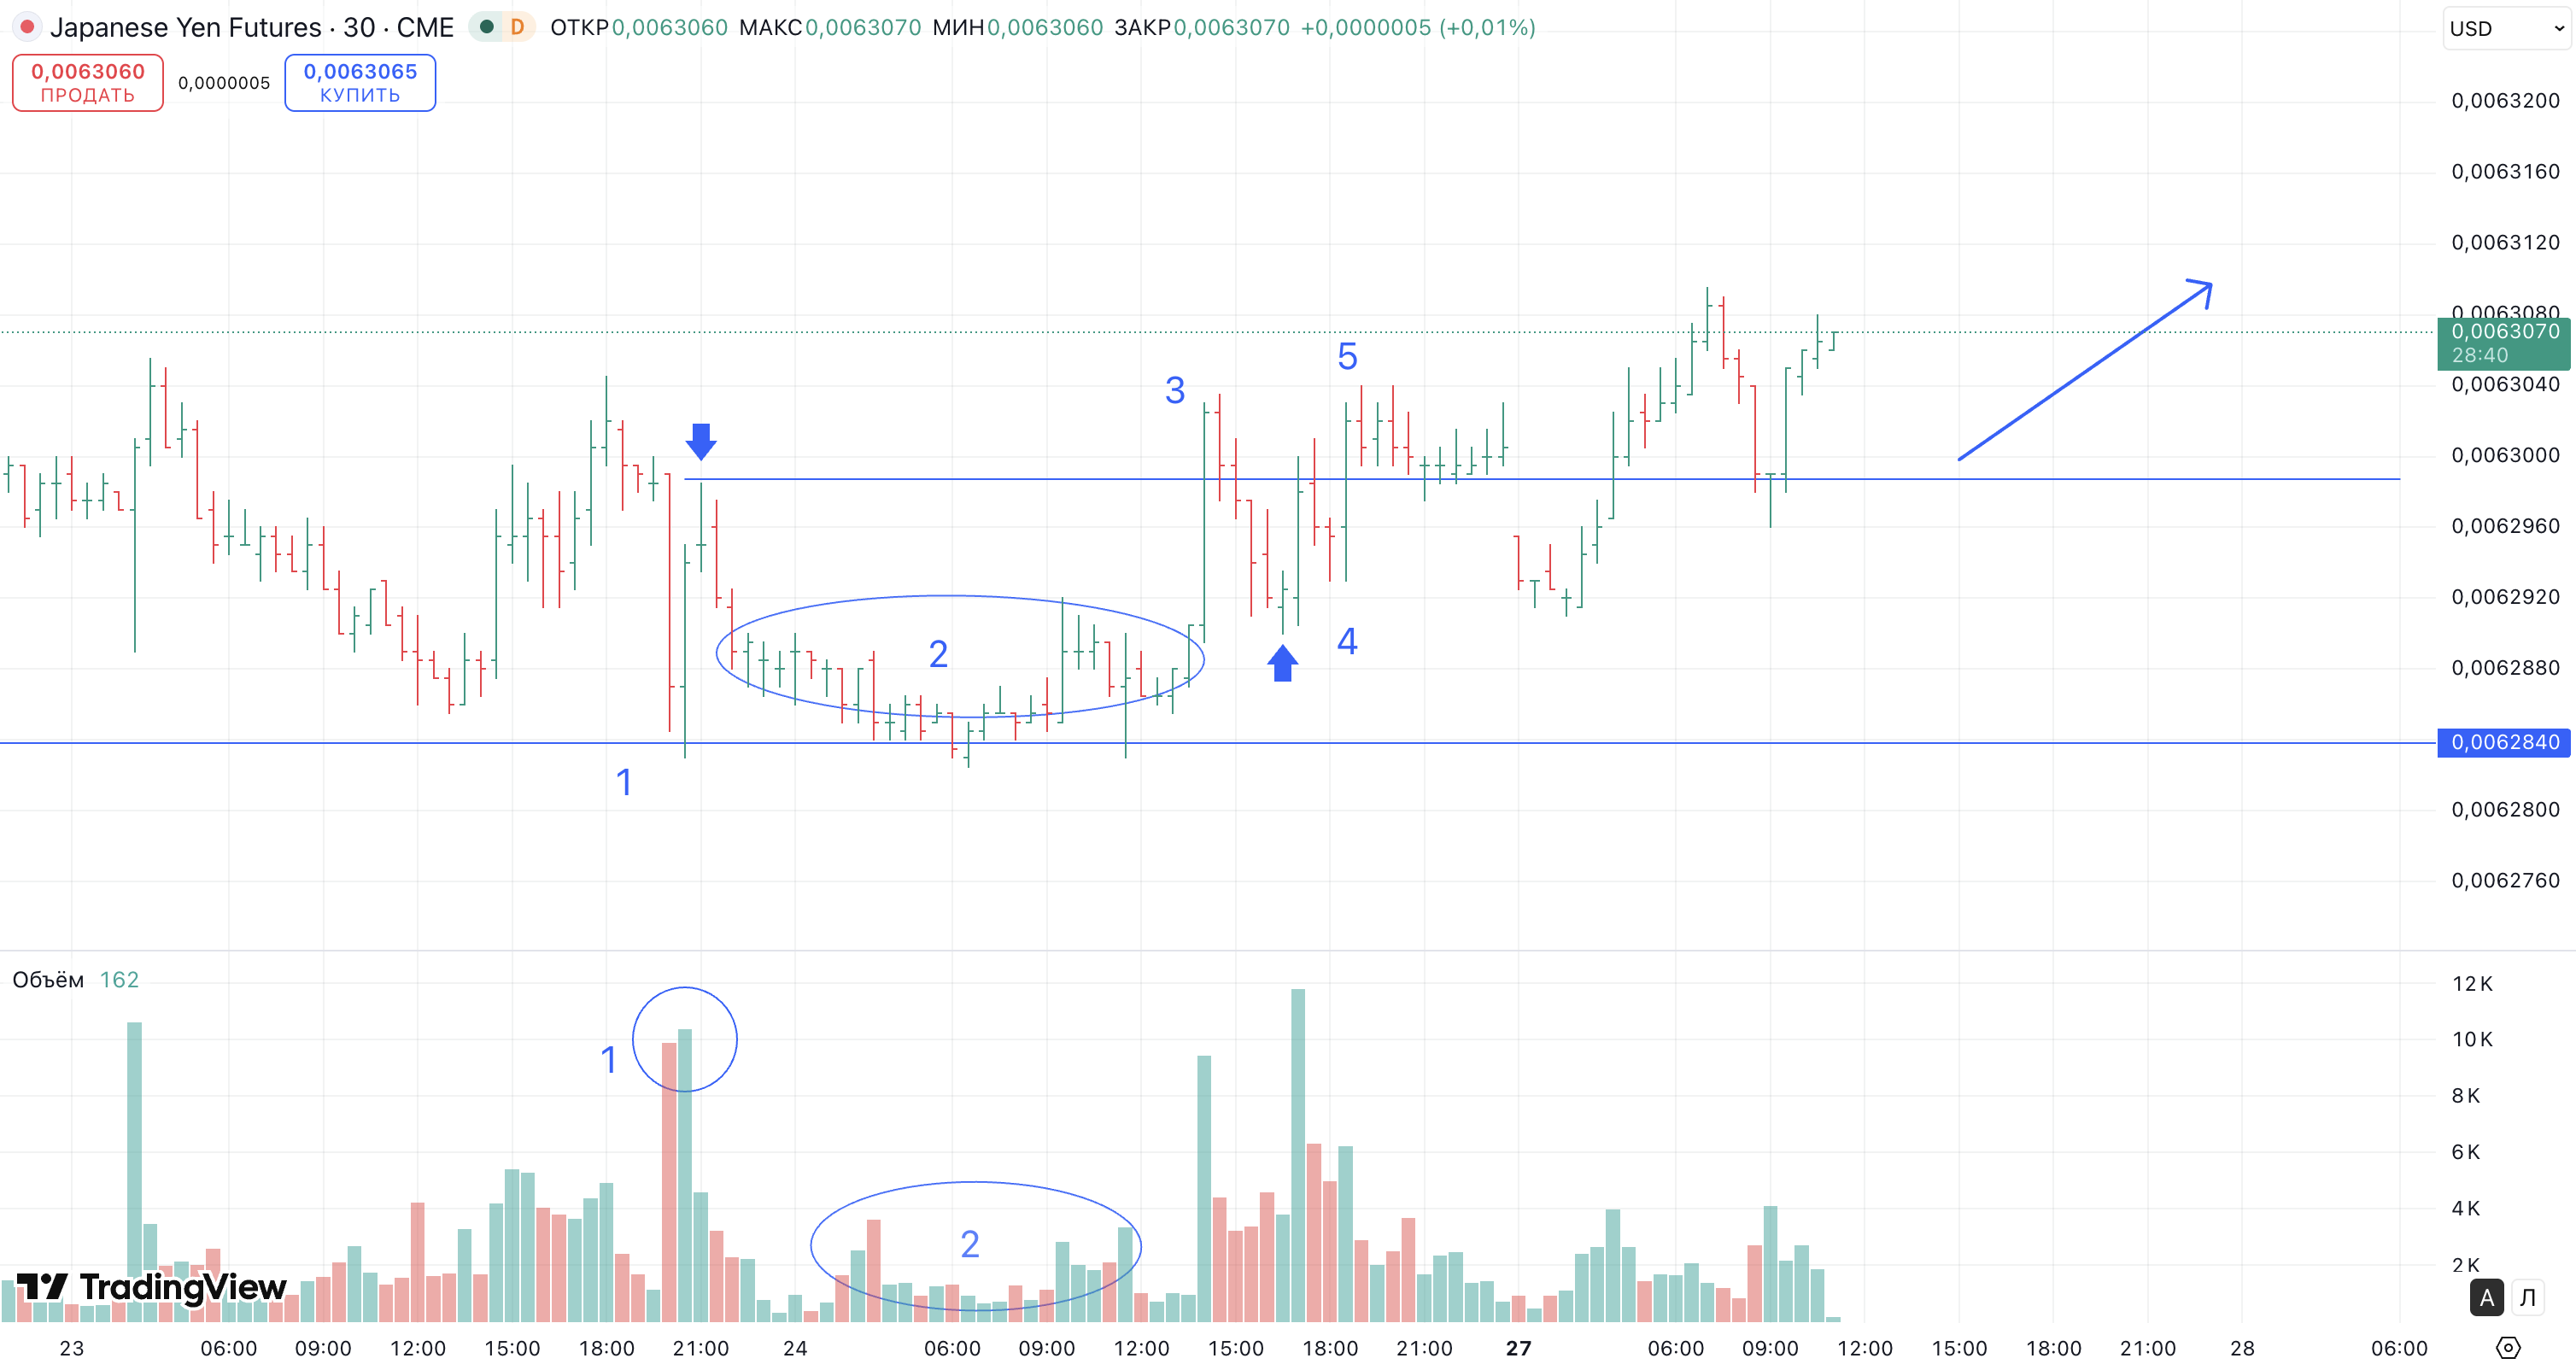
Live Example: Distribution Phase on Euro Futures
Let's analyze a live example on the Euro futures chart (EUR/USD equivalent). Last time we analyzed a model transitioning from a downtrend to a rising trend through the accumulation phase per the Wyckoff method. Now we will examine the distribution phase — how the market changes an uptrend to a downtrend. We will again apply the PCL logic as a reference point and mark digits from 1 to 5 to indicate the change in market auction direction. The chart timeframe is 15 minutes, but it can be any timeframe.
1. We wait for the buying climax signal — when at the level of interest there is a surge of demand, which professional money exploits by selling the asset without shifting prices against their own purchases. This is always an up-bar (a surge of market buy orders + sell limits), after which price stops and does not go higher. The "buying climax" is also the beginning of the distribution phase by smart money.
2. Point 2 is always an entire range in the zone of ultra-high volumes. Until buying pressure eases, the market will not respond with a decline. But the moment bullish bar volumes begin to fade, we will always see the market respond with falling prices. And of course, this is additional confirmation that what was happening at point "1" is truly a distribution phase.
3. As usual, the most critical moment — we see the first attempt to break through the PCL (support level) after demand pressure eased in the range. We always wait for a price reaction after the first level break! We must wait for the 3-4 wave as "market testing" — the buyers' response to sharply lower prices.
4. The first lower high after testing the PCL support — the most important factor in the trading system. If the market forms the first lower high at point 4, we have every reason to call a trend change. Point 4 is the best location for a protective stop order, as the first lower high within the bearish structure.
5. A new effort downward — volume is ultra-high or high, which is a good sign of a developing new trend as price holds schematically within the downward structure. Wave 4-5 is the market's response after a successful test (wave "3-4"). Volume also marks the change in market auction direction (sell stop order pressure).
In practice the accumulation and distribution phases per Wyckoff look like mirror images — they can differ in duration but are always structurally similar. To trade within a trend, you never need to anticipate their change until wave 4-5 has formed — this is the best place to join the new trend structure with a clearly defined protective stop order.
Three live examples showed how the system works when identifying entry points. Now let us cover the most difficult part — how to exit a trade properly and why this determines the final result.
Position Management. How to Exit a Trade?
Three live examples showed how the system works when identifying entry points — accumulation, distribution, structural change through the PCL. But identifying the entry is only half the task. The second — and most difficult — half is managing the position properly and exiting the trade.
One of the most important topics in trading — finding a trade entry can be done in a million ways, but the exit is rarely predetermined.
The market is a dynamic system that changes every second under the influence of a vast number of factors (news, etc.). You never know for certain where price will go next. This uncertainty is the first and foremost constant of the trading profession. And this is where most beginners fail.
Psychology plays a decisive role here. Humans handle uncertainty poorly. We want to know "what happens next," and this desire pushes us toward searching for the "holy grail" — a system that is almost always right. I went through this myself. In the early years I tried almost everything: classic indicators found in most platforms, martingale, various averaging strategies, algorithmic trading, scalping. Several deposits were completely wiped out. The market ruthlessly demonstrated: such systems simply do not exist.
Why the Wyckoff method? I did not arrive at it immediately — it took years of searching for a trading method that suited me specifically. Because all people are unique and each needs "their own trading methodology" — again, due to psychology. In the Wyckoff method I found what was missing from other approaches — clear logic. We follow the most perceptive market participants, who according to CME exchange data are both the largest participants and tend to make rational decisions. The exchange itself confirms they are consistently on the right side of the market. Beyond the logic, we have a complete understanding of their behavioral patterns, which also greatly simplifies the analysis. Since their trades are generally at levels (local or global), the market ceases to be "chaos" for us and becomes a logic of asset valuation through the lens of "cheap" and "expensive."
Accordingly, if you see the formations we studied above at a level, historically the market more often comes to the opposite level from which it originally started its movement — this is exactly why the opposite level is the logical target for a trade. This is logically grounded in the fact that price moves from "expensive" to "cheap" and back, and that same smart money per Wyckoff methodology takes rational action at these levels and changes price direction through the volume of their trades. It is important to understand — this is not a guarantee, but a statistical regularity that, combined with a 1:3 risk-to-reward ratio, gives the trader a mathematical edge over the distance of trades.
In joint work with Professor Inna Sytnyk we thoroughly systematized the main cognitive biases of retail traders — this topic has been well studied by Nobel laureates ("Psychology of Investment Decisions: Cognitive Biases of Retail Traders in Financial Markets," journal "Investments: Practice and Experience," No. 4, 2026, DOI: 10.32702/2306-6814.2026.4.96, UDC 336.76:159.9). Most of these biases manifest precisely during moments of uncertainty — when the trader cannot calmly accept that the stop was hit or profit did not reach the target. The key conclusion: psychology fundamentally works against the retail trader — and the first thing a trader must do is learn not to let emotions influence trading decisions.
The bottom line: exiting a position is not about finding the ideal point on a chart. It is about constant acceptance of uncertainty and the discipline of following the trading system. Do not try to predict the future. Monitor market structure and volume, maintain a reasonable risk-to-reward ratio — and let the mathematics work for you.
The market will continue to test you. The trader's primary objective is to not break down psychologically and to keep following the rules, even when the temptation to intervene is strong.
Mathematical Expectation in Trading: Model of a Profitable System
The mathematical model of a profitable system consists of three key parameters:
- Stop-loss is always set (always means always!)
By cutting losses you prevent the market from "locking" you into losing trades. This keeps your capital working. - Risk-to-reward ratio
Minimum ratio — 1:2, preferably 1:3. This means that risking 5 points, your potential profit must be at least 15 points. If this ratio is not present — the trade should not be taken. - Probability
With a 1:3 ratio you can afford to have fewer winning trades and still be profitable, because each win brings significantly more than each loss takes.
Example with a 1:3 risk-to-reward ratio:
- Stop-loss — 5 points
- Take-profit — 15 points
- 10 trades: 4 losses, 6 wins (60% WinRate)
- Losses: 4 × (−5) = −20 points
- Profit: 6 × (+15) = +90 points
- Total result: +70 points profit over 10 trades
Same 1:3 ratio, but winrate of only 40%:
- 10 trades: 6 losses, 4 wins
- Losses: 6 × (−5) = −30 points
- Profit: 4 × (+15) = +60 points
- Result: +30 points — the system is still profitable
These calculations show how effective the 1:3 model is! If you select trades at this ratio, even being right only one time in three trades still yields a positive result!
Common Mistakes of Beginner Traders
Position management and mathematical expectation provide understanding of how the system works over the distance of trades. Now the final step before real practice: analyzing the common mistakes that break even a well-built system, choosing a broker and instrument, and starting to trade on a demo account.
Over years of training traders I have noticed that most beginners make the same mistakes. Below are the most common ones.
- Trading without a stop-loss. The costliest mistake. The trader hopes price will come back — but the market is not obligated to do so. One losing day without a stop can wipe out weeks of profitable work.
- Averaging a losing position. Price moves against you, the trader adds to the position to lower the average entry price. As a result the loss only grows. Averaging losses is not position management — it is gambling.
- Overtrading. The desire to trade constantly — without a setup, without reason. The market is not obligated to provide opportunities every day. The best trade is sometimes the one you did not open.
- Trading against the trend. A beginner sees price has risen for a long time and thinks "it must fall now." This is not analysis — it is a guess. Trade only in the direction of the active market structure.
- Revenge trading after a loss. After a series of losses the trader tries to recover — increases volume, opens trades without analysis. This almost always results in an even larger loss.
- Moving to a live account without preparation. The demo account feels boring and you want real money. But without 100 trades on demo you do not know your system's mathematical expectation — and you are trading blind.
Most of these mistakes are related not to lack of theoretical knowledge but to emotions. This is exactly why trading psychology and risk management stand alongside technical analysis in this course.
How to Choose a Broker for Trading
A broker is an intermediary between you and the exchange. The quality of order execution, reliability of fund storage and ease of use all depend on your choice. Here are the key criteria to consider.
- Regulation and license. The broker must operate under the supervision of a reputable regulator — SEC, CFTC, FCA, CySEC. This is the minimum guarantee that the company operates under established rules and your funds are protected.
- Available instruments. Confirm the broker provides access to the instruments you plan to trade — futures, forex, stocks or crypto.
- Order execution conditions. Execution speed and slippage matter — especially if you plan to trade actively. Test on a demo account before going live.
- Commissions and spreads. Compare trade costs across several brokers. High commissions significantly eat into profits over the distance — especially with frequent trading.
- Trading platform. A convenient and stable terminal is mandatory. Most brokers offer their own platforms. Test on a demo account before depositing real funds.
- Support quality. Check how quickly and competently support responds before opening a live account. In a critical moment this can matter.
The main rule: never open a live account with a broker without prior testing on a demo account. A minimum of 2–4 weeks of demo trading will show you the real quality of order execution and platform convenience.
What Should a Beginner Trade on the Exchange?
Financial markets offer a huge number of trading instruments. For a beginner trader it is important not to spread thin but to focus on one instrument and study its behavior thoroughly. Let's cover the main categories.
- Futures. Contracts for the delivery of an asset at a future date at a pre-agreed price. They trade on centralized exchanges (CME, CBOT) — meaning transparent volume, clear rules and no broker manipulation. This is exactly why all live examples in this course use Euro and Japanese Yen futures. Volume analysis and the Wyckoff method work most effectively on futures.
- Forex. The interbank currency pair market. Operates 24 hours a day, 5 days a week; high liquidity, low entry threshold. Disadvantage — a decentralized market without centralized volume, which complicates volume analysis.
- Stocks. Shares in companies. They trade on stock exchanges (NYSE, NASDAQ). Suitable for long-term positions. Disadvantage — active trading requires significant capital.
- Cryptocurrency. High volatility, round-the-clock trading. The same technical and volume analysis principles apply here. Disadvantage — elevated risk due to weak regulation and frequent manipulation in low-liquidity coins.
Recommendation for beginners: start with one instrument and trade only that. The methods you have learned in this course are universal and work on any of the listed markets. The key is to choose an instrument with sufficient liquidity and trade it on a demo account until you accumulate 100 trades. After achieving a positive result over 100 trades — transition to a live account.
How to Start Trading on a Demo Account
After studying the theoretical material the next step is practice. Open a demo account with any convenient broker or exchange and begin applying the knowledge gained in real market conditions. At this stage mistakes are inevitable and should not be a reason to stop. Trading is a marathon. The winner is not the person who guesses the direction of a single trade, but the one who profits consistently over the distance of trades.
I recommend starting live trading only after completing at least 100 trades on a demo account. This is necessary to determine the mathematical expectation of your strategy — the key metric that allows you to understand what to expect from the system going forward. The methods you have learned in this course are universal, working on any charts and timeframes, as they are founded on market structure and the analysis of supply and demand balance.
The Trader's Trading Journal
A trading journal is a tool for control and self-analysis. Since this course emphasizes systematic trading, your journal should contain no random trades. Every entry must reflect a conscious decision made according to system rules — you saw a setup, waited for confirmation, opened the trade with a clear stop and target.
The journal is what gives you an honest picture of your trading — not feelings, not memory, but numbers. After 100 trades you will be able to calculate the real mathematical expectation of your system and determine whether you are ready to transition to a live account.
What to record for each trade:
- Date and time — when the trade was opened
- Instrument — what was traded
- Direction — long or short
- Entry price — at what price you entered
- Stop-loss — where the protective stop is placed
- Take-profit — where the target is
- Result — profit or loss in points and money
- Reason for entry — what you saw on the chart: PCL, selling climax, level break
The last point is the most important. If you cannot explain why you opened a trade — it was a random trade. Random trades have no place in a systematic trader's journal.
Review the journal regularly — once a week or after every 20–25 trades. Look for patterns: which times produce the best results, which instruments, which setups. This is the path from beginner to systematic trader.
Frequently Asked Questions
Absolutely. This course contains 151+ articles and 78+ video lessons covering everything from basics to advanced Smart Money strategies. It's designed to give you a complete self-study trading without any paid upsells.
There is no fixed timeline, and in my experience no one can promise you profitability by a certain date. The theory in this course takes a few weeks of focused study. After that the honest milestone is 100+ trades on a demo account, which is what finally shows whether your system has a positive mathematical expectation. How long that takes depends on you, and reaching consistency is a goal to work toward, not a guaranteed outcome.
It means your potential profit on a trade is at least 3 times what you risk. If your stop-loss is 10 pips, your target is 30+ pips. With this ratio the math can stay positive over the distance even at around a 40% win rate, as long as you always use a stop. It is a statistical edge across many trades, not a promise on any single one.
Smart Money refers to institutional traders — banks, hedge funds, market makers. They have enough capital to move price. Understanding their playbook helps you trade with them, not against them.
The exact figure depends on the study and the instrument; "90%" is more of a warning than a precise number. Regulator disclosures in the EU, for example, consistently show that most retail accounts (roughly 74-89% on leveraged products) lose money. In my experience three causes repeat: no trading system, no risk management, and emotional decisions. Clear rules and a stop on every trade will not guarantee profit, but they remove the most common reasons beginners blow up an account.
For learning: zero — use a demo account. For live trading: depends on your broker, but the amount matters less than proper risk management. Never risk more than 1-2% per trade.
It's the price zone where an impulse move started that broke previous highs or lows. When price returns to this zone, it often presents a high-probability entry point.
Signs: price pierces a level on high volume but fails to hold, forms a rejection candle, then reverses back into range. Smart Money uses these to trap retail traders before moving the opposite direction.
About the Author
Author: Igor Arapov — independent researcher in trading psychology and behavioral finance, practising trader since 2013, founder of arapov.trade, author of a trading book series (Open Library ), (ORCID: 0009-0003-0430-778X ).