The economic calendar is an indispensable tool for traders and investors, containing the schedule of important macroeconomic data releases, central bank decisions, and corporate reports. Understanding how to work with the calendar enables forecasting market volatility and making informed trading decisions.
Financial markets react sensitively to economic news. Even small deviations from forecasts can cause sharp price movements in stocks, currencies, and commodities. The economic calendar helps prepare for these events in advance, minimizing surprises. To understand this topic more deeply, I recommend studying macroeconomic indicators.
Economic Calendar Structure
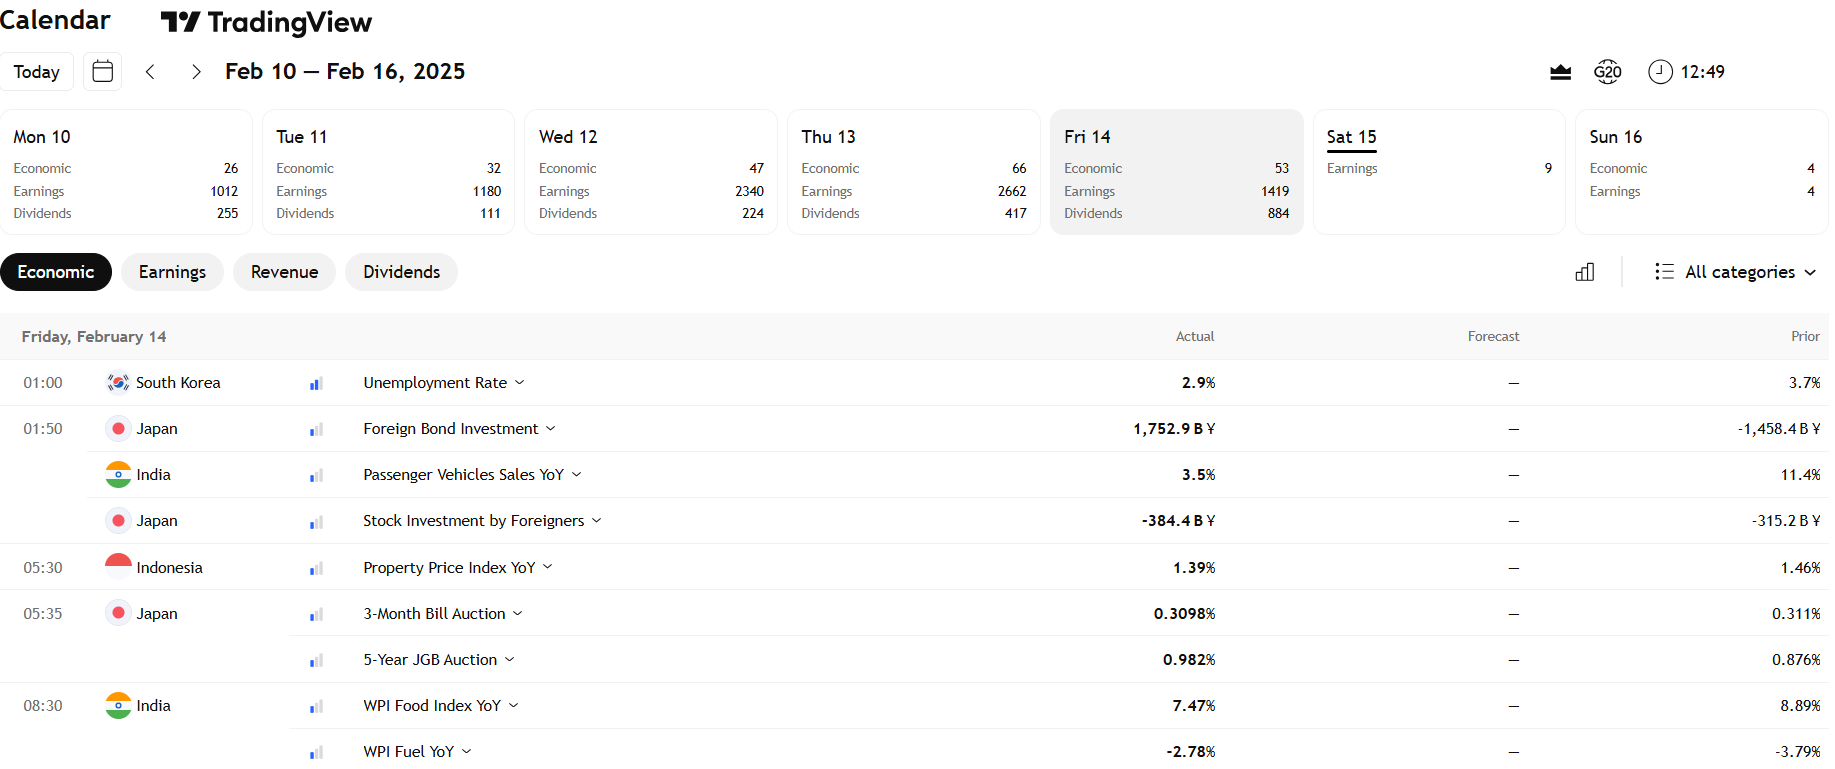
The calendar is presented as a table with several key parameters. Date and time show when data is published. Country indicates which economy is affected by the event. Event name describes the specific indicator or decision.
Actual value appears at publication time and is compared with analyst forecasts. Previous value shows data from the prior period, allowing assessment of change dynamics. Importance level is marked by color or stars.
High-importance events — central bank decisions, GDP data, inflation, employment reports — cause maximum volatility. Medium and low importance events affect the market less significantly but can reinforce existing trends.
Key Calendar Events
Central bank interest rate decisions are among the most significant events. The Fed, ECB, Bank of England determine borrowing costs, affecting economic activity. Rate hikes typically strengthen the currency but negatively impact stock indices .
NFP (Non-Farm Payrolls) is the US non-agricultural employment report published every first Friday of the month. This is one of the most volatile releases, causing sharp movements in forex and stock markets.
Inflation data (CPI, PPI) shows price growth and affects monetary policy expectations. High inflation may force central banks to raise rates, which is negative for stocks. GDP reflects overall economic condition and growth prospects.
Corporate earnings from major companies — quarterly results from Apple, Amazon, Tesla — significantly impact sector indices. Exceeding revenue and profit forecasts supports stock growth, missing expectations triggers decline.
News Trading Strategies
News trading requires understanding market psychology and quick reaction. Several approaches exist. Pre-news trading is based on expectations — the trader takes a position in the forecast direction.
Post-news trading involves entering after determining movement direction. The trader waits 3-5 minutes while the market digests the data, then enters in the impulse direction. This reduces risk but decreases potential profit.
Retracement trading uses the correction after initial movement. Price often returns to support and resistance levels or Fibonacci levels , providing a favorable entry point.
Catching false breakouts is an aggressive strategy. Initial movement after news sometimes proves deceptive, and price reverses sharply. Experienced traders recognize such situations by volume and enter against the crowd.
News Trading Risks
Slippage is a significant risk in news trading. Orders execute at worse prices due to rapid market movement. Limit orders partially solve this problem but may not fill at all.
Spread widening occurs when important data is published. The bid-ask difference increases several times, making entry and exit more expensive. Account for this when calculating stop-losses .
High volatility creates both opportunities and risks. Price can move chaotically, triggering stop orders before the main movement begins. Risk management is critically important during publication periods.
Common Trader Mistakes
Entering immediately after publication without confirmation is a common mistake. In the first seconds, the market can move chaotically, and premature entry leads to losses. Wait for clear direction formation.

Too tight stop-loss gets triggered by widened spreads or volatility before the main movement begins. Set stops accounting for average true range (ATR) and current volatility.
Lack of trading plan leads to emotional decisions. Before entering, determine entry point, stop-loss, take-profit, and event development scenarios. A trading plan disciplines and protects from impulsive trades.
Misinterpreting data is another trap. Good numbers don't always cause growth if expectations were even higher. Compare actual with forecast and consider context. Psychological stability helps avoid panic.
Choosing a Quality Calendar
A quality economic calendar updates in real-time and contains forecasts from leading analytical agencies. Filtering capability by country, importance level, and event type simplifies work.
Popular resources: Investing.com offers a convenient interface and mobile app. Forexfactory is oriented toward Forex Market traders. Trading Economics contains deep macroeconomic analysis. Bloomberg is a professional tool for institutional investors.
Notification function prevents missing important publications. Set up push notifications or email alerts for high-importance events. Combine the calendar with technical and fundamental analysis.
Frequently Asked Questions
An economic calendar is a tool containing the schedule of important macroeconomic data releases, central bank decisions, and corporate reports for trading planning.
Most important events: central bank rate decisions, GDP data, inflation (CPI), employment reports (NFP), corporate earnings from major companies.
Several strategies exist: trading before the news on expectations, entering after publication following impulse direction, trading on retracement, catching false breakouts.
Markets react not to absolute values but to deviation from forecast. Exceeding expectations is positive for the asset, missing expectations is negative.
Typical mistakes: entering immediately after publication, too tight stop-loss, ignoring spread widening, lack of trading plan.
About the Author
Author: Igor Arapov — independent researcher in trading psychology and behavioral finance, practising trader since 2013, founder of arapov.trade, author of a trading book series (Open Library ), (ORCID: 0009-0003-0430-778X ).