Price action around key levels defines much of what happens in financial markets. Traders worldwide watch support and resistance zones, anticipating breakouts that signal new trends. Yet markets frequently deceive participants through false breakouts — temporary moves beyond significant levels that quickly reverse, trapping traders in losing positions. To understand this topic more deeply, I recommend studying the breakout strategy.
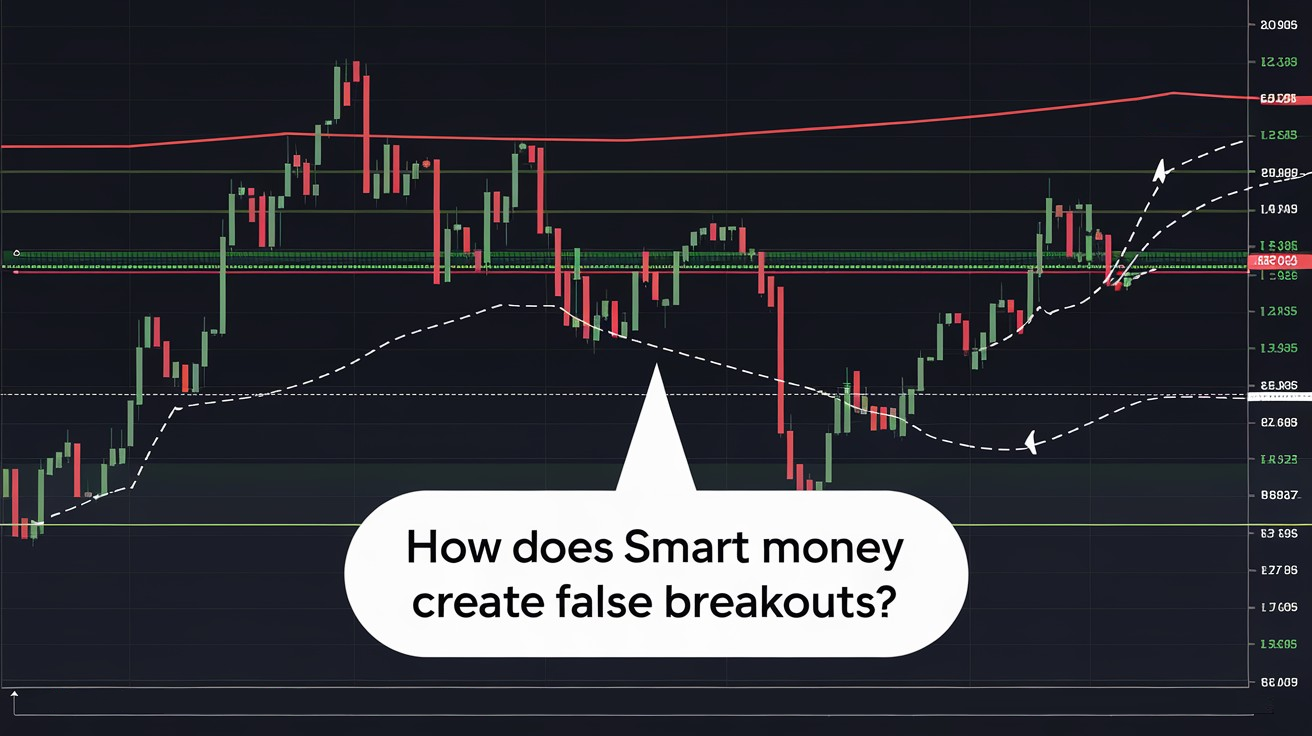
A false breakout occurs when price temporarily breaches a technical level, creating the appearance of a legitimate move, only to reverse sharply back into the prior range. This phenomenon represents one of the most effective tools institutional players use to accumulate liquidity before initiating substantial directional moves. Understanding this mechanism separates consistently profitable traders from those who repeatedly fall victim to market manipulation.
The Institutional Logic Behind False Breakouts
Financial markets operate as zero-sum environments where capital flows between participants. Institutional investors manage enormous positions requiring significant liquidity for execution. Retail traders, conversely, work with smaller accounts and typically follow standardized technical analysis approaches. This asymmetry creates predictable crowd behavior that sophisticated players exploit systematically.
Most retail traders place stop orders in identical zones — directly beyond obvious support and resistance levels. Large market participants understand this tendency perfectly and use it to achieve their objectives. Knowledge of typical retail mistakes becomes the foundation for constructing manipulation schemes that extract capital from less sophisticated participants.
Liquidity grab through false breakouts allows institutions to obtain better prices for large position entries. Rather than pushing the market against themselves with massive orders, they trigger stop orders from retail participants. This provides necessary volume for position building without significantly moving price. The mechanism works because most traders follow identical technical analysis rules, creating concentrated liquidity pools at predictable locations.
Psychological factors amplify manipulation effectiveness. Traders experience fear of missing profitable moves and rush to enter positions on breakouts without proper confirmation. Emotional decisions lead to systematic losses and fuel the manipulation mechanism that benefits Smart Money. Overcoming these psychological traps requires discipline and deep understanding of market structure.

Categories of False Breakouts
Spike breakout occurs when price sharply moves beyond a level and immediately reverses. Such moves often span only one or two candles and feature high velocity. They typically appear during major economic news releases or low liquidity periods. Traders who entered on the breakout receive instant losses as their stop orders trigger. Recognizing this manipulation type requires careful observation of volume behavior during the move.
Extended false breakouts represent more sophisticated constructions. After moving beyond the level, price holds in the new zone temporarily, simulating successful breakout confirmation. Market participants who waited for validation begin entering positions. The reversal occurs precisely at this moment, inflicting maximum damage on the most cautious traders. Holding duration varies from several minutes to multiple trading sessions.
Sequential false breakouts form during accumulation or distribution phases by large players. Price repeatedly tests the level from both sides, creating successive traps. Each such excursion collects fresh liquidity, preparing the foundation for powerful directional movement. Recognizing this pattern allows identification of institutional capital intentions and preparation for the genuine move. I also recommend studying the Smart Money Traps for the full picture.
Complex false breakouts combine elements from previous types. Price breaks the level, pulls back for level retest, confirms the breakout and continues moving — only to completely reverse later. Such patterns deceive even experienced traders who waited for all classical confirmations. Protection against this manipulation type requires comprehensive market context analysis.
Market Conditions Favoring Manipulation
Periods of heightened uncertainty create ideal environments for false breakouts. Anticipation of important economic releases provokes participant nervousness and increases vulnerability to manipulation. Central bank decisions regarding interest rates, employment reports, and inflation data traditionally accompany anomalous activity near key levels. Traders should exercise increased caution during these periods.
Transitions between trading sessions feature temporary liquidity reduction. Asian, European, and American sessions overlap with varying intensity, forming windows of heightened vulnerability. Large players actively exploit these intervals for conducting stop hunting operations with minimal cost. The first and last hours of each trading session prove particularly dangerous.
Extended consolidation inevitably concludes with price exiting the range. Before genuine movement, institutional capital conducts a series of false breakouts, clearing the market of weak positions. The longer consolidation zone persists, the more false breakout attempts precede the real exit. Patience becomes a crucial advantage in such conditions.
Holiday periods and financial quarter endings provide additional manipulation opportunities. Reduced activity from major participants facilitates price movement for those remaining in the market. Derivatives expiration also provokes atypical movements near significant support and resistance levels. Understanding the market events calendar helps avoid the most dangerous periods.
Identifying Manipulative Price Action
Volume analysis provides the most important information about breakout authenticity. Genuine moves beyond levels accompany significant volume increases, confirming large capital participation. Absence of volume confirmation indicates potential manipulation and high probability of price return. Volume profile reveals zones of concentrated trading activity and helps forecast price behavior.
Movement speed following breakout serves as an additional indicator. Genuine breakouts develop confidently with gradually increasing momentum. False breakouts often feature either excessive sharpness or immediate fading after moving beyond the level. Analyzing temporal movement structure helps distinguish manipulation from organic breakouts.
Price reaction to the breakout zone provides key information. After genuine breakouts, resistance transforms into support, and price bounces upon retest. During false breakouts, price returns behind the level and continues moving in the opposite direction. Repeated testing without holding indicates manipulative movement character.
Candle structure in the breakout zone contains additional clues. Formation of reversal patterns — pin bars, engulfing candles, dojis — immediately following breakout signals high manipulation probability. Long candle wicks indicate price rejection of the new zone. Combining multiple reversal signals substantially increases forecast reliability.
Divergence between indicators and price movement provides valuable information. Discrepancy between price direction and oscillator readings at the breakout moment indicates weakening momentum. Absence of confirmation from indicators increases the probability of manipulative movement character. Comprehensive analytical approach ensures the best results.
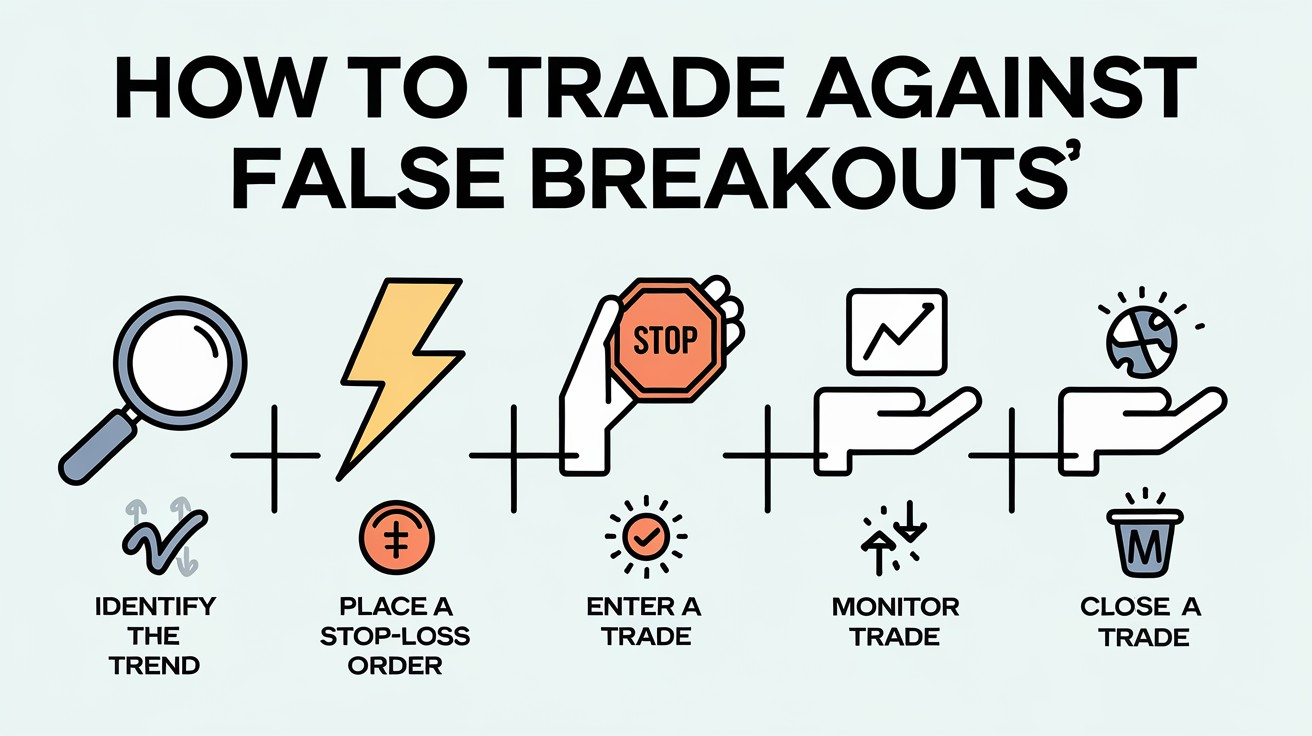
Strategies for Trading False Breakouts
The conservative approach involves waiting for breakout confirmation before position entry. Traders avoid entering on the breakout itself, instead waiting for candle close beyond the level and subsequent retest. This tactic reduces trade quantity but substantially improves their quality. Patience becomes the main competitive advantage when implementing this strategy.
Countertrend strategy uses false breakouts as entry points against the manipulation direction. After identifying a false breakout, traders open positions toward price return with tight stop orders beyond the false movement extreme. Risk to potential profit ratio in such trades often exceeds three to one. This strategy requires precise identification of manipulative movements.
The strategy of following large capital requires understanding institutional player logic. After false breakouts and liquidity collection, markets typically move opposite to the manipulation direction. Entry occurs after reversal confirmation, aiming to capture the main move. Market structure and liquidity zone analysis forms the foundation of this approach.
Combined approach merges elements from various strategies depending on market context. During high volatility conditions, priority goes to the conservative approach. With clear manipulation signs, countertrend tactics apply. Flexibility and adaptability determine trading success in dynamic market conditions.
Risk Management When Trading False Breakouts
Position size must account for heightened volatility in breakout zones. Reducing standard volume when trading near key levels is recommended. This allows surviving potential manipulation moves without critical deposit damage. Risk control per trade should not exceed two percent of trading capital.
Protective order placement requires non-standard approach. Classical recommendations prescribe placing stop losses beyond the nearest extreme, yet precisely these zones become manipulation targets. Safer tactics involve placing stops beyond zones with low liquidity concentration. Historical data analysis helps identify such zones.
Partial profit taking reduces psychological pressure. Closing a portion of the position upon reaching the first target ensures positive results even with unfavorable developments. Moving stop orders to breakeven after partial closing creates comfortable conditions for holding the remaining position.
Instrument diversification reduces dependence on individual trade outcomes. Trading false breakouts across various markets smooths losing streak periods on individual assets. Portfolio approach ensures more stable results over the long term.
Integrating False Breakout Analysis Into Trading Systems
Understanding false breakout mechanics must become an integral part of the trading process. Before opening any position near important levels, traders must evaluate manipulation probability. Analyzing historical price behavior in analogous situations provides valuable statistical information.
Maintaining a trade journal with false breakout documentation allows identifying patterns in their appearance on specific instruments. Different markets and assets demonstrate individual manipulation movement characteristics. Accumulated statistics becomes the foundation for trading system improvement and profitability enhancement.
Continuous learning and adaptation prove necessary for maintaining effectiveness. Manipulation methods evolve alongside technology development and market structure changes. Traders understanding current false breakout mechanics gain substantial advantage over participants using outdated approaches. For a more advanced understanding, check out Stop Hunting.
Systematic market structure analysis forms intuitive understanding of elevated manipulation risk zones. Over time, identifying potential traps becomes an automatic skill, allowing avoidance of losing trades and using large capital manipulations for personal benefit.
Frequently Asked Questions About False Breakouts
A false breakout is a temporary move of price beyond a significant support or resistance level, followed by a quick return to the original range. This movement creates the illusion of a new trend starting, provoking traders to enter losing positions.
Institutional players use false breakouts to collect liquidity (stop orders from retail traders), create emotional pressure on the market, and obtain favorable prices for entering large positions before the main move.
Key signs of a false breakout: lack of volume increase during the breakout, quick price return to the range within 5-10 candles, formation of reversal candlestick patterns, indicator divergences, and failure to hold beyond the level.
False breakouts are most likely before major news releases, during session transitions between trading venues, during extended consolidation periods, and during holidays and derivatives expiration.
Main strategies include: waiting for breakout confirmation and level retest, entering in the opposite direction after identifying manipulation, analyzing volumes and candlestick patterns for confirmation, using tight stop orders beyond the false movement extreme.
About the Author
Author: Igor Arapov — independent researcher in trading psychology and behavioral finance, practising trader since 2013, founder of arapov.trade, author of a trading book series (Open Library ), (ORCID: 0009-0003-0430-778X ).