Financial Market Terms Glossary: Complete Guide for Traders
Introduction to Financial Markets
Financial markets serve as the backbone of the global economic system, facilitating capital flow between participants. Every day, millions of investors and traders execute transactions across various venues. Mastering professional terminology opens pathways to informed trading in stocks, currencies, cryptocurrencies, and derivatives. This glossary helps beginners establish a solid knowledge foundation. To understand this topic more deeply, I recommend studying Trading Basics.
Structure of Global Financial Markets
The worldwide financial system comprises several interconnected segments. Each segment operates under its own rules and exhibits unique characteristics. Understanding this structure helps traders choose optimal directions for investment.
The securities market encompasses exchange-traded stocks, bonds, and exchange-traded funds. Leading global exchanges including NYSE, NASDAQ, LSE, and TSE provide transparent mechanisms for executing trades. Investors acquire ownership stakes in companies through stock purchases, receive fixed income through bonds, and build diversified portfolios through ETFs. Regulated exchanges guarantee participant rights protection and fair price discovery.
The foreign exchange market, commonly known as Forex, stands as the largest segment by trading volume. Daily turnover exceeds 6.5 trillion dollars. Major participants include central banks, commercial institutions, investment funds, and retail traders. Trading occurs in currency pairs around the clock five days per week.
The cryptocurrency sector has grown rapidly, offering digital asset trading without geographical restrictions. Platforms like Binance, Coinbase, and Kraken operate continuously. Bitcoin, Ethereum, and other cryptocurrencies attract various participants. Elevated volatility creates both profit potential and substantial risks.
The commodities market facilitates trading in physical resources and raw materials. Oil, natural gas, precious metals, and agricultural products trade on specialized venues. The Chicago Mercantile Exchange serves as the largest center for commodity operations. This segment maintains close ties to macroeconomic cycles and geopolitical events.
The derivatives market offers instruments for risk management and speculative trading. Futures, options, and contracts for difference enable profit generation from price fluctuations without owning the underlying asset. Using leverage amplifies both potential profits and possible losses.
Core Functions of Financial Markets
An effective financial system performs critically important tasks for the economy. Properly functioning markets promote economic growth and societal prosperity.
Providing liquidity allows participants to quickly convert assets into cash. Highly liquid markets feature narrow spreads, reducing transaction costs. Liquidity proves especially important for large institutional investors.
Price discovery occurs through the interaction of supply and demand. Millions of transactions establish fair market value for each asset in real time. This mechanism aggregates information and expectations from all participants.
Capital raising gives companies the ability to finance growth through stock and bond issuance. Initial public offerings IPO open access to funds from a broad investor base. Efficient capital markets direct resources toward the most promising projects.
Risk distribution occurs through derivative instruments. Hedging protects portfolios from adverse price movements. Insuring market risks has become standard practice for corporations and investors alike.
Market Participant Categories
Various groups with different objectives and strategies operate in financial markets. Their interaction creates price movement dynamics.
Retail traders work with personal capital, applying technical and fundamental analysis. Modern platforms provide market access from virtually anywhere in the world. Private traders constitute a significant portion of volume in cryptocurrency and forex markets.
Institutional investors manage large portfolios on behalf of clients. Pension funds, insurance companies, and investment banks operate with billions of dollars. Their decisions can move markets and shape long-term trends.
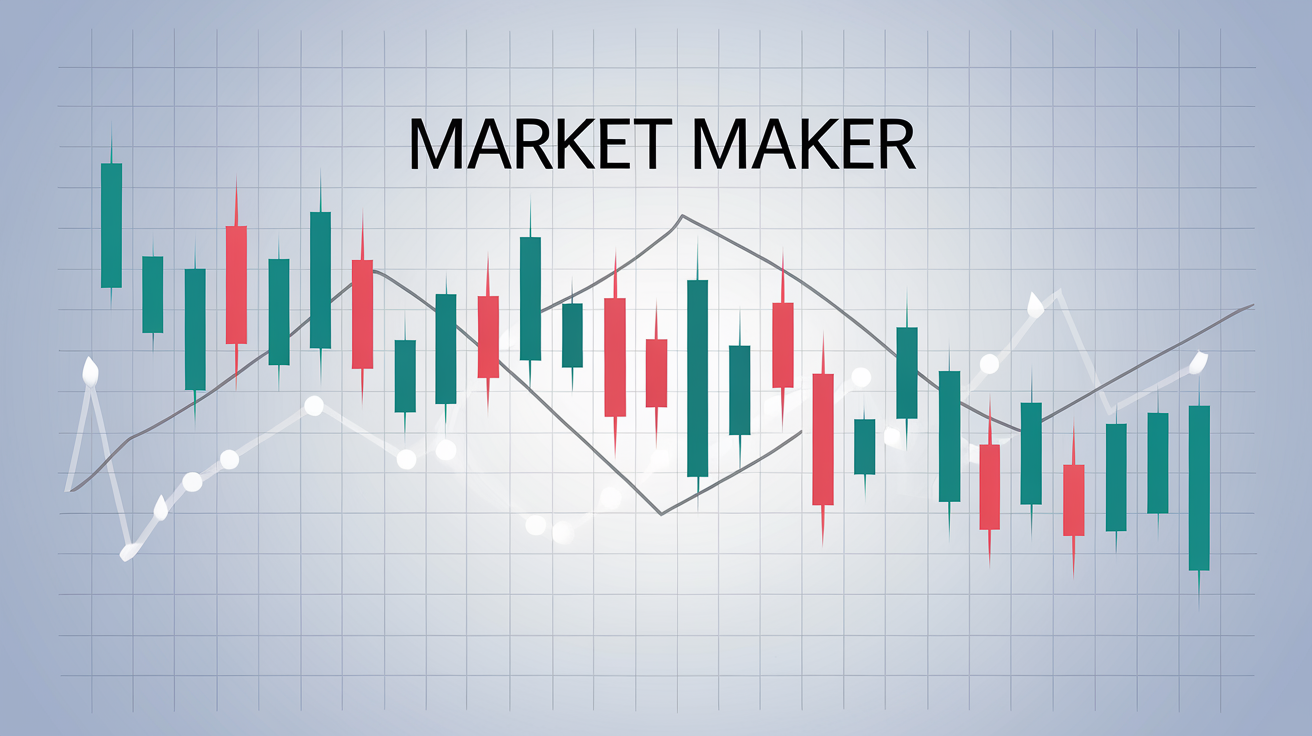
Market makers provide liquidity by continuously posting buy and sell orders. Their profit derives from the spread between quotes. Without market makers, many markets would lose efficiency.
Hedge funds employ sophisticated strategies to generate returns regardless of market direction. They utilize leverage, short selling, and derivatives. Some funds specialize in arbitrage, others in macroeconomic bets.
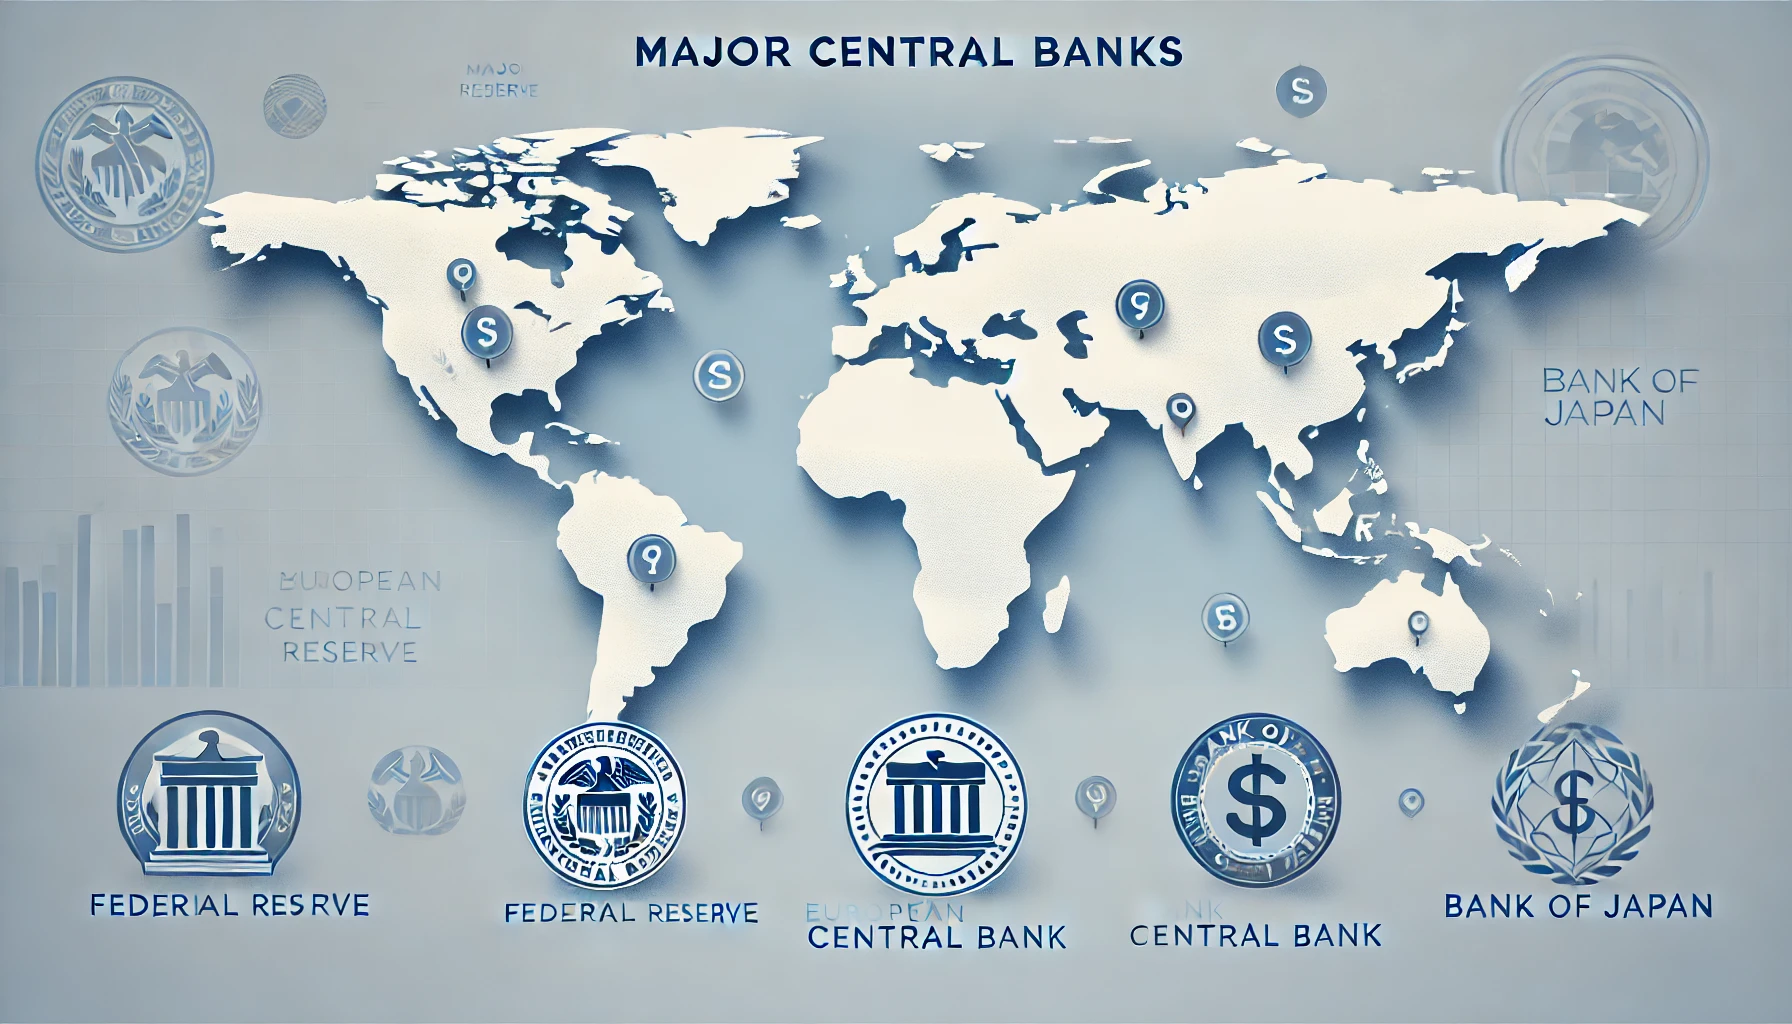
Central banks regulate monetary policy, influencing interest rates and national currency exchange rates. Their decisions create volatility across all market segments. Traders closely monitor statements from Fed, ECB, and other regulator representatives.
Essential Stock Market Terminology
A stock represents an ownership share in a company. Shareholders receive rights to a portion of profits through dividends and participation in governance through voting. Common shares grant voting rights, while preferred shares provide priority in dividend distribution.
A bond is a debt instrument. The issuer commits to paying the holder face value plus interest income at established dates. Government bonds are considered least risky, while corporate bonds offer higher yields.
A stock index reflects the average change in value of a group of stocks. The S&P 500 includes 500 of the largest American companies, while NASDAQ Composite focuses on the technology sector. Indices serve as benchmarks for evaluating portfolio performance.
Market capitalization is calculated by multiplying share price by the number of outstanding shares. This metric determines company size and market influence. Companies are classified as large-cap, mid-cap, and small-cap.
ETFs combine multiple assets into a single tradable instrument. Funds may track indices, sectors, commodities, or proprietary strategies. Low fees make ETFs attractive for passive investors.
Forex Market Terminology
A currency pair consists of a base currency and a quote currency. EUR/USD shows the value of the euro in US dollars. Major pairs include the dollar and trade with the narrowest spreads.
A quote displays the current price of a currency pair. A value of 1.1000 means one euro costs 1.10 dollars. Quotes update continuously throughout the trading session.
A lot determines trade volume. A standard lot equals 100,000 units of the base currency, a mini lot comprises 10,000 units, and a micro lot contains 1,000 units. Lot size selection affects both risk and potential profit.
The spread represents the difference between the buy price (Ask) and sell price (Bid). Narrow spreads characterize highly liquid pairs and indicate quality trading conditions.
Leverage allows traders to control amounts exceeding their deposit. Leverage of 1:100 means controlling $100,000 with a $1,000 deposit. High leverage amplifies both profits and losses.
A swap is a fee for carrying a position overnight. The size depends on the interest rate differential between currencies in the pair. Positive swaps generate income, while negative swaps are deducted from the account.
Types of Trading Orders
A market order executes immediately at the current price. It guarantees execution but the price may differ from expected during high volatility. Used when speed of entry matters most.
A limit order activates only when the specified price is reached. It allows entering positions at desired rates but does not guarantee execution.
A stop order converts to a market order when the trigger price is reached. Used for limiting losses or entering on level breakouts.
A trailing stop automatically follows price at a set distance. It protects accumulated profit during trend reversals.
A stop-loss closes a position when maximum allowable loss is reached. It forms the foundation of risk management in any strategy.
A take-profit locks in gains when the target price is achieved. It ensures planned profits are captured even when the trader is away.
Technical Analysis and Its Tools
Technical analysis relies on studying historical price and volume data. Core principles include all information being reflected in price, price movement following trends, and pattern repeatability. Analysts use charts and indicators to forecast future movements.
Candlestick charts display open, close, high, and low prices for each period. Japanese candlesticks form patterns signaling potential reversals or trend continuation.
Support and resistance levels mark zones of buyer and seller concentration. Price often bounces from these levels or breaks through them with acceleration.
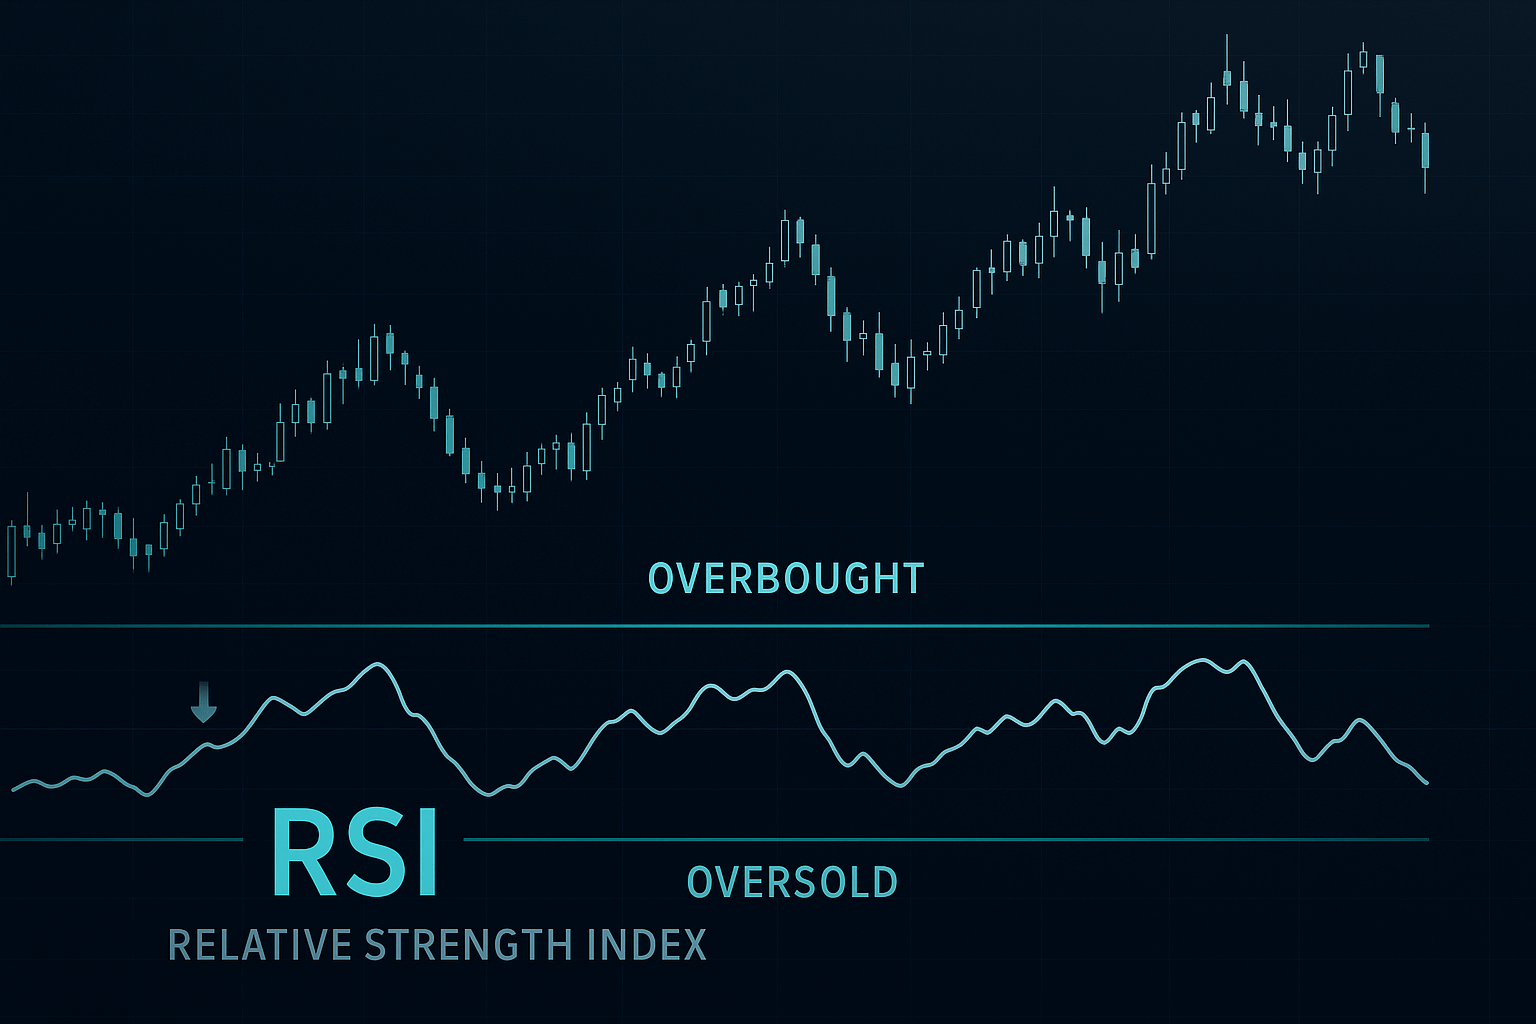
The RSI indicator measures relative asset strength. Values above 70 indicate overbought conditions, below 30 suggest oversold conditions.
Moving averages smooth price fluctuations, highlighting the trend. Crossovers between fast and slow averages generate trading signals.
MACD shows the relationship between moving averages. Divergence between the indicator and price warns of potential reversal.
Fibonacci levels identify potential correction and trend continuation zones. Values of 38.2%, 50%, and 61.8% often serve as reversal points.
Fundamental Analysis Basics
Fundamental analysis evaluates fair asset value based on economic and financial indicators. Long-term investors rely on this method to identify undervalued opportunities.
Gross domestic product reflects a country's economic health. GDP growth strengthens the national currency and stock market.
Central bank interest rates affect borrowing costs and currency attractiveness. Rate increases typically strengthen the currency by attracting yield-seeking capital.
Inflation reduces money's purchasing power. High inflation forces central banks to tighten policy, impacting all asset classes.
Corporate reports reveal company financial health. Revenue, net profit, and profitability affect stock prices and credit ratings.
Trading Strategies
Scalping involves numerous short trades with small profits. It requires intense concentration and rapid order execution. Scalpers complete dozens of trades per session.
Day trading limits positions to a single trading day. Traders avoid overnight risk by closing all positions before session end.
Swing trading holds positions from several days to weeks. The strategy capitalizes on medium-term price swings within trends.
Position trading targets long-term trends. Positions are held for months, sometimes years, following fundamental changes.
Algorithmic trading employs software systems for automated strategy execution. High-frequency trading executes thousands of operations per second, exploiting microscopic price inefficiencies.
Risk Management
Sound capital management determines long-term market success. The one-percent rule limits risk per trade to a small portion of the deposit.
Diversification distributes capital among different assets and markets. Losses in one segment are offset by gains in another, reducing overall portfolio volatility.
Risk-to-reward ratio evaluates trade potential. A minimum acceptable ratio is considered 1:2 or 1:3, where potential profit exceeds risk.
Psychological discipline matters as much as technical skills. Emotional decisions often lead to losses. A trading plan helps maintain objectivity in stressful situations.
Practical Tips for Beginners
Start by exploring a demo account to master the platform without risking real money. Practice with virtual funds until you develop a consistent approach. To consolidate this material, also study: starting trading.
Maintain a trading journal, recording every trade with entry and exit rationale. Error analysis accelerates learning and develops discipline.
Choose one market and one timeframe to start. Specialization allows deeper understanding of specific instrument behavior.
Never risk funds whose loss would be critical. Trade only with disposable capital you can afford to lose.
Continuously improve your knowledge. Financial markets evolve, new instruments and strategies emerge. Successful traders learn throughout their careers.
Frequently Asked Questions
A financial market is a global ecosystem where participants exchange capital through various instruments: stocks, bonds, currencies, cryptocurrencies, and derivatives. Daily transaction volumes reach trillions of dollars.
The stock market is designed for trading securities (stocks, bonds, ETFs) on regulated exchanges. Forex is a decentralized currency market with 24-hour trading of currency pairs and daily turnover exceeding 6 trillion dollars.
Leverage allows traders to control amounts exceeding their deposit. For example, 1:100 leverage means controlling $100,000 with a $1,000 deposit. Leverage amplifies both potential profits and possible losses.
Technical analysis studies historical price and volume data to forecast movements. Fundamental analysis evaluates fair asset value based on economic indicators, financial reports, and macroeconomic factors.
Beginners are recommended to start with swing trading or position trading. These strategies require less screen time, allow for deliberate decision-making, and reduce emotional impact. Day trading and scalping require experience and high psychological resilience.
About the Author
Author: Igor Arapov — independent researcher in trading psychology and behavioral finance, practising trader since 2013, founder of arapov.trade, author of a trading book series (Open Library ), (ORCID: 0009-0003-0430-778X ).