Imbalance in Trading: Complete Guide to Supply and Demand Imbalance
Imbalance in trading represents a disproportion between market supply and demand that causes uneven liquidity distribution and significant price movement in one direction. This phenomenon plays a crucial role in trend formation, volatility, and asset behavior across financial markets worldwide. Understanding imbalance mechanics provides traders with substantial advantages when analyzing market conditions and making trading decisions across any timeframes. To gain a deeper understanding of this topic, I recommend studying the complete guide to Imbalance and FVG.
Market imbalance enables traders to find optimal entry and exit points, forecast price movements based on large orders from institutional market participants. Applying imbalance in Smart Money strategies, order flow analysis, and volume profile allows adaptation to real market structure and trading in the direction of large capital rather than against it. This approach significantly increases profitable trade probability.
What is Imbalance and How it Forms
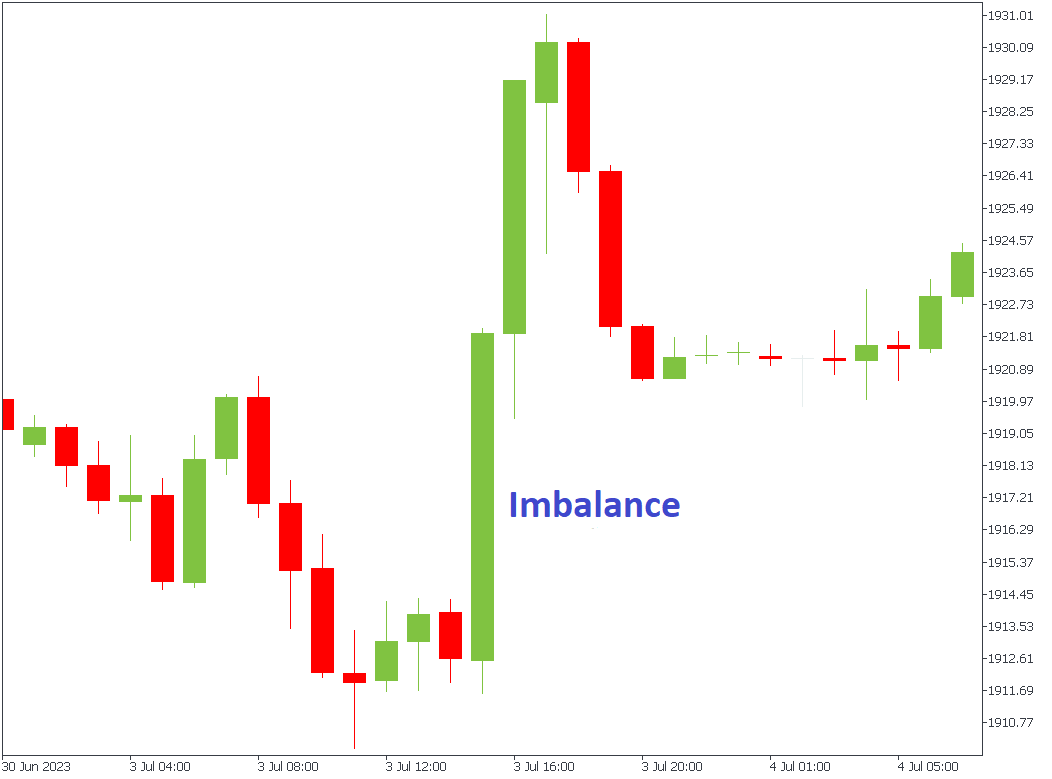
Imbalance forms as the difference between buying and selling volumes at specific price levels or trading time intervals. Buyer demand or seller supply dominance creates uneven liquidity distribution with subsequent impulsive price movements in one direction. This disproportion serves as a reliable indicator of large market participant activity and their intentions regarding future price direction.
Institutional traders cannot place large orders instantly without significantly impacting market price of trading assets. They create artificial movements to mask their true intentions and gradually accumulate positions in high liquidity zones. Understanding this mechanics allows retail traders to follow institutional actions and avoid typical traps created by large market players.
Types of Market Imbalance
Local imbalance represents short-term disruption of supply and demand balance in financial markets. It leads to sharp price movement but quickly compensates through subsequent orders from other market participants. This imbalance type characterizes intraday trading, scalping, and short-term strategies on lower timeframes.
Structural imbalance means long-term dominance of one market side over another throughout significant trading periods. It forms sustained trends and serves as the primary market dynamics indicator for positional traders and long-term investors. Structural imbalance matters for determining global price direction and forming long-term positions.
Liquidity imbalance occurs when large players use their liquidity for market manipulations, creating false breakouts or sharp movements to collect retail trader stop-orders. This manipulation type requires special attention when analyzing market structure and determining true Smart Money intentions.
Tools for Identifying Imbalance Zones
Market Profile helps identify high liquidity concentration areas and significant support and resistance levels on price charts. This tool displays trading volume distribution across price levels over specific analysis periods. Traders actively use it to identify price acceptance zones and potential imbalance areas.
Delta Volume shows the difference between buyers and sellers, indicating dominance zones of one market side at specific levels. Positive delta indicates buyer dominance in the market, negative delta means seller dominance in trading. This indicator helps determine large capital movement direction and current trend strength.
Footprint Charts visualizes trades inside candles, revealing anomalous liquidity spikes and large institutional orders. This tool shows detailed volume distribution at each price level within trading time periods. Traders use footprint for precise identification of institutional interest zones and potential trend reversal points.
Order Flow analyzes order flows, showing market management mechanics by large participants in real-time trading. Order flow analysis reveals aggressive buying and selling, as well as limit order accumulation at key chart price levels. This method enables seeing market participant intentions before actual price movement.
Causes of Imbalance Formation
Fundamental factors include key economic data releases: gross domestic product, central bank interest rates, inflation levels, unemployment figures, consumer price index. This data significantly impacts supply and demand balance in financial markets and forms long-term asset movement trends.
Central bank decisions dramatically change market participant expectations and trigger sharp price movements across all world financial markets. Federal Reserve System, European Central Bank, Bank of England, and Bank of Japan statements form global trends and redistribute liquidity across different asset classes.
Technical factors relate to liquidity, large participant behavior, and algorithmic trading system operations. Low trading activity during night sessions, weekends, and holidays makes markets less balanced and more vulnerable to manipulations. Institutional investors, hedge funds, and large banks introduce large order volumes, creating short-term supply and demand imbalance.
High-frequency algorithmic strategies can suddenly withdraw liquidity from certain price levels, triggering sharp price spikes. Understanding algorithmic trading impact on market structure helps avoid false signals and large player manipulations. Before proceeding, familiarize yourself with the basics of technical analysis.
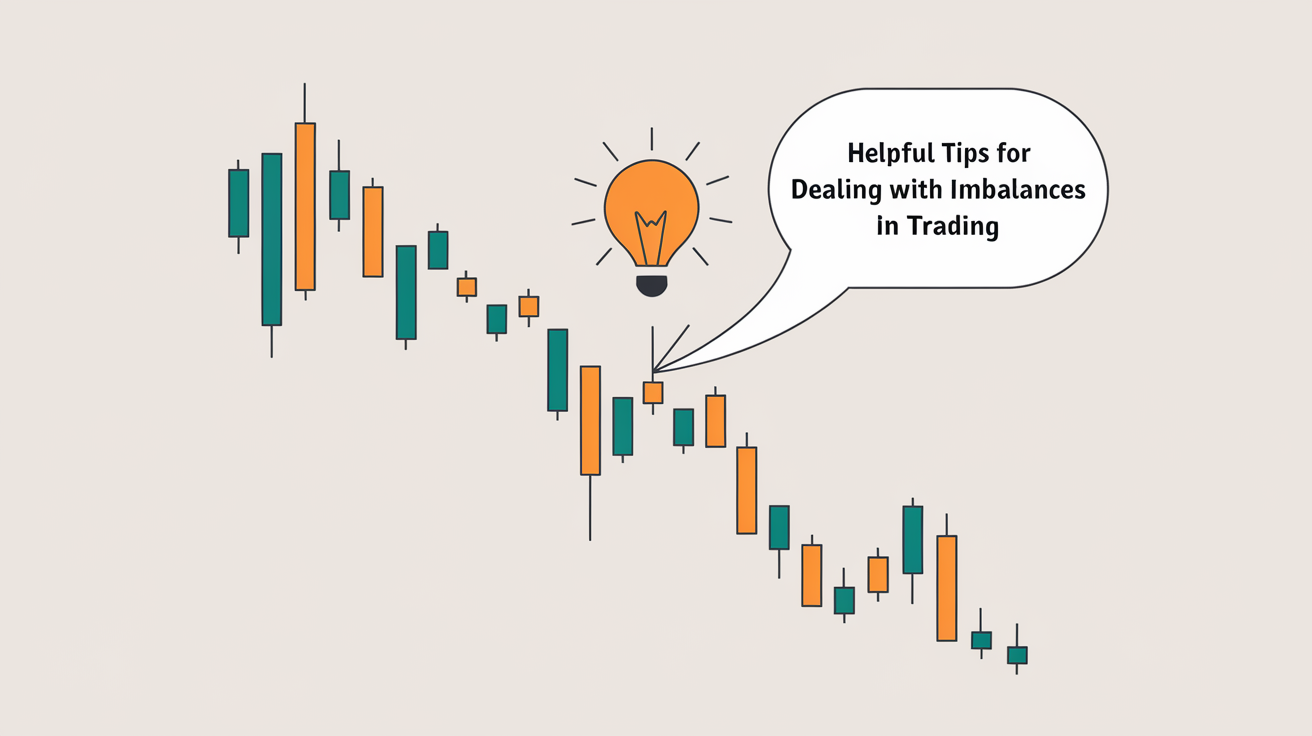
Imbalance Trading Strategies
When strong impulsive movement appears without significant corrections, an imbalance zone forms where price will likely return for level retest. Identify sharp movement areas without pullbacks, wait for price return to this zone, and look for confirming signals to open trading positions in trend direction.
Volume analysis through Volume Profile and Footprint Charts helps reveal significant imbalance areas on instrument price charts. Cluster analysis shows volume distribution across price levels, revealing key imbalance points and institutional interest zones for position entry.
Imbalance often forms after false breakouts of support or resistance levels by large market players. Smart Money knock out retail trader stop-orders before directing price in their desired movement direction. Identify key levels, wait for false breakouts with price return to range, then open positions in opposite movement direction.
Multi-Timeframe Analysis
Imbalance works more effectively when analyzing multiple timeframes to determine overall market structure and find optimal entry points with minimal risk. Higher timeframes show global imbalance zones and potential main trend reversals. Lower timeframes allow finding precise position entry moments with optimal risk to reward ratios.
Large players use imbalance to create false movements and collect retail trader liquidity before main price movements. Avoid entering markets based solely on sharp movements — confirmation through trading volumes, candlestick patterns, and overall market structure increases entry accuracy.
Risk Management
Imbalance-based trading involves elevated risk and requires competent capital and position management. Stop-loss placement occurs beyond imbalance zones at safe distances from entry points. Dynamic stop management involves moving to breakeven upon reaching first profit targets. Imbalance trades should maintain risk to reward ratios of at least one to two or one to three for loss compensation.
Volume analysis reveals zones with highest order accumulation and potential price resistance or support levels. Analyzing differences between buying and selling volumes identifies levels of potential sharp direction changes in price movement. Significant liquidity accumulation zones become key points for position entry and exit.
Conclusion
Imbalance in trading represents a powerful analytical tool for finding key market levels and forecasting further price movements with high accuracy. Supply and demand imbalance strategies help find high-probability entry and exit points for trading positions across various financial markets. To consolidate this material, also study candlestick patterns.
Smart Money actively use imbalance for market liquidity management through artificial breakouts, impulsive movements, and volume manipulations across different timeframes. Understanding these processes allows retail traders to avoid typical traps and trade in the direction of large market participants for profit maximization.
Frequently Asked Questions
Imbalance is a disproportion between market supply and demand causing uneven liquidity distribution and significant price movement in one direction.
Three main types exist: local imbalance (short-term), structural imbalance (long-term dominance), and liquidity imbalance (large player manipulations).
Imbalance zones are identified through Market Profile, Delta Volume, Footprint Charts, and Order Flow showing volume distribution and order flows.
After strong impulsive movement, unfilled liquidity remains in the imbalance zone. Markets seek balance, so price often returns for retests.
Identify sharp movement zones, wait for price return, find confirming signals, and open positions in trend direction with stop-loss beyond the zone.
About the Author
Author: Igor Arapov — independent researcher in trading psychology and behavioral finance, practising trader since 2013, founder of arapov.trade, author of a trading book series (Open Library ), (ORCID: 0009-0003-0430-778X ).