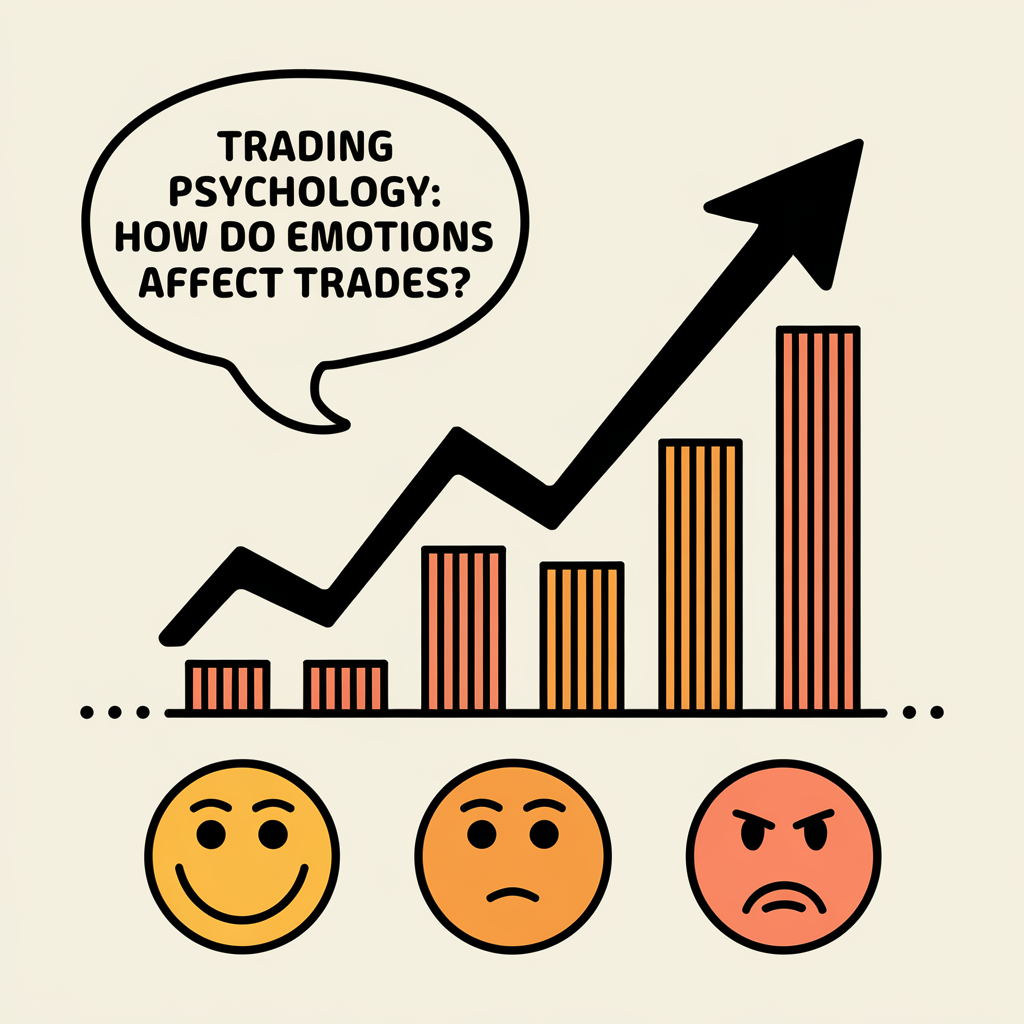
The Role of Volume in Trend Analysis
Volume analysis represents a methodology for assessing market activity through the lens of executed orders. Unlike price patterns alone, volume reveals the actual participation of institutional players and helps distinguish genuine movements from manipulations. Traders ignoring the volume component risk falling into false breakout traps and misinterpreting current movement strength.
Price-based chart analysis shows where the market is moving but fails to explain why. Volume fills this gap by demonstrating participant interest levels. High volume on impulse candles confirms large capital presence, while low volume during price movement signals potential instability and vulnerability to reversal.
The Smart Money concept is built on understanding that institutional participants leave traces in volume data. Position accumulation, distribution, and liquidity sweeps all reflect in characteristic volume patterns that traders can learn to recognize and incorporate into their decision-making process for trading in sync with major market players. To understand this topic more deeply, I recommend studying the Wyckoff Method.
Volume Confirmation Principles
Confirming Trend Movement
Healthy trends feature synchronized price and volume movement. In uptrends, volume should increase on impulse candles and decrease during corrections. This pattern indicates buyers control the situation while pullbacks represent temporary profit-taking without sentiment change.
Downtrends follow mirror logic: volume increases on falling candles and contracts during upward corrections. Sellers dominate while buyer attempts to reverse movement lack sufficient liquidity support, confirming the bearish scenario's sustainability. I also recommend studying trend movement for a complete picture.
Price-Volume Divergence
Discrepancy between price dynamics and volume serves as a leading signal of trend weakening. When price makes new highs but volume consistently declines, buyers are losing interest and reversal becomes probable. Similarly, new lows on falling volume indicate seller exhaustion.
Divergence does not mean immediate reversal but warns of increased caution necessity. Traders use this signal to tighten stop-losses or take partial profits while preparing for potential direction change.
Volume Analysis Toolkit
Volume Profile displays trading volume distribution across price levels, forming a horizontal histogram. Point of Control (POC) — the level with maximum volume — serves as a price attraction zone and often acts as dynamic support or resistance . High Volume Nodes (HVN) indicate consensus areas where the market spent significant time.
Delta Volume calculates the difference between aggressive buying and selling. Positive delta on rising candles confirms buyer strength; negative delta during price increases reveals hidden seller pressure. This tool proves especially valuable for identifying imbalances between visible price movement and actual force distribution.
Footprint Charts represent cluster analysis, demonstrating volume distribution within each candle. Traders see which price levels concentrated large orders, where absorption occurred, and which side dominated at specific moments.
VWAP (Volume Weighted Average Price) shows fair asset value for the session. Price above VWAP indicates buyer dominance; below signals seller control. Institutional participants frequently use VWAP as a benchmark for assessing large order execution quality.
OBV (On Balance Volume) accumulates volume based on candle closing direction. Rising OBV with rising price confirms the trend; divergence between OBV and price warns of possible reversal. The indicator proves particularly useful for analyzing long-term tendencies.
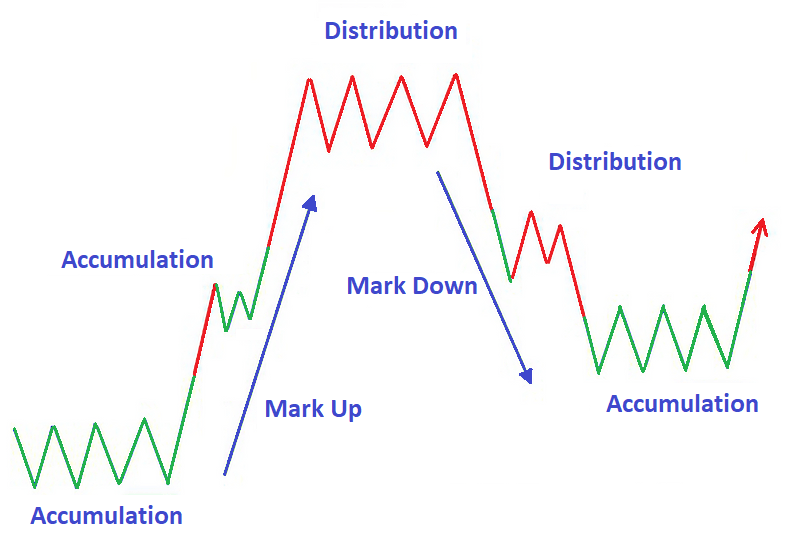
Volume Across Market Cycle Phases
Accumulation: Hidden Positioning
The accumulation phase features sideways price movement with gradually increasing volume. Smart Money builds positions through limit orders, avoiding sharp movements that might attract attention. Sporadic volume spikes without corresponding price reaction appear — a reliable sign of institutional accumulation.
Markup: Confirmed Movement
Range breakout accompanies sharp volume increase. Retail traders join the movement, amplifying momentum. Critically, volume must rise alongside price. If breakout occurred on low volume, high probability exists for false movement and return to range.
Distribution: Profit Taking
The distribution phase occurs at trend peaks. Volume remains high but price stops advancing — large players transfer positions to retail buyers. Candles with long upper wicks on elevated volume appear, signaling seller pressure.
Correction: Temporary Pullback
Corrective movements in healthy trends proceed on reduced volume. Market participants are not rushing to sell, expecting main direction continuation. Sharp volume increase during correction serves as a warning signal indicating possible trend change.
Identifying False Breakouts
A false breakout represents one of the common traps market makers use for liquidity collection. Price briefly moves beyond a key level, triggering stop orders, then rapidly returns to range. Volume analysis allows distinguishing true breakouts from manipulation.
True breakout signs: sharp volume increase at level breach, continued volume growth after breakout, absence of immediate price return. Consolidation above the broken level with elevated volume retest additionally confirms movement validity.
False breakout signs: low volume at level breach, instant price return to range, volume spike precisely at return moment — this represents absorption of trapped traders' orders. Strong opposite direction movement often develops after false breakouts.
Practical Application
Finding Entry Points
Optimal entries form when multiple volume signals align. POC level tests with subsequent volume growth indicate large participant interest in movement continuation. Resistance level breakout on high volume with positive delta confirms buyer strength.
Cluster analysis helps pinpoint entry levels more precisely. Large order concentration at specific prices creates zones of elevated reversal or continuation probability. Entries near such levels optimize risk-to-potential-reward ratios.
Determining Exit Points
Profit-taking signals emerge when volume support for trend weakens. Declining volume during continued price growth warns of potential reversal. Sharp volume spikes at extremes often mark movement culmination and large player position closing initiation.
Price-volume divergence serves as a leading signal for tightening stop-losses or partial position closure. High-volume candles with long wicks against the trend indicate opposite side activation and possible direction change.
Integration with Other Methods
Maximum effectiveness is achieved by combining volume analysis with technical analysis and Price Action study. Candlestick patterns confirmed by anomalous volume possess enhanced reliability. Support and resistance levels coinciding with high volume zones carry greater significance.
Order book analysis complements the volume picture with current order information. Large limit orders near key levels can serve both as position protection and price magnets. A comprehensive approach minimizes false signal impact and improves trading decision accuracy.
Understanding Smart Money strategies transforms volume data perception. Instead of blindly following the crowd, traders learn to recognize accumulation, distribution, and liquidation hunts — actions that leave characteristic traces in market volume profile.
Conclusion
Volume analysis transforms the approach to market reading by adding the dimension of actual participant activity to visual price patterns. Traders who master volume work gain advantages in identifying genuine movements, filtering false signals, and understanding institutional player actions across all financial markets.
Key volume confirmation principles: volume growth should accompany movement in trend direction, declining volume on corrections indicates temporary pullback nature, price-volume divergence warns of possible reversal. These patterns work across all timeframes and markets.
Developing volume analysis skills requires practice on historical data and gradual transition to live trading. Observing price reaction to volume zones and analyzing delta and clusters forms intuitive market mechanics understanding impossible to obtain from price charts alone. To reinforce this material, also study moving averages.
Integrating volume analysis into trading systems improves decision quality and reduces emotional influence. Objective liquidity distribution data serves as a filter for screening low-probability setups and focusing on trades with optimal risk-to-reward potential.
Frequently Asked Questions
Volume analysis is a methodology for assessing market activity based on executed orders. It helps determine price movement validity, identify liquidity zones, and understand institutional participants' intentions.
Strong trends feature rising volume during directional moves and declining volume on corrections. If price rises on falling volume, the trend is weakening and reversal becomes likely.
True breakouts feature sharp volume spikes and continued movement. False breakouts occur on low volume with quick price return to range — a market maker manipulation tactic.
Key tools include Volume Profile for price level distribution, Delta Volume for buy/sell balance, Footprint Charts for cluster analysis, VWAP for volume-weighted price, and OBV for cumulative volume.
POC is the price level with maximum trading volume for the period. It serves as a price magnet and often acts as dynamic support or resistance.
About the Author
Author: Igor Arapov — independent researcher in trading psychology and behavioral finance, practising trader since 2013, founder of arapov.trade, author of a trading book series (Open Library ), (ORCID: 0009-0003-0430-778X ).