Price shows where the market is heading. Volume shows who's behind the move. Without understanding volume, traders see only half the picture — they know direction but not the strength of the move or participant intentions. Volume analysis fills this gap, revealing real supply and demand behind every price movement.
However, volume data differs significantly between markets. Stock and futures markets provide different information, require different tools, and demand different interpretation approaches. Understanding these differences is key to effective volume analysis.
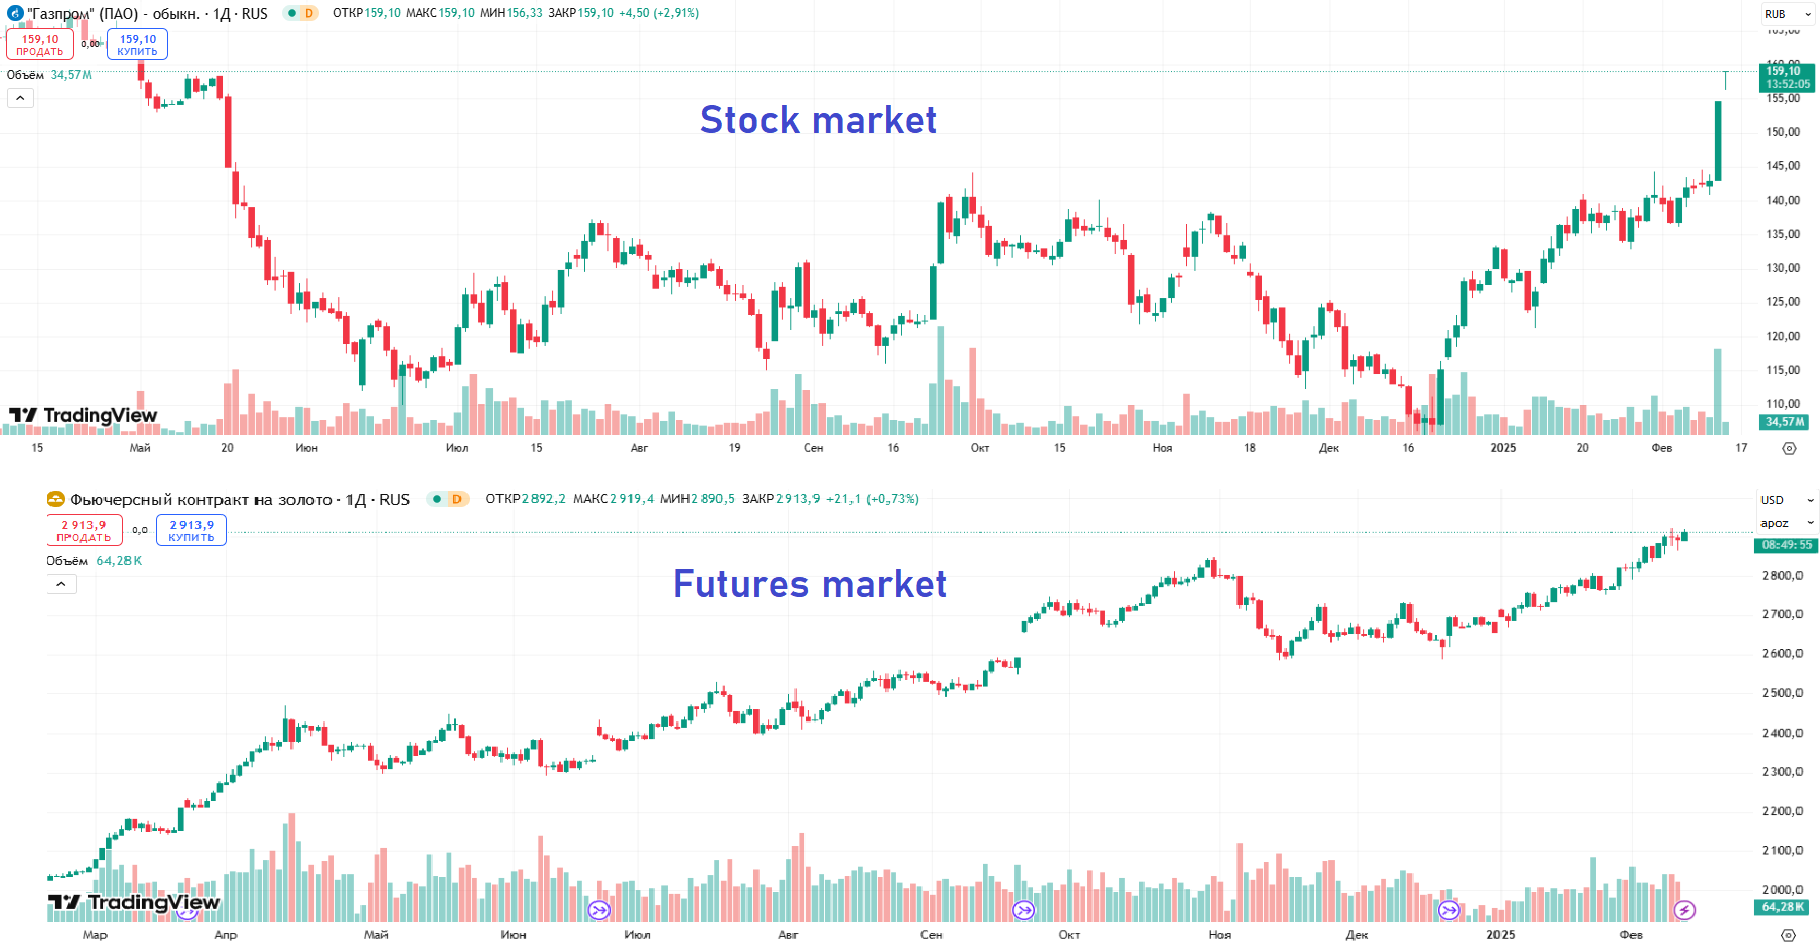
Structural Market Differences
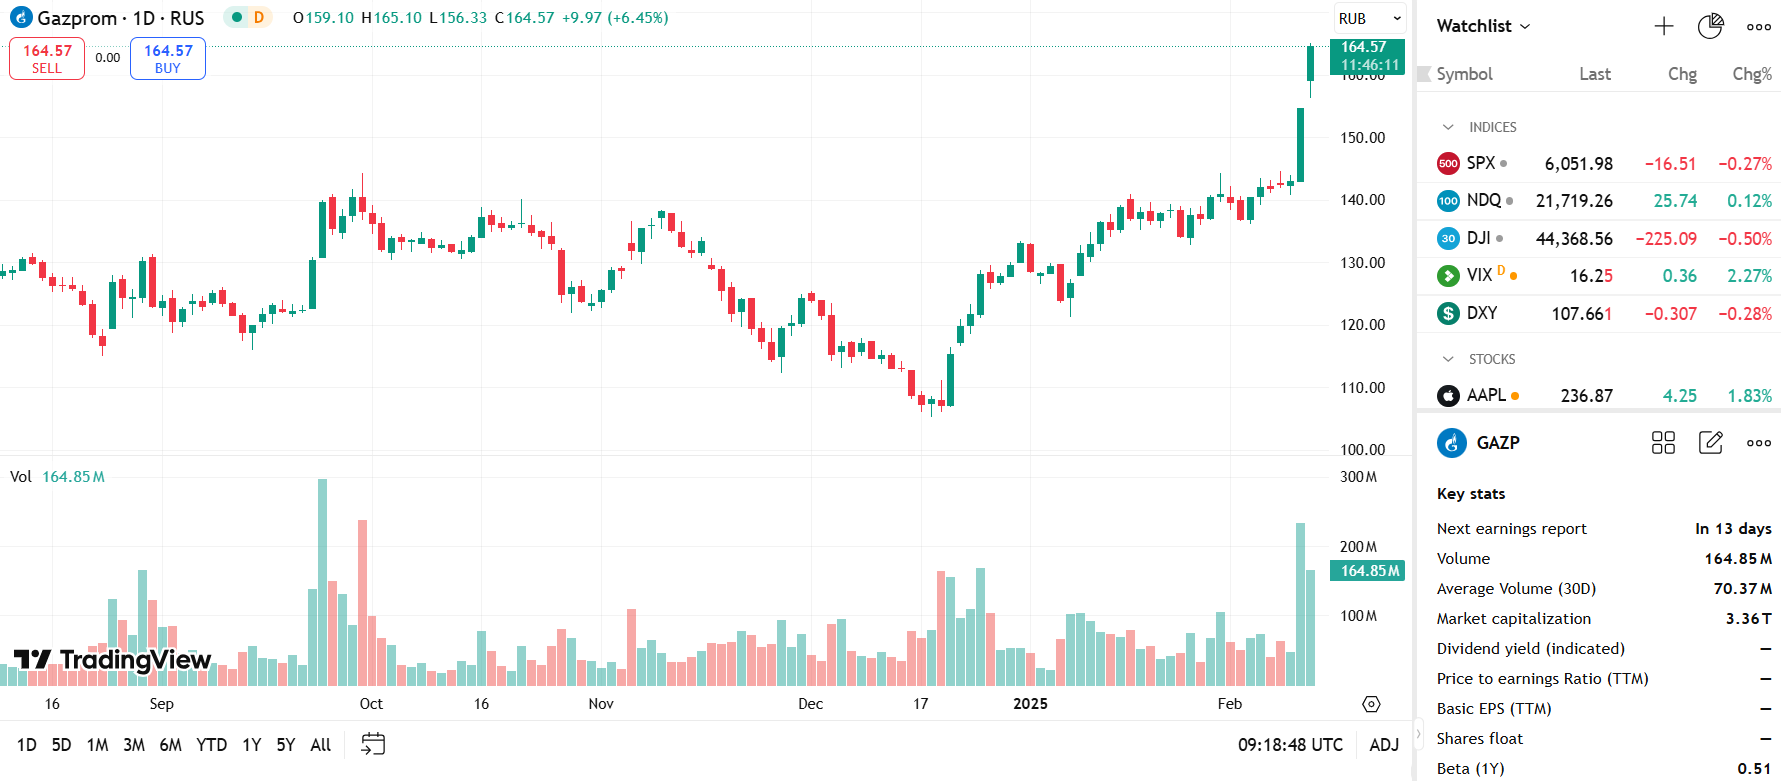
The stock market consists of thousands of individual stocks, each with its own liquidity. Apple and Microsoft trade millions of shares daily, while obscure companies might see only hundreds of transactions. Volume here represents actual shares traded — real transactions between participants. To understand this topic more deeply, I recommend studying derivatives.
The stock market's problem is fragmentation. A single stock trades on multiple exchanges plus through Dark Pools — off-exchange venues for large institutional trades. By various estimates, 30% to 40% of US equity volume passes through dark pools and isn't visible in real time. Traders see an incomplete picture.
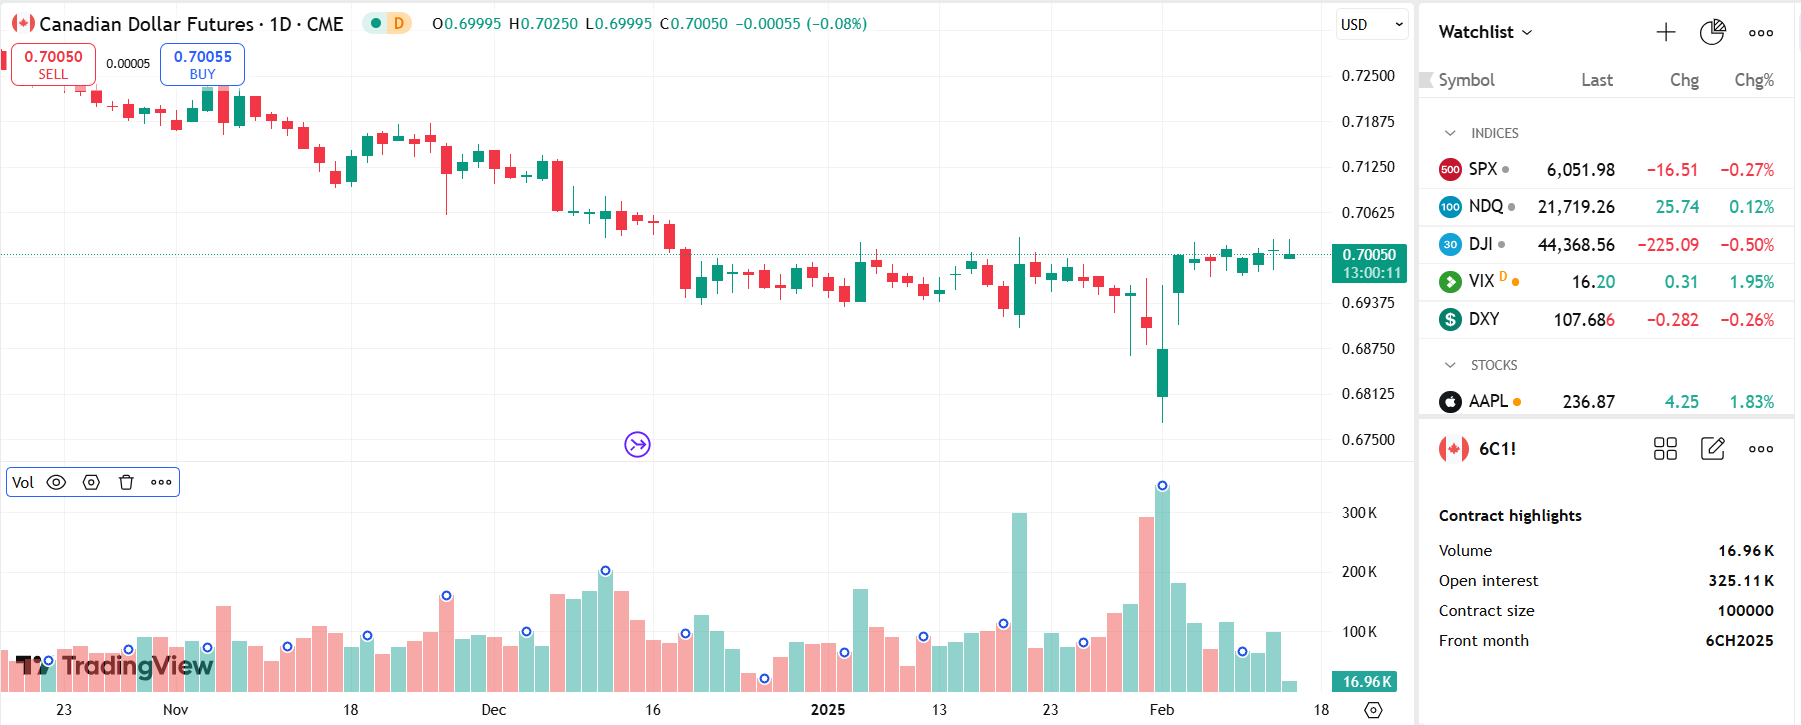
The futures market works differently. All contracts for a specific asset (like E-mini S&P 500) trade on one exchange — CME. No fragmentation, no hidden venues. Every trade goes through centralized clearing. This makes volume data significantly more transparent and reliable.
Available Stock Market Data
Trade Volume — the basic metric showing shares traded per period. High volume on rallies confirms buyer strength. Low volume on breakouts signals potential traps. But remember dark pools: actual volume may exceed what's displayed.
Tick Volume — number of price changes per period. Used in forex where centralized volume doesn't exist, but appears in stock analysis too. It's an indirect activity indicator not reflecting actual transaction counts.
VWAP (Volume Weighted Average Price) — volume-weighted average price. Institutional traders use it as a benchmark: buying below VWAP is considered favorable, above — expensive. Price often gravitates toward VWAP, especially mid-session.
Volume Profile — horizontal volume distribution across price levels. Shows where main trading occurred. The POC (Point of Control) level — price with maximum volume — often acts as a price magnet.
Futures Market Data
Futures provide everything stocks offer plus a unique metric — Open Interest. This is the count of open contracts not yet closed. Unlike volume showing activity, Open Interest reveals participant positioning.
Open Interest interpretation: rising OI with rising price means new buyers entering — trend confirmed. Falling OI with rising price — old shorts closing, no new longs — trend may be exhausting. This is a powerful tool for assessing move sustainability.
Delta Volume — difference between buying and selling volume by market orders. Positive delta means aggressive buyers dominate, negative — sellers. Cumulative Delta shows this difference accumulating, helping spot hidden pressure.
Footprint Chart details volume within each candle. You see not just how many contracts traded, but how they distributed across prices and who initiated — buyer or seller. It's a microscope for market structure analysis.
DOM (Depth of Market) — real-time order book. Shows limit orders for buying and selling. On futures, the DOM is informative because it displays actual orders without hidden volume (though iceberg orders exist).
Practical Application
In stock markets, volume serves as a filter. Resistance breakout on high volume — buy signal. Same breakout on low volume — likely trap. Volume Profile helps find accumulation zones where large players build positions. I also recommend studying the Wyckoff Method for the full picture.
In futures, volume lets you look deeper. Footprint shows how battle developed inside each candle. Delta reveals hidden pressure when price stands still but buyers or sellers accumulate strength. Open Interest confirms or refutes trends.
Stock example: price approaches $150 resistance. Volume Profile shows low volume in $148-150 zone — resistance may break easily. On breakout, volume spikes — true move confirmed.
Futures example: E-mini S&P 500 rises, Open Interest also rises — new buyers entering, trend strong. Then price continues rising but OI falls — this is short covering, not new buying. Caution warranted.
Traps and Manipulation
False breakouts — the main trap volume helps identify. If level breaks but volume doesn't rise, return probability is high. Large players use such moves for liquidity harvesting — triggering retail stop orders.
Spoofing — placing large orders in the order book without intention to execute. Creates illusion of supply or demand. On futures, this is tracked through DOM analysis: if a large order disappears as price approaches, it was spoofing.
Stock market manipulation is harder to track due to dark pools and HFT algorithms. High-frequency traders create volume noise that's difficult to filter. The futures market is cleaner in this regard.
Choosing Tools for Your Strategy
For positional stock trading, Volume Profile and basic volume analysis suffice. Find accumulation zones, confirm breakouts, filter false moves. VWAP is useful for intraday trading.
For futures scalping, you need the full arsenal: Footprint for microstructure, Delta for force balance, DOM for order flow. Shorter timeframes require more detailed analysis.
For futures swing trading, focus on Open Interest and cumulative delta. They show positioning on longer horizons and help catch reversals. To consolidate this material, also study: Smart Money Control.
Volume analysis isn't a magic button — it's a market understanding tool. It won't give ready buy or sell signals, but will show what happens behind the price movement curtain. That knowledge is the foundation for informed decisions.
Frequently Asked Questions
Stock volume shows shares traded but some goes through dark pools. Futures volume is centralized with Open Interest available.
Number of open futures contracts. Rising OI with rising price confirms the trend.
Significant volume goes through Dark Pools. HFT algorithms create noise. Data is fragmented across exchanges.
Volume Profile, Footprint Charts, Delta Volume and DOM — the essential toolkit.
True breakouts come with volume spikes. False breakouts occur on low volume.
About the Author
Author: Igor Arapov — independent researcher in trading psychology and behavioral finance, practising trader since 2013, founder of arapov.trade, author of a trading book series (Open Library ), (ORCID: 0009-0003-0430-778X ).