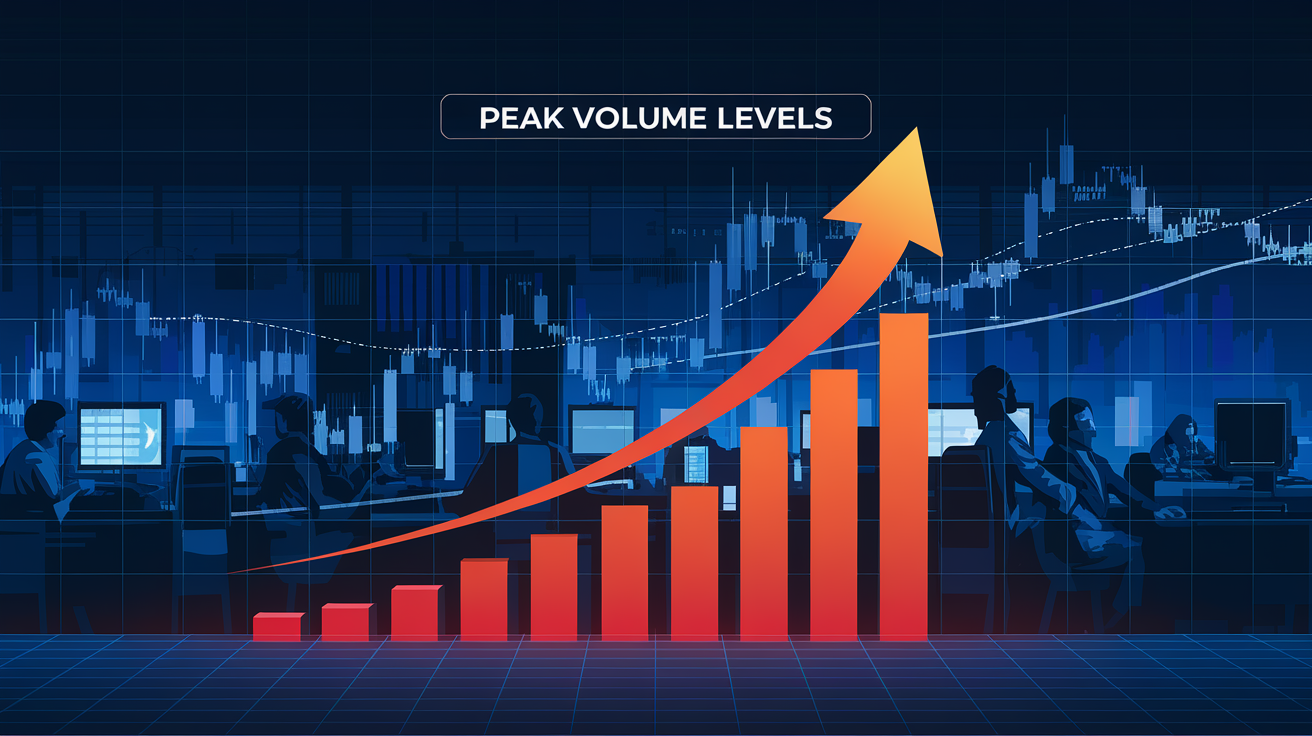
Most retail traders make decisions based solely on candlestick charts and lagging indicators, completely unaware of the tools that reveal the market's inner workings. The Order Book and Time & Sales provide a window into real market mechanics — every pending order, every executed trade, every move by institutional players visible in real-time.
These tools offer something charts cannot: leading information. Instead of reacting to completed price movements, you see intentions before they impact price. For scalpers, day traders, and anyone seeking to understand true market dynamics, mastering Order Flow analysis represents a significant competitive edge.
Understanding the Order Book (DOM)
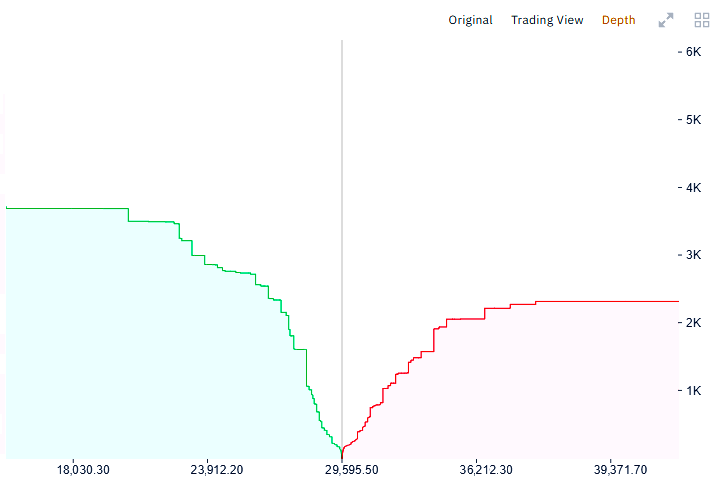
The Order Book, also called the Depth of Market (DOM) or Level 2, displays all active limit orders waiting for execution. It updates continuously — every new order appears, every cancellation removes an entry, every execution reduces the corresponding level.
The structure is straightforward: Bids (buy orders) stack below current price — buyers waiting for pullbacks. Asks (sell orders) stack above — sellers waiting for rallies. The meeting point determines the current market price.
Key Order Book Components
Market Depth represents total order volume across price levels. Deep markets require substantial volume to move price significantly. Shallow markets move easily — even modest orders can cause price spikes.
Spread — the gap between best bid and best ask. Tight spreads indicate high liquidity and active trading. Wide spreads signal low activity, reduced liquidity, or elevated volatility.
Order Imbalance. When bid volume significantly exceeds ask volume, potential buying pressure exists. The reverse — heavy asks — suggests selling pressure. Imbalances often precede directional moves.
Size Clusters (Walls). Abnormally large volume at specific levels creates potential support or resistance zones. However, not every large order represents genuine intent — some exist purely for manipulation.
Reading the Order Book Effectively
Order Book analysis goes beyond watching numbers change. True skill involves understanding dynamics: how orders appear and disappear, who places them, whether they actually execute.
What to Monitor
Rate of Change. Orders appearing and vanishing within milliseconds indicate algorithmic activity or manipulation. Stable orders persisting over time typically represent more reliable intentions. To understand this topic more deeply, I recommend studying the influence of major players.
Behavior Near Levels. When price approaches a large order, observe: does it hold or disappear? Orders vanishing just before execution represent classic spoofing. Orders getting absorbed confirm the level's validity.
Order Clusters. Multiple large orders at adjacent levels create liquidity zones. Such zones frequently become reversal points or consolidation areas.
Response to Trades. When a large order sits at a level and trades execute against it, but the displayed size doesn't decrease — you've found an iceberg order. Someone large is quietly building a position.
Time & Sales: The Tape
Time & Sales displays every executed transaction in real-time. While the Order Book shows intentions (who wants to trade), the tape shows actions (who actually traded).
The tape presents a continuous data stream: transaction price, size, timestamp, and direction. Each line represents an actual market transaction. Analyzing this flow reveals genuine activity rather than declared intentions.
Tape Components
Trade Price. The execution price for each transaction. Trades at the Ask indicate aggressive buying — buyers paid sellers' prices. Trades at the Bid indicate aggressive selling.
Trade Size. Contract or lot count per transaction. Large sizes (prints) signal institutional activity or large algorithmic positions.
Color Coding. Green prints — purchases at Ask (aggressive buyers). Red prints — sales at Bid (aggressive sellers). Gray or yellow — trades at mid-price between Bid and Ask.
Flow Speed. Slow tape indicates consolidation. Acceleration with large sizes signals emerging momentum or news reaction.
Tape Reading Patterns
Experienced traders don't just watch the tape — they identify recurring patterns and anomalies signaling institutional presence.
Key Signals
Large Print Sequences. Multiple consecutive large green trades at the same level indicate aggressive accumulation. An institutional player is buying regardless of price.
Absorption — heavy selling at Bid without price decline. Limit buyers are absorbing all selling pressure. Bullish signal — large players accumulating at support.
Impulse Prints. Sudden burst of large trades within seconds — reaction to significant events, level breakouts, or algorithm activation. Often precedes strong directional movement.
Exhaustion. Decreasing volume and slowing flow after sustained moves. Driving force depleted — potential reversal or consolidation ahead.
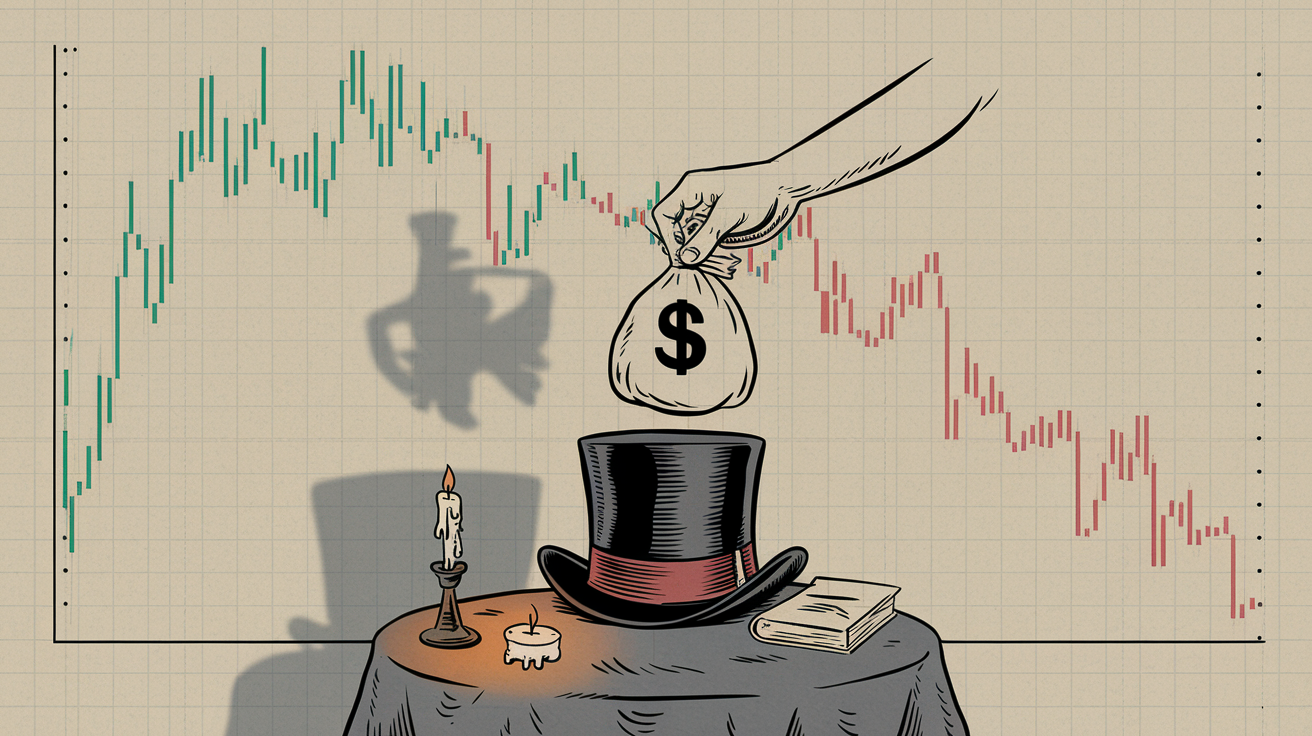
Order Book Manipulation Tactics
The Order Book serves as both analytical tool and manipulation venue. Large players employ various tactics to deceive retail traders and secure better entry prices.
Common Manipulation Methods
Spoofing — placing large fake orders without execution intent. The goal: create false supply or demand impressions, trigger price movement, then cancel orders and enter at better prices. Spoofing is illegal on regulated exchanges but still occurs.
Iceberg Orders — hidden orders displaying only small portions of true size. For example, a trader wants 10,000 contracts but shows only 100. Upon execution, another 100 automatically appears. This masks true intentions.
Layering. Placing multiple orders across several levels creating an apparent "wall." As price approaches, orders cancel layer by layer. Goal: psychological pressure on other traders.
Liquidity Withdrawal Before News. Before major events, market makers dramatically reduce Order Book depth, widening spreads. This protects them from volatility but traps retail traders.
Combining Order Book and Tape Analysis
Maximum effectiveness comes from simultaneous analysis of both tools. The Order Book shows potential — where support or resistance might exist. The tape confirms reality — whether those levels actually function.
Practical Scenarios
Level Confirmation. Large Bid sits at 100. Price drops toward it. Large green prints appear on the tape — buyers absorbing sellers. Level confirmed — look for long entry.
False Level. Large Ask sits at 105. Price rallies toward it. The order suddenly vanishes moments before contact. No large sales on tape. Spoofing detected — level was fake.
Hidden Accumulation. Price consolidates, no obvious Order Book imbalance. But the tape shows repeated large Ask purchases. Someone quietly building position — potential upside impulse coming.
Trend Reversal. During uptrend, large red prints appear on tape. Meanwhile, large Asks appear in Order Book without getting absorbed. Buyers losing strength — reversal possible.
Practical Trading Strategies
Trading from Significant Orders
Identify levels with abnormally large orders and trade bounces from them. Critical: wait for tape confirmation. When price approaches the level and large trades appear in the bounce direction — enter position. Stop loss beyond the large order level.
Following Large Prints
When consecutive large trades appear in one direction on the tape, institutional presence is confirmed. Enter in the same direction on pullbacks. Logic: large players won't move price against themselves.
Hunting Iceberg Orders
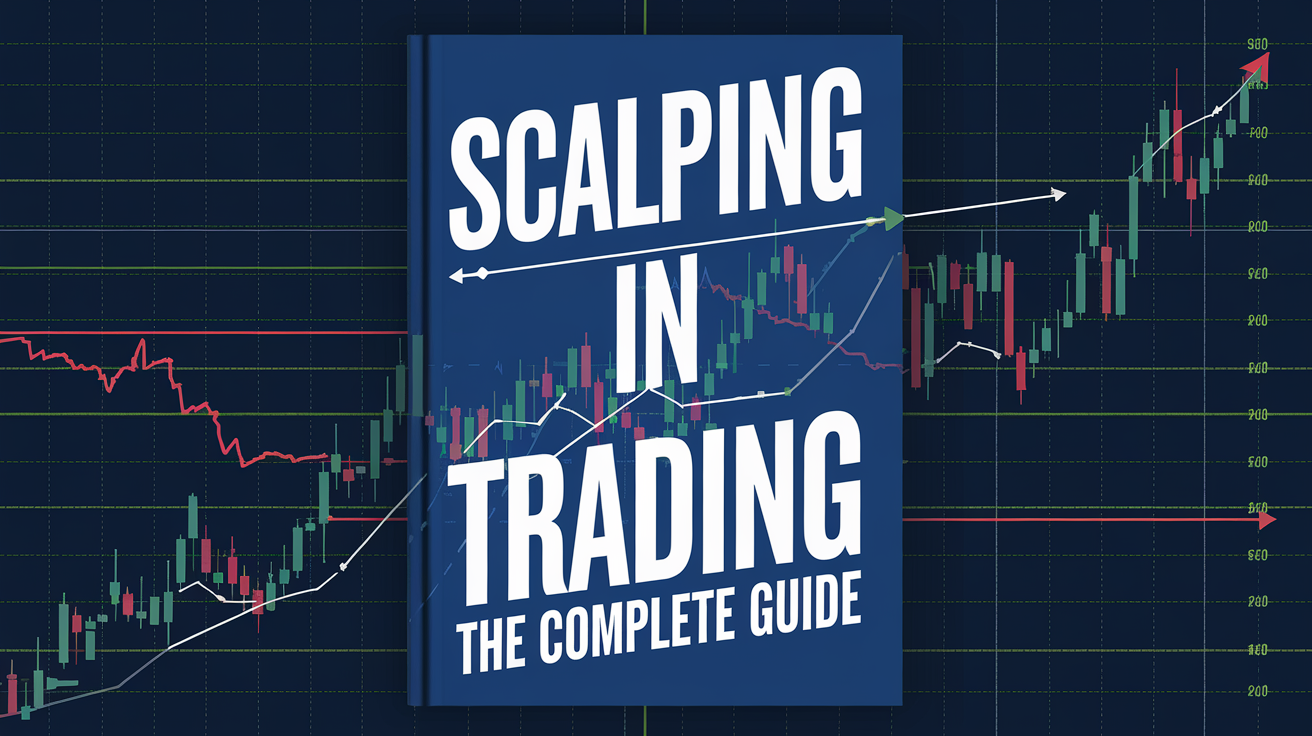
When trades continuously execute at a level but Order Book size doesn't decrease — you've found a hidden order. Trade in that order's direction: if buying iceberg — look for longs; if selling iceberg — shorts. For an advanced understanding, study scalping.
Filtering False Breakouts
Before entering breakout trades, check the tape. True breakouts accompany volume surges and large prints in the breakout direction. Low volume with no large prints — likely false breakout and reversal.
Order Flow Context: When and Where These Tools Work Best
Understanding when Order Book and tape analysis provides reliable signals versus when it becomes noise requires appreciating market context. These tools perform differently across various market conditions, instruments, and times.
Market Conditions
Trending Markets. During established trends, the tape typically shows consistent directional pressure — predominantly green prints in uptrends, red in downtrends. Order Book analysis helps identify pullback entry zones where large bids appear in uptrends or large asks in downtrends. Absorption patterns at these levels confirm trend continuation.
Ranging Markets. In consolidation phases, both tools help identify range boundaries. Large orders accumulating at range extremes signal potential reversal zones. The tape reveals whether boundary tests attract genuine interest or represent stop-hunting expeditions.
High Volatility Periods. During news releases and major events, Order Book depth typically evaporates as market makers withdraw liquidity. Tape speeds accelerate dramatically. Analysis during these periods requires experience — signals come fast and manipulation intensifies. Beginners should observe rather than trade during such times.
Instrument Considerations
Futures Markets. Order flow analysis originated and works best in futures — centralized exchange data, genuine volume figures, visible depth. E-mini S&P 500 (ES), Crude Oil (CL), and Treasury futures provide excellent order flow signals.
Stocks. Individual equities show reliable order flow on major exchanges, though dark pool activity hides significant volume. Highly liquid large-caps work better than small-caps where manipulation is easier.
Forex. Decentralized forex markets lack true Order Book data — what brokers show represents only their internal liquidity. Currency futures on CME provide actual exchange data for forex order flow analysis.
Cryptocurrency. Crypto exchanges display Order Books, but manipulation runs rampant on less regulated venues. Focus on major exchanges with proven liquidity and consider that significant trading occurs on derivatives platforms.
Common Mistakes to Avoid
Trusting Large Orders Without Verification. Not every substantial Order Book entry represents real intention. Always verify execution on the tape. The combination of both tools separates genuine signals from manipulation attempts.
Ignoring Context. Order Book and tape behavior differs dramatically in trending versus ranging markets, across different instruments, and throughout trading sessions. A large bid that works as support in an uptrend might simply get steamrolled in a downtrend. Always consider overall market structure before acting on order flow signals.
Over-Analysis Paralysis. Don't attempt tracking every trade and order change — information overload leads to hesitation and missed opportunities. Focus on anomalies: abnormally large sizes, unusual activity clusters, clear imbalances. Let minor fluctuations pass.
Trading Illiquid Markets. In low-liquidity markets, Order Books are easily manipulated and tape data becomes unreliable. A single large order can create false impressions of support or resistance. Use these tools on active, liquid instruments where genuine price discovery occurs.
Mechanical Rule Following. Order flow analysis is not a mechanical system with fixed rules. Large bid doesn't automatically mean support. Absorption doesn't guarantee reversal. Develop intuition through screen time — thousands of hours observing how order flow translates into price action across different conditions.
Ignoring Time of Day. Order flow characteristics change throughout the trading session. Opening minutes show chaotic activity as overnight orders execute. Midday often brings reduced volume and less reliable signals. Closing hours see increased institutional activity. Learn your instrument's daily rhythm.
Conclusion
The Order Book and Time & Sales open a window into true market mechanics. They reveal what hides behind candles and indicators: participant intentions, actual transactions, institutional activity, and liquidity zones.
Mastering these tools requires time and practice. Begin with observation: watch the Order Book and tape without trading. Notice patterns, learn to distinguish genuine signals from manipulation. Gradually develop intuition enabling quick, accurate decisions.
Remember: these are tools, not guarantees. Their effectiveness depends on your market understanding and disciplined application. Combine them with volume analysis and market structure comprehension for maximum precision in your trading decisions.
Frequently Asked Questions
The Order Book displays all active limit orders to buy and sell. Buy orders sit below current price, sell orders above. It shows how many contracts traders are willing to trade at each price level.
The Order Book shows pending orders — intentions. Time & Sales shows executed trades — actions. The Book answers 'who wants to trade,' the tape answers 'who is actually trading.'
Spoofing is manipulation using large fake orders to create false supply or demand impressions. The goal is to trigger price movement, then cancel orders and enter at better prices. It's illegal on regulated markets.
An iceberg order is hidden, split into small portions. Only a fraction shows in the Order Book; full size stays hidden. Allows large players to enter positions without revealing their true size.
Signs include: orders disappearing before execution, rapid order appearance/cancellation, Order Book volume not matching tape transactions. Comparing both tools helps filter false signals.
About the Author
Author: Igor Arapov — independent researcher in trading psychology and behavioral finance, practising trader since 2013, founder of arapov.trade, author of a trading book series (Open Library ), (ORCID: 0009-0003-0430-778X ).