Pattern 123 is a universal technical analysis model that helps traders identify potential trend reversal points or continuation. This pattern applies across all financial markets: Forex, stocks, cryptocurrencies, and commodities. The formation's simplicity and signal clarity make it a popular tool among both beginners and professional traders.
Pattern 123 Structure
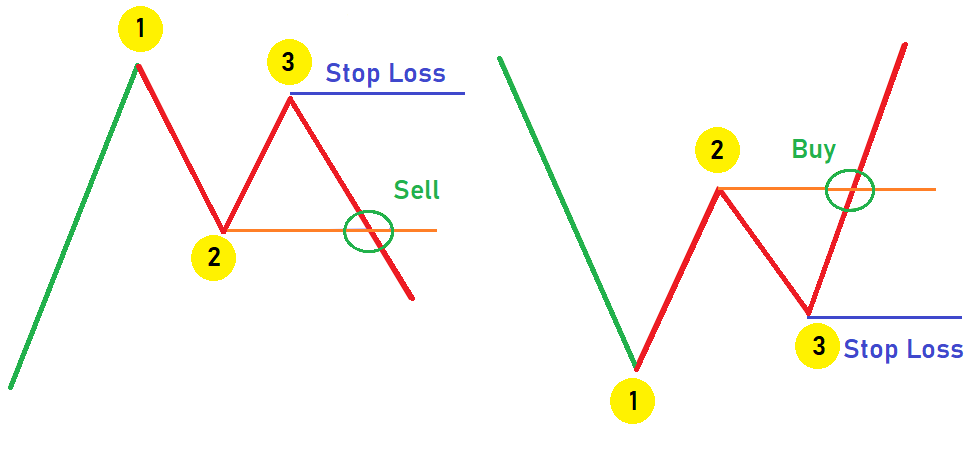
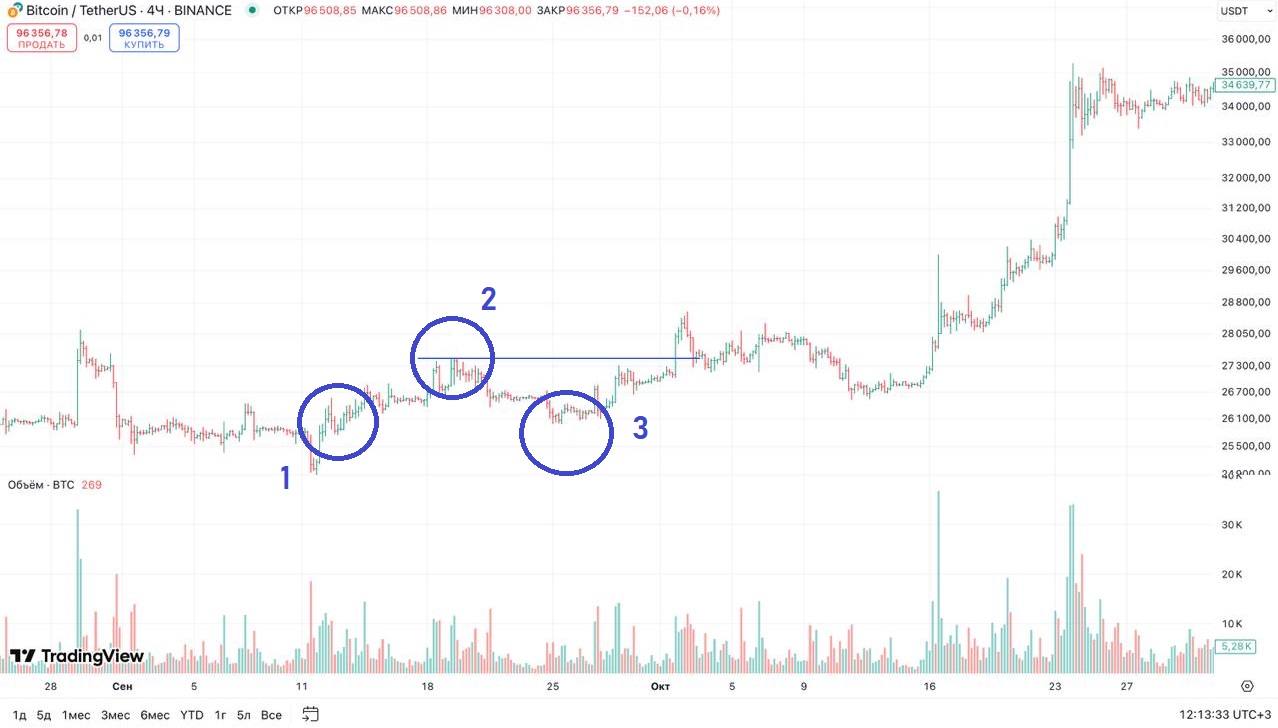
The 123 formation consists of three sequential points, each with its own significance. Point 1 represents a local extreme — a high in a downtrend or low in an uptrend. This is the first signal of possible current impulse completion. Point 2 forms after correction and becomes a key support or resistance level. Point 3 forms when price makes another move in trend direction but doesn't exceed point 1's extreme.
Point 3 positioning relative to point 1 is critically important for signal reliability. The closer point 3 is to point 1, the weaker current trend and higher reversal probability. Ideal positioning of point 3 is at 50-61.8% level from distance between points 1 and 2, corresponding to Fibonacci retracement levels.
Trade Entry Signals
The main trading signal is the level breakout of point 2. For long position entry, price must break point 2 upward; for short — downward. Two main entry methods exist. The conservative approach involves waiting for candle close beyond point 2 level with volume increase confirmation. The aggressive method allows entry on level touch without waiting for confirmation.
Point 2 Level Retest
Often after breakout, price returns to point 2 level for testing. This is called a retest and represents one of the best minimum-risk entry opportunities. During retest, traders check for candlestick patterns like pin bar or engulfing that confirm level bounce.
Stop-Loss and Take-Profit Placement
Stop-loss is placed beyond point 3: below for buys, above for sells. This protects the position from random fluctuations. An alternative is using ATR indicator to calculate adaptive stop based on current volatility. Several methods determine take-profit: nearest support or resistance level, pattern height projection from breakout point, or partial close with trailing stop.
Quality Pattern Conditions
For reliable signals, the pattern should form at significant support or resistance levels. Volume increase on point 2 breakout confirms signal validity. Reversal candlestick patterns at point 3 increase successful trade probability. If point 3 coincides with Fibonacci levels (38.2%, 50%, 61.8%), this provides additional confirmation. Divergence on indicators RSI or MACD also indicates trend weakening.
Pattern 123 shows best results when forming after a strong extended trend. In this case, the model signals current movement exhaustion and high reversal probability. In sideways markets, pattern effectiveness decreases due to lack of clear directional movement.
Trading Strategy Variations
Several approaches exist for trading Pattern 123 depending on trader style and market conditions. The breakout strategy involves entry immediately after confirmed point 2 level breakthrough. This aggressive approach allows capturing movement from the start but with increased false breakout risk.
The retest strategy is more conservative and involves waiting for price return to the broken level. After retest, the trader gains opportunity to enter at better price with lower risk. The combined strategy involves opening partial position on breakout and adding on successful point 2 level retest. Before proceeding, please familiarize yourself with the trading basics .
Pattern Formation Psychology
Understanding market psychology behind Pattern 123 helps traders make more conscious decisions. Point 1 forms when trend participants take profits after impulse movement. Correction to point 2 reflects a temporary pause when market evaluates current trend strength.
Point 3 formation below point 1 (in uptrend) shows buyers' inability to make new high, indicating bullish sentiment weakening. Point 2 breakout is the culmination — the moment when sellers take control while buyers holding positions begin closing them, accelerating downward movement.
Common Trader Mistakes
The most frequent mistake is premature entry before confirmed point 2 breakout. Traders try to anticipate movement and open positions early, leading to losses on false signals. Ignoring volume on breakout reduces signal reliability. Too tight stop-loss leads to frequent stops from random market fluctuations. Waiting for perfectly symmetrical pattern causes missing good trading opportunities.
Timeframes and Markets
Pattern 123 is effective on any timeframes from M1 to D1 and higher. Most reliable signals appear on higher timeframes H1, H4, and D1. On lower timeframes the pattern suits scalping ; on higher — medium-term and long-term trading. The model works on all markets with sufficient liquidity: currency pairs, stocks, cryptocurrencies, commodities.
False Signal Filtering
To filter false breakouts, several factors must be considered. If price quickly returns to range after point 2 breakout, this indicates false movement. Lack of volume increase on breakout points to signal weakness. Too large distance between points 2 and 3 increases complex breakout risk. Signal confirmation by broken level retest significantly increases entry reliability.
Large players often use point 2 level for liquidity collection, creating false breakouts before true movement. Therefore, traders should not react to first level touch but wait for candle close and volume confirmation. Using multiple timeframes helps assess overall market picture and filter low-quality signals.
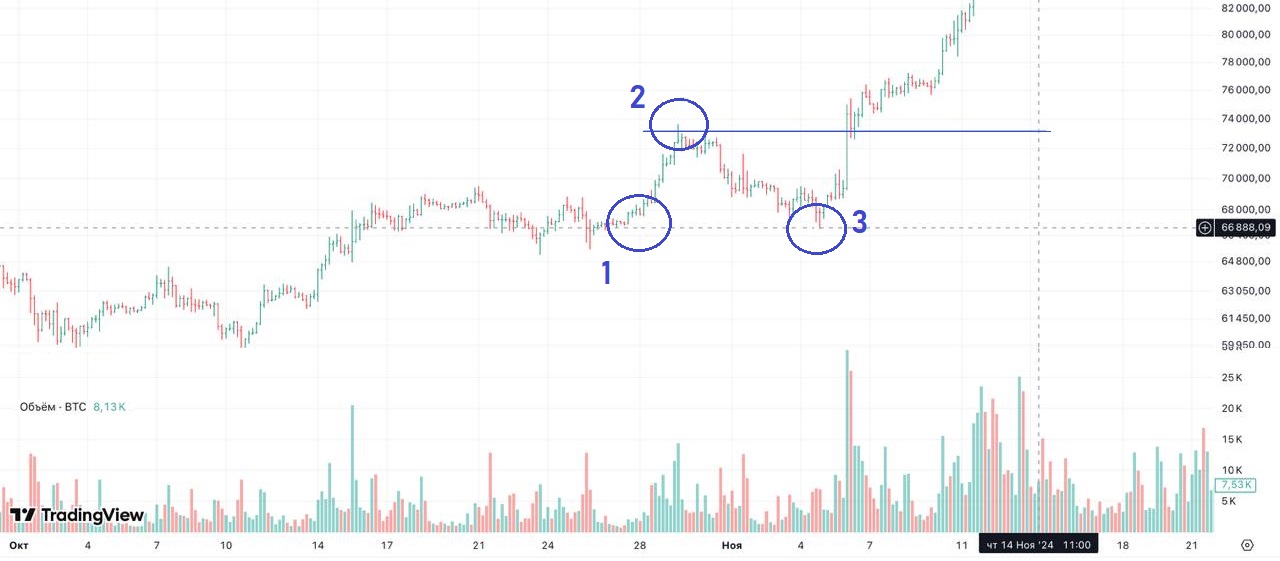
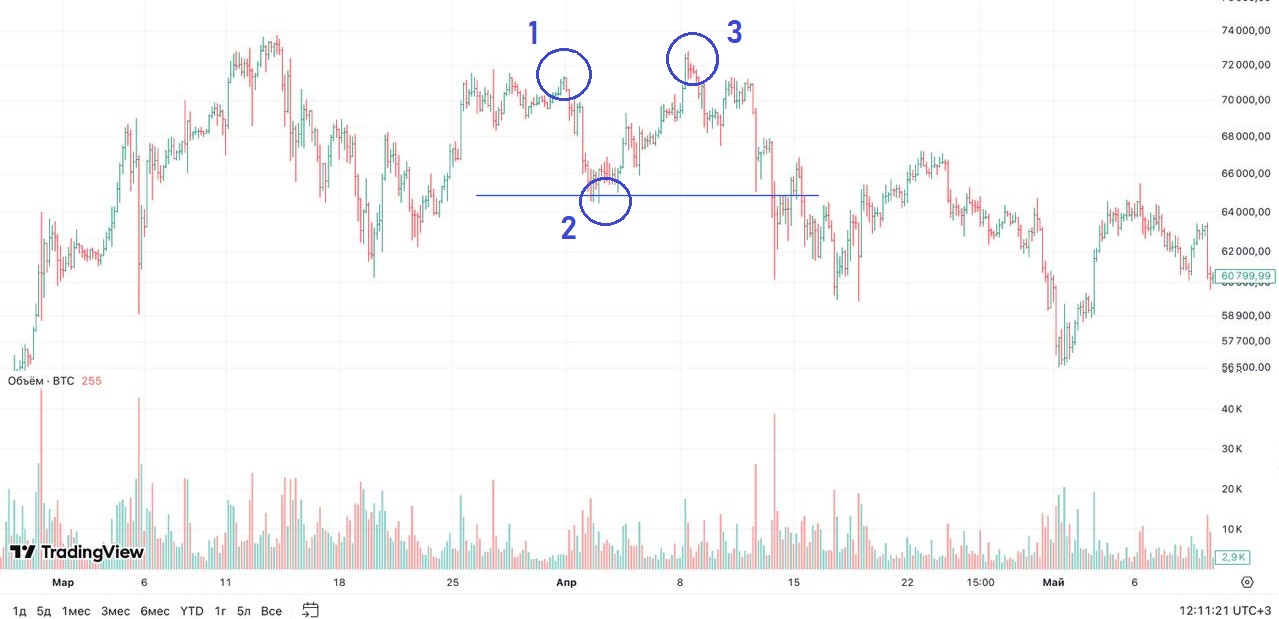
Practical Trading Examples
Consider a bullish Pattern 123 example on EUR/USD daily chart. After downtrend, a low forms at 1.0500 level (point 1). Price corrects to 1.0650 (point 2), then drops to 1.0550 (point 3) without updating the low. On 1.0650 level breakout with volume increase, a long position opens. Stop-loss is placed below point 3 at 1.0520, take-profit at 1.0800 (pattern height projection).
Bearish Pattern 123 in cryptocurrency market: after uptrend on BTC/USDT, a high forms at 45000 (point 1), correction to 42000 (point 2), repeat rise to 44500 (point 3). Downward 42000 level breakout with volume increase gives sell signal. Stop-loss above point 3, take-profit determined by nearest support levels or pattern height projection.
Conclusion
Pattern 123 is a universal tool for determining entry and exit points in trend and counter-trend trading. Its simplicity and clarity make the model accessible to traders of any level. Successful application requires patience, signal confirmation through volume and indicators, and proper risk management. Combining the pattern with candlestick analysis and support and resistance levels improves trading strategy effectiveness.
Regular practice on historical data and demo account helps develop skill in recognizing quality patterns and filtering false formations. Keeping a trading journal with all Pattern 123 trades recorded allows analyzing results and improving strategy. Following risk management rules — not risking more than 1-2% of deposit per trade — protects capital from significant drawdowns. Basic concepts are described in the article: Quick Start in Trading .
Pattern 123 works effectively both as standalone trading signal and as part of comprehensive trading system. It can be combined with Wyckoff method, Smart Money concept, and volume analysis for more accurate entry points. Testing various settings and adapting to specific market conditions will help achieve stable results in long-term perspective.
Frequently Asked Questions
Pattern 123 is a universal technical analysis model consisting of three sequential points: local extreme (point 1), correction level (point 2), and potential reversal zone (point 3). Breaking through point 2 level serves as the main trading signal.
Optimal entry is after confirmed breakout of point 2 level with increased volume. Conservative approach involves waiting for candle close beyond the level, aggressive — entry on level touch. Best opportunity is retest of point 2 after breakout.
Stop-loss is placed beyond point 3: below point 3 for buys, above point 3 for sells. You can also use ATR indicator to calculate adaptive stop based on volatility or dynamic trailing stop.
Take-profit is determined several ways: nearest support/resistance level, pattern height projection (distance from point 1 to point 2 projected from breakout point), or partial close with trailing stop.
Pattern 123 works on any timeframes from M1 to D1 and higher. Most reliable signals appear on higher timeframes (H1, H4, D1). On lower timeframes the pattern suits scalping, on higher — medium-term trading.
About the Author
Author: Igor Arapov — independent researcher in trading psychology and behavioral finance, practising trader since 2013, founder of arapov.trade, author of a trading book series (Open Library ), (ORCID: 0009-0003-0430-778X ).