Throughout my years in financial markets, I've watched hundreds of beginners make the same predictable mistakes. Most lose money and quit disappointed, yet nearly all these pitfalls are entirely avoidable with proper knowledge. This guide distills practical wisdom that will help you navigate the learning phase without unnecessary losses.
First, let's be realistic: trading isn't a fast track to wealth. Promises of doubling accounts monthly or earning 50% returns are marketing fiction. Sustainable expectations hover around 2-5% monthly with disciplined execution — and achieving even that requires serious preparation. If such prospects interest you, read on.
1. Invest in Education Before Risking Capital
Financial markets represent complex ecosystems where millions of participants pursue different objectives with vastly different resources. Retail traders, institutional investors, banks, hedge funds — all influence price movements. Understanding basic market mechanics is non-negotiable before committing real money.
Master essential terminology first. Spread represents the difference between buying and selling prices — your transaction cost on every trade. Lot measures position size: standard lots equal 100,000 currency units, mini lots 10,000, micro lots 1,000. Margin is the collateral required for leveraged positions. Without grasping these concepts, accurate risk calculation becomes impossible.
Understand how different markets operate. Forex runs continuously five days weekly through decentralized networks. Stock exchanges follow strict session schedules. Cryptocurrency platforms never close. Each market exhibits unique volatility patterns, liquidity characteristics, and price behavior that affect your strategy choices.
2. Select Brokers by Regulatory Standing
Licensing from reputable regulators should be your primary selection criterion. FCA in Britain, CySEC in Cyprus, ASIC in Australia — these jurisdictions provide genuine client protection. Unregulated firms may operate as "bucket shops" that never route trades to actual markets, profiting directly from your losses.
Compare trading conditions systematically: spreads, commissions, execution speeds. For active traders, even half-pip spread differences compound significantly over time. Minimum deposits, available instruments, platform quality — all shape daily trading experience and long-term results.
Deposit bonuses seem attractive but typically include demanding turnover requirements. Common conditions demand trading volume 30-50 times bonus amounts before withdrawal eligibility. Beginning traders rarely achieve such volumes before exhausting their capital.
3. Document Your Trading Plan Thoroughly
A trading plan defines every aspect of your market activity. Without written rules, you trade reactively — subject to emotional impulses and random influences. Your plan must specify: financial objectives, acceptable risk parameters, chosen methodology, and precise entry and exit criteria.
Ground your goals in reality. Five percent monthly on $1,000 yields $50 — modest sounding, yet 60% annually outperforms most conventional investments. Chasing 20-30% monthly inevitably leads to excessive risk-taking and eventual account destruction.
Match trading style to your actual lifestyle. Scalping demands continuous screen attention and split-second decisions. Day trading consumes several focused hours daily. Swing trading — holding positions for days — suits those balancing trading with regular careers.
4. Treat Risk Management as Sacred
Risk management determines survival in markets more than any other factor. The cardinal rule: never risk more than 1-2% of capital on single trades. With $1,000, that means $10-20 maximum exposure per position. Even ten consecutive losers leave 80-90% of capital intact for recovery.
Stop-loss orders aren't optional — they're mandatory protection. Stories of traders losing everything in single sessions without stops aren't exaggerations. Sudden news-driven or geopolitical moves can devastate unprotected accounts within minutes.
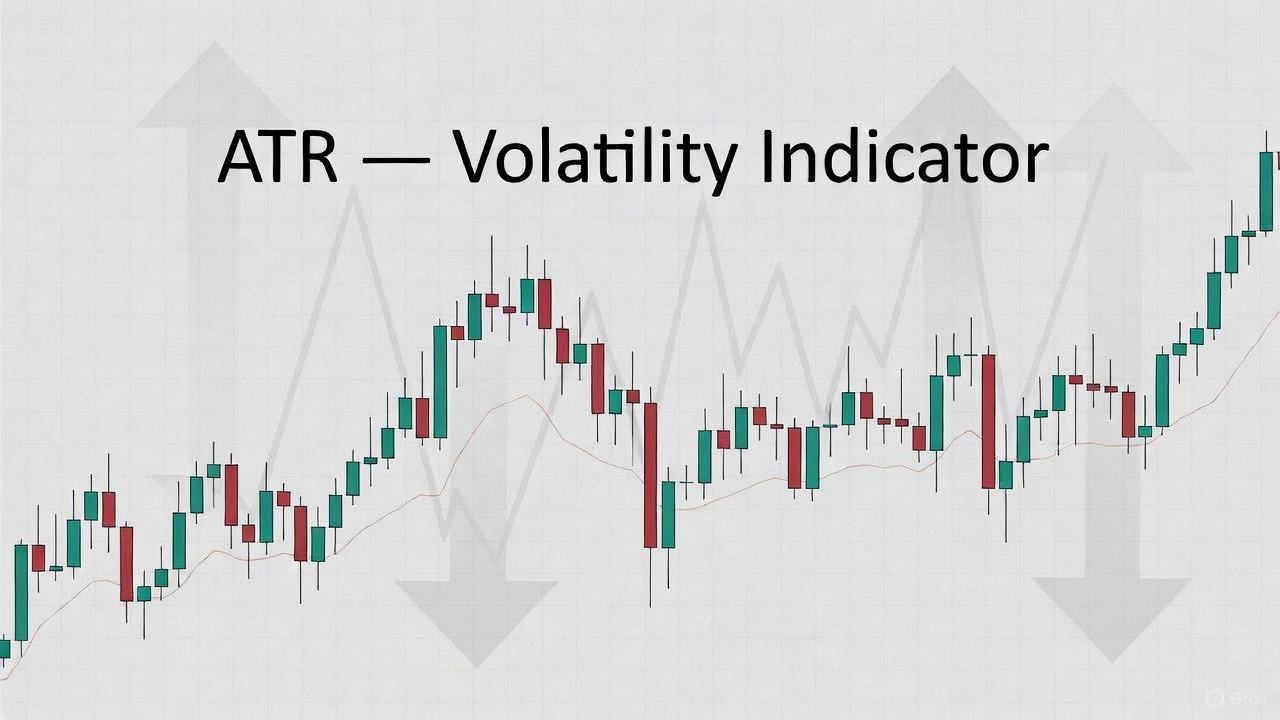
Calibrate stops to instrument volatility. Calm pairs like EUR/CHF need 15-20 pips; volatile pairs like GBP/JPY may require 40-50. Stops too tight get triggered by normal market noise; stops too wide violate sound risk principles.
5. Practice Seriously on Demo Accounts
Demo accounts simulate live trading without financial risk. Here you master platform mechanics, test strategies, and acclimate to market rhythms. Most brokers provide $10,000-100,000 in virtual capital for practice.
Critical mindset: treat demo funds as real money. Set virtual balance matching your intended live deposit. Planning to start with $500? Trade exactly that on demo. Millions in virtual dollars create false confidence and distort realistic risk perception.
Document every trade thoroughly: entry reasoning, execution details, outcomes, emotional states. After 30-50 trades, analyze patterns statistically. Win rates below 40% or average losses exceeding average gains signal strategy problems requiring adjustment.
6. Master Emotional Control
Fear and greed sabotage more traders than market movements ever do. Fear triggers premature profit-taking and extended loss-holding. Greed drives excessive sizing after winning streaks. Both states cause trading plan violations that compound losses.
Accept losses as inevitable process components. Top performers close 40-50% of trades unprofitably. What separates winners from losers isn't win rate — it's the ratio of average win size to average loss size. Small losses combined with larger gains create positive expectancy.
Avoid revenge trading after losses. The urge to immediately recover through larger positions leads directly to catastrophe. After losses, step away: leave the screen, clear your mind, return only when analytical thinking replaces emotional reaction.
7. Maintain Detailed Trading Records
Trade journals transform scattered experiences into systematic learning. Record everything: dates, instruments, entry and exit points, position sizes, results, trade rationale, mistakes identified. This becomes your personalized textbook based on actual experience.
Review records weekly to identify patterns: which assets produce profits, which timeframes work best, which signals prove reliable. Spot recurring mistakes — perhaps systematic counter-trend entries or stop violations around news releases.
Optimize based on evidence. When statistics show scalping losing to spread costs, try swing approaches. When evening trades underperform morning sessions, restrict trading hours. Data reveals truth that intuition often obscures.
8. Track Economic Developments
Fundamental factors drive macro-level market movements. Central bank rate decisions, inflation reports, employment figures, geopolitical developments — all generate volatility and shape longer-term trends affecting your positions.
Use economic calendars religiously. Note key weekly events: Federal Reserve announcements, Non-Farm Payrolls releases, European Central Bank decisions. Avoid initiating positions within 30 minutes of major releases when sudden sharp moves become likely.
Understand market reaction logic. Strong economic data typically strengthens currencies by raising rate hike expectations. Weak data has opposite effects. But markets respond to deviation from consensus, not absolute values — better-than-expected weak data can strengthen currencies while worse-than-expected strong data can weaken them.
9. Use Leverage Conservatively
Leverage enables trading positions larger than account balances. With 1:100 leverage, $1,000 controls $100,000 in market exposure. Attractive in theory, but amplification works symmetrically — losses multiply identically to gains.
Beginning traders should limit leverage to 1:10-1:20 maximum. With $1,000 and 1:10 leverage, you control up to $10,000 — sufficient for learning while maintaining error margin. Higher leverage leaves almost no room for mistakes; single-percent adverse moves can wipe accounts.
Calculate actual exposure before every trade. A 0.1 lot EUR/USD position with 1:100 leverage and 50-pip stop means $50 potential loss. Against a $500 account, that represents 10% risk — far exceeding prudent single-trade limits.
10. Approach Trading as Marathon, Not Sprint
Meaningful results develop over extended timeframes. Initial months represent learning periods with inevitable mistakes. Expect consistent profitability to emerge after 6-12 months of disciplined practice. Attempting to accelerate this process typically accelerates account depletion instead.
Maintain commitment to ongoing education. Markets evolve continuously; new instruments and strategies emerge regularly. Read trading literature, study educational content, analyze how successful traders operate. Education investments yield compounding returns throughout your trading career.
Ignore internet success stories and get-rich-quick testimonials. Behind every publicized trading fortune lie countless unpublicized failures. Build your own sustainable path: slow, steady capital growth outweighs spectacular occasional results that prove impossible to replicate.
Conclusion
Trading demands systematic professional approaches. Education, discipline, risk management, and emotional control form the foundation supporting long-term success. Most beginners fail not because markets are impossible, but because they make avoidable mistakes through insufficient preparation.
Start modestly: absorb theory, select regulated brokers, document trading plans, refine strategies on demo accounts. Transition to live trading with minimal capital, then scale positions gradually as experience accumulates. Patience and consistency serve as your strongest allies throughout this journey.
Frequently Asked Questions
You can start with $50-200 at brokers offering micro-lots. However, a comfortable starting point is around $500. The key rule: only trade with money you can afford to lose.
Basic theory can be mastered in 1-2 months. Developing consistent skills takes 6-12 months of practice. Stable results typically appear after 1-2 years of systematic work.
Beginners should use leverage no higher than 1:10-1:20. High leverage amplifies both profits and losses. As you gain experience, you can gradually increase to 1:30-1:50.
Main reasons: lack of trading plan, poor risk management, emotional decisions, insufficient preparation, and unrealistic expectations of quick profits.
Beginners should start with swing trading (positions held for several days). It allows time for analysis, reduces noise impact, and doesn't require constant screen monitoring.
About the Author
Author: Igor Arapov — independent researcher in trading psychology and behavioral finance, practising trader since 2013, founder of arapov.trade, author of a trading book series (Open Library ), (ORCID: 0009-0003-0430-778X ).