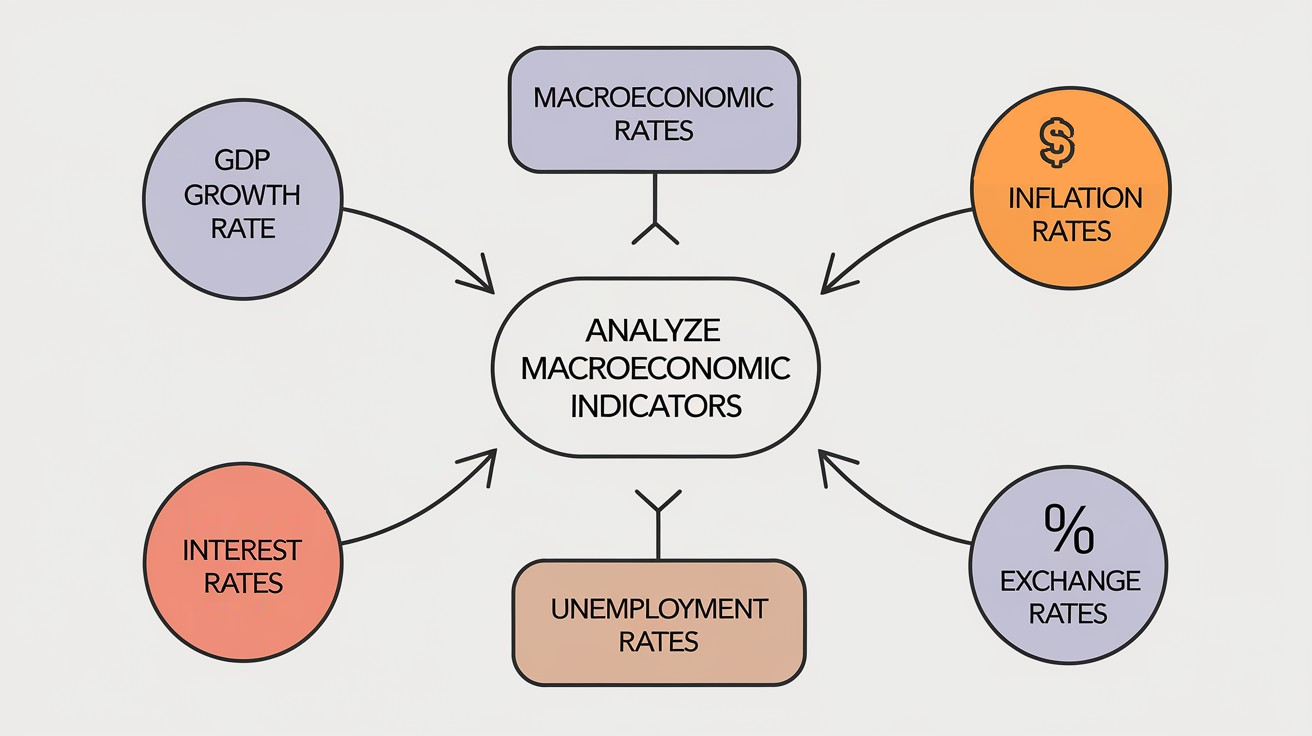
Macroeconomic Indicators of Fundamental Analysis
Macroeconomic indicators represent statistical data characterizing the state and dynamics of a country's or region's economy. They form the foundation of fundamental analysis and enable traders to evaluate prospects for various asset classes based on objective economic data.
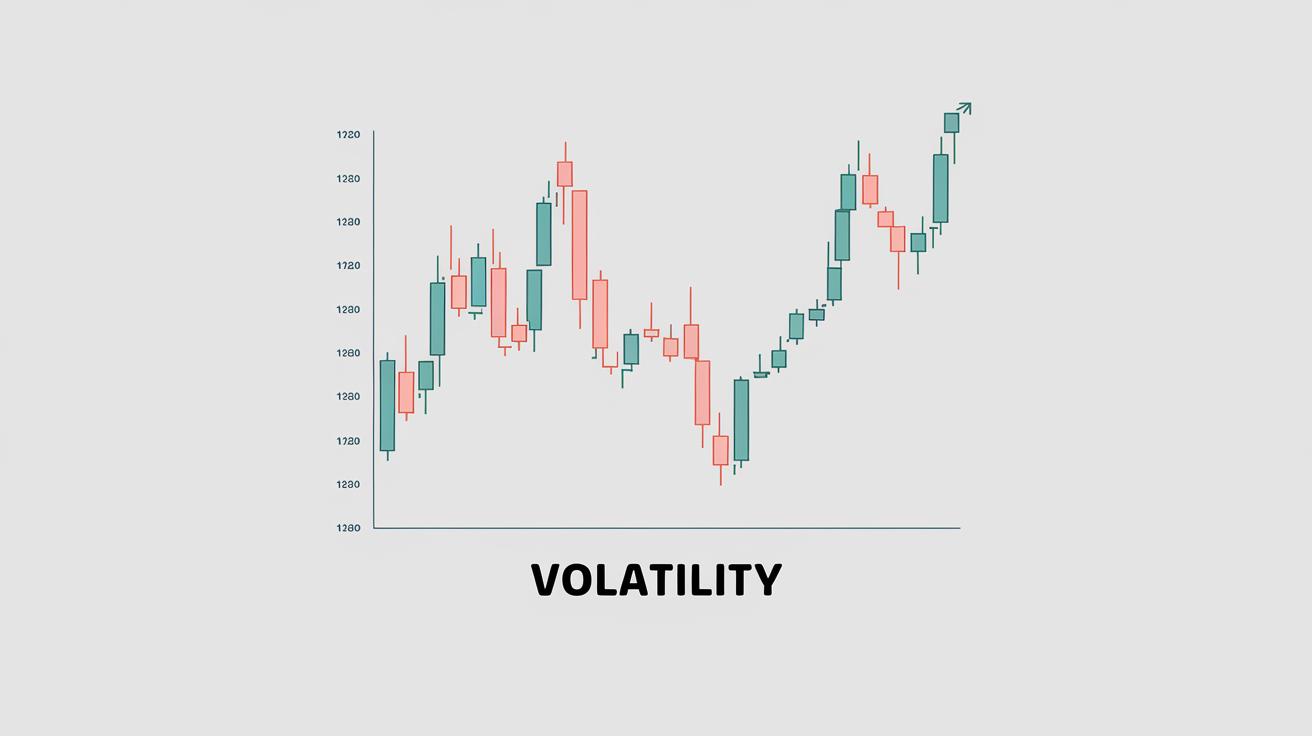
Understanding relationships between economic indicators and market movements opens opportunities for forecasting trends and making informed trading decisions. Each significant release can trigger substantial volatility, creating both risks and opportunities for profit extraction. Read more about this in the article: macroeconomics.

Gross Domestic Product (GDP)
GDP measures the total value of all goods and services produced in a country over a specific period. This indicator serves as the primary gauge of economic health and determines the overall direction of national economic development.
Sustained GDP growth above forecasts strengthens investor confidence and supports the national currency. Stock markets react positively as economic expansion creates a favorable environment for corporate profits. Slowing growth or negative GDP dynamics trigger recession expectations and capital outflows.
Quarterly GDP data is published in three releases — advance, preliminary, and final. The first release generates the strongest market reaction, although subsequent revisions can also influence investor sentiment with significant deviations.
Inflation Indicators
CPI (Consumer Price Index) and PPI (Producer Price Index) reflect inflationary processes in the economy. These indicators directly influence central bank decisions on monetary policy.
Inflation above the central bank's target level increases the likelihood of monetary policy tightening. Rising interest rates strengthen the currency but may pressure stock markets due to higher borrowing costs. Low inflation, conversely, creates room for policy easing.
Core inflation (Core CPI) excludes volatile components — food and energy — providing a cleaner picture of price trends. Central banks primarily focus on core measures when making decisions.

Labor Market
Employment data reflects consumer potential of the economy and serves as an important indicator of economic activity. NFP (Non-Farm Payrolls) — the monthly report on US job creation — ranks among the most influential economic releases.
Strong employment data strengthens the currency and supports economic growth expectations. Wage growth creates inflationary pressure and increases the likelihood of monetary policy tightening. A weak labor market, conversely, signals economic slowdown.
The unemployment rate complements the labor market picture. Low unemployment indicates labor market tightness and potential wage growth. High unemployment reflects weak consumer demand and economic problems.
Interest Rates
Central bank decisions on interest rates determine the cost of money in the economy and exert powerful influence on all asset classes. Rate increases strengthen the currency by attracting capital seeking yield.
Central bank officials' rhetoric influences expectations no less than actual decisions. Hints about future policy changes trigger immediate market reactions. Traders analyze press conferences and meeting minutes to forecast next steps.
Monetary policy divergence between countries creates sustained trends in currency markets. Currency of a country with higher rates attracts carry trade — borrowing in low-yield currency to invest in high-yield currency.
Business Activity (PMI)
PMI (Purchasing Managers Index) measures sentiment among purchasing managers in manufacturing and service sectors. Values above 50 indicate expanding activity; below 50 indicates contraction.
PMI serves as a leading indicator — its changes often precede GDP dynamics. Index growth signals improving economic prospects; declines signal potential slowdown. The gap between manufacturing and service PMI reflects structural features of the economy.
Trade Balance
Trade balance shows the difference between exports and imports. A positive balance strengthens the national currency through sustained demand for export payment operations.
Trade deficit creates currency pressure since paying for imports requires selling national currency. However, trade balance impact depends on overall context — countries with attractive investment climates offset trade deficits with capital inflows.
Consumer Confidence
The Consumer Confidence Index reflects household sentiment regarding economic prospects. High confidence stimulates consumer spending — the primary driver of economic growth in developed countries.
Declining consumer confidence foreshadows retail sales contraction and economic slowdown. This indicator often precedes actual changes in consumer behavior, making it a valuable forecasting tool.
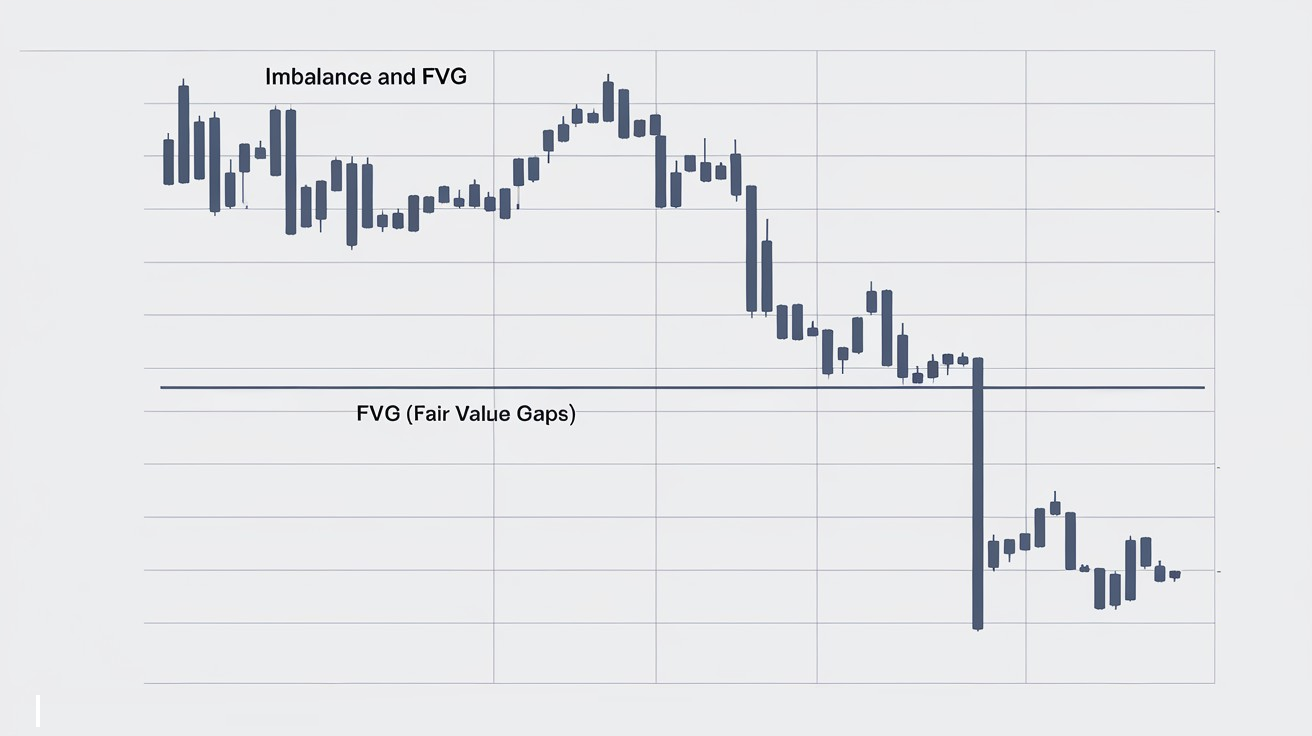
Volatility Index (VIX)
VIX measures expected stock market volatility based on S&P 500 option prices. High values indicate elevated uncertainty and fear among investors.
Rising VIX often accompanies falling stock markets and flight to safe-haven assets. Low values characterize periods of market calm and investor confidence. Traders use VIX as an indicator of market sentiment and potential reversals.
Practical Application
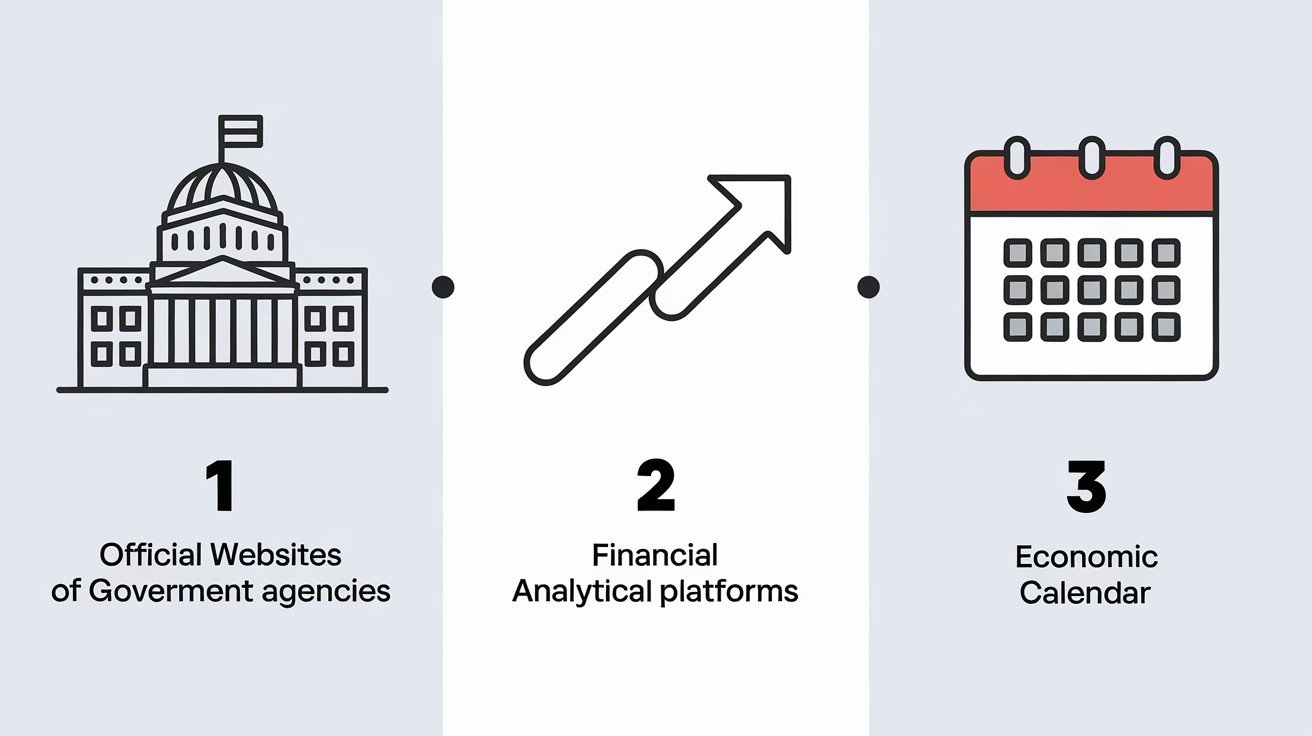
The economic calendar serves as the primary tool for tracking macroeconomic releases. Planning trading around important events allows avoiding unexpected volatility or using it to open positions.
Comparing actual data with consensus forecasts determines market reaction direction. Significant deviations trigger strong movements, while data within expectations is often already priced in. Previous value revisions also influence current data interpretation.
Integrating technical analysis with fundamental analysis improves trading effectiveness. Macroeconomic data determines overall direction; technical tools help select optimal entry points and position management.
Money Supply and Liquidity
Money supply (aggregates M1, M2, M3) reflects total monetary assets in circulation. Money supply expansion stimulates economic activity but may trigger inflation with excessive growth.
Central banks manage liquidity through open market operations and quantitative easing programs. Increasing liquidity supports risk assets — stocks and cryptocurrencies rise amid abundant cheap money supply. Liquidity contraction creates pressure on financial markets.
Bond Yields
Government bond yields serve as indicators of market expectations regarding interest rates and inflation. Rising 10-year US Treasury yields reflect expectations of higher inflation or monetary policy tightening.
Yield curve inversion — when short-term bonds offer higher yields than long-term bonds — historically foreshadows recession. Traders monitor the spread between 2-year and 10-year bonds as an economic cycle indicator.
Retail Sales
Retail sales data shows consumer demand conditions — the primary driver of economic growth in developed countries. Rising sales signal consumer confidence and support economic prospects.
Seasonality influences data interpretation — holiday periods traditionally show elevated sales. Analysts use seasonally adjusted data for more accurate assessment of consumer activity trends.
Trading Strategies Based on Macro Data
News trading involves opening positions at the moment of important economic data publication. This approach requires fast reaction and understanding of market expectations. Traders compare actual values with consensus forecasts to determine movement direction.
Position trading uses macroeconomic trends to form long-term positions. Understanding the economic cycle allows positioning in advance in assets that benefit from the current phase — cyclical stocks during growth or defensive assets during recession.
Inter-market Correlations
Macroeconomic data affects different asset classes differently. Understanding these relationships enables building diversified strategies and hedging risks. Rising interest rates strengthen currency but pressure bonds and growth stocks.
Commodity currencies — Canadian and Australian dollars — are sensitive to oil and industrial metal prices respectively. Gold traditionally rises during periods of uncertainty and high inflation, serving as a safe-haven asset.
The cryptocurrency market also reacts to economic factors, particularly Fed policy and global liquidity. Emerging market stock indices correlate with global risk appetite and dollar dynamics. Dollar strength typically creates pressure on emerging market assets due to capital outflows and rising dollar-denominated obligations.
Frequently Asked Questions
Macroeconomic indicators are statistical data reflecting the state and dynamics of a country's or region's economy. Key indicators include GDP, inflation, unemployment rate, trade balance, and business activity indices. They form the foundation of fundamental analysis.
GDP growth above forecasts strengthens the national currency and supports the stock market, signaling a healthy economy. Slowing growth or declining GDP can trigger recession expectations, falling stock indices, and capital outflows.
Inflation determines currency purchasing power and influences central bank decisions on interest rates. High inflation typically leads to rate hikes, which strengthens the currency but may negatively impact the stock market.
Non-Farm Payrolls (NFP) is a monthly report on the number of jobs created in the US non-agricultural sector. It is one of the most influential economic releases, causing high volatility in currency and stock markets.
The economic calendar helps plan trading around upcoming important data releases. Traders track release times, compare forecasts with actual values, and use post-release volatility to open positions.
About the Author
Author: Igor Arapov — independent researcher in trading psychology and behavioral finance, practising trader since 2013, founder of arapov.trade, author of a trading book series (Open Library ), (ORCID: 0009-0003-0430-778X ).