Flag and Pennant Patterns in Trading — Complete Guide
The Flag pattern and Pennant pattern rank among the most recognizable chart formations in technical analysis. These continuation patterns emerge during brief market pauses following powerful directional moves, providing traders opportunities to join the existing trend under favorable conditions.
Understanding the mechanics behind these pattern formations opens pathways to systematic profit extraction from trending markets. When markets pause after an impulse, some participants lock in profits, creating temporary equilibrium between buyers and sellers. However, this balance proves unstable — accumulated energy soon releases, and price continues moving in the direction of the initial impulse.
Flag Pattern Anatomy
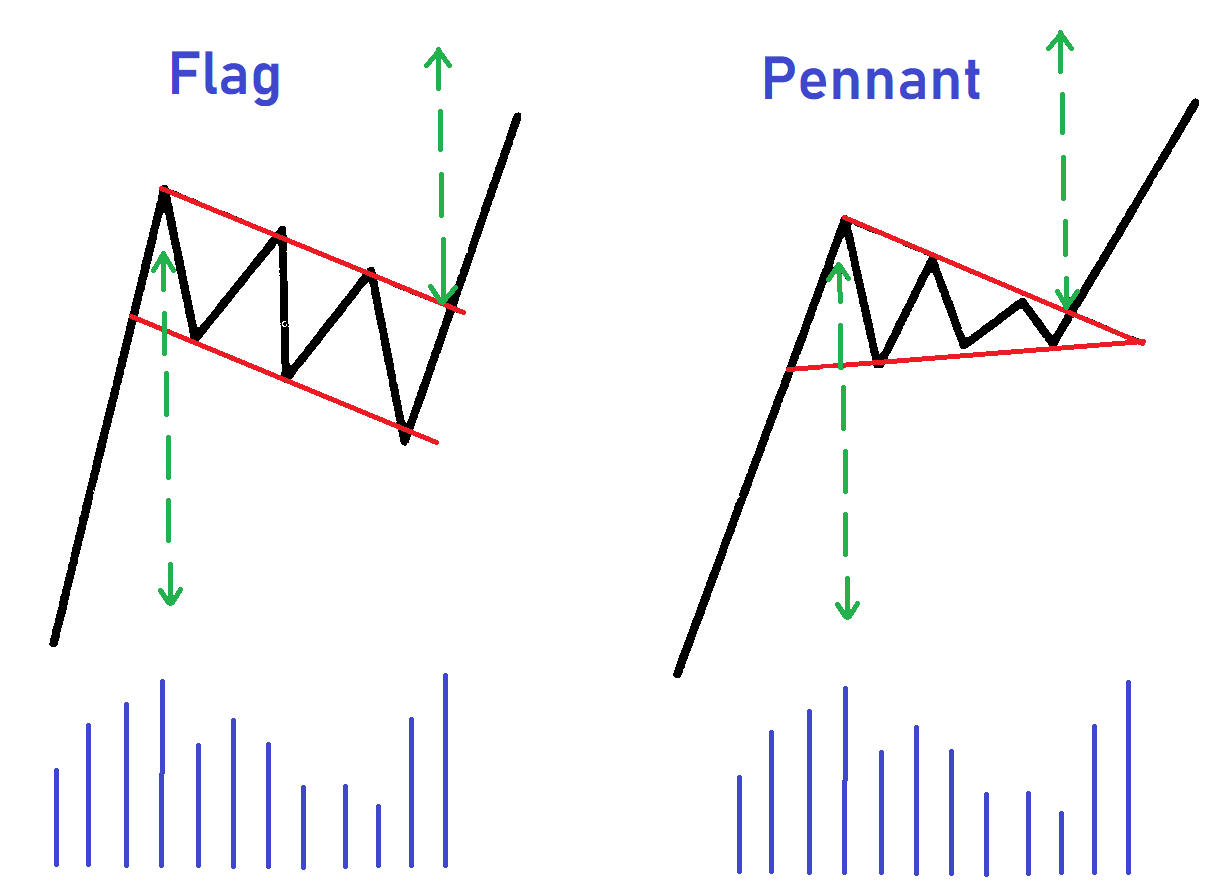
The Flag Pattern visually resembles a rectangle tilted against the main trend direction. The pattern consists of two key elements: the flagpole — the preceding impulsive move, and the flag body itself — a consolidation zone bounded by parallel support and resistance lines.
During uptrends, bullish flags tilt downward, creating the impression of a correction. Sellers temporarily seize initiative, but their pressure proves insufficient to reverse the trend. Each pullback attracts new buyers ready to enter at better prices. Similarly, bearish flags during downtrends tilt upward — buyers attempt to reverse the move, but their efforts prove futile.
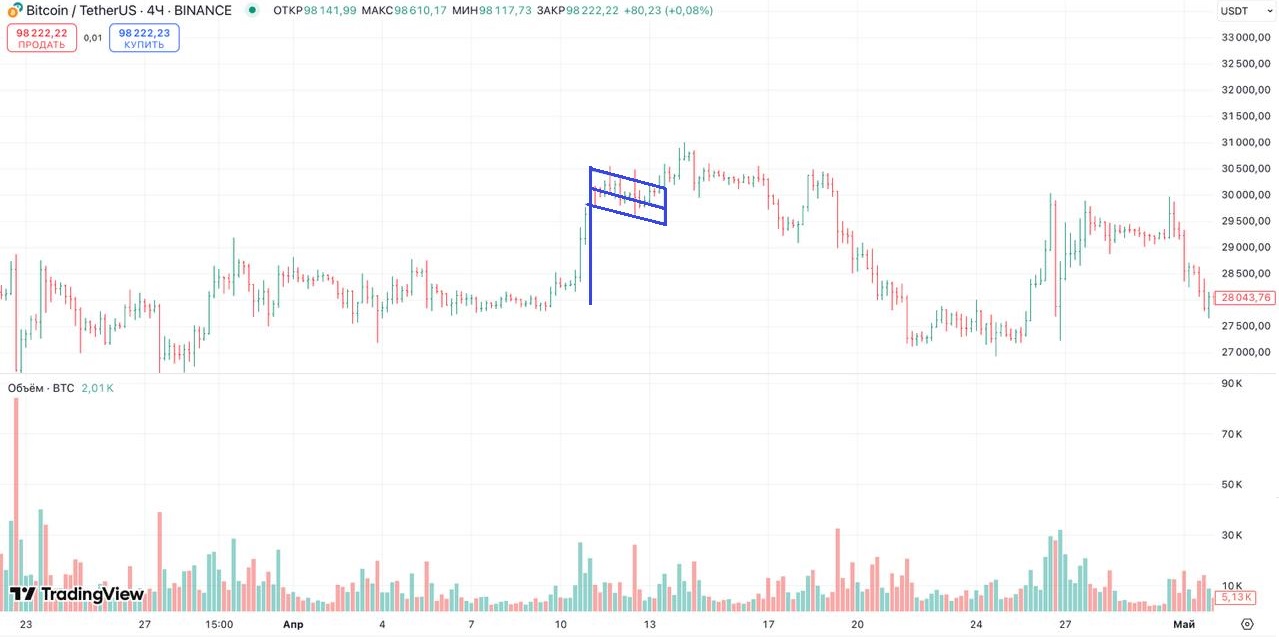
A crucial Flag characteristic involves gradual trading volume decline during consolidation. This indicates weakening interest in counter-trend movement. As price approaches the pattern boundary in the main trend direction, volumes begin rising, heralding imminent pattern breakout.
Pennant Pattern Structure
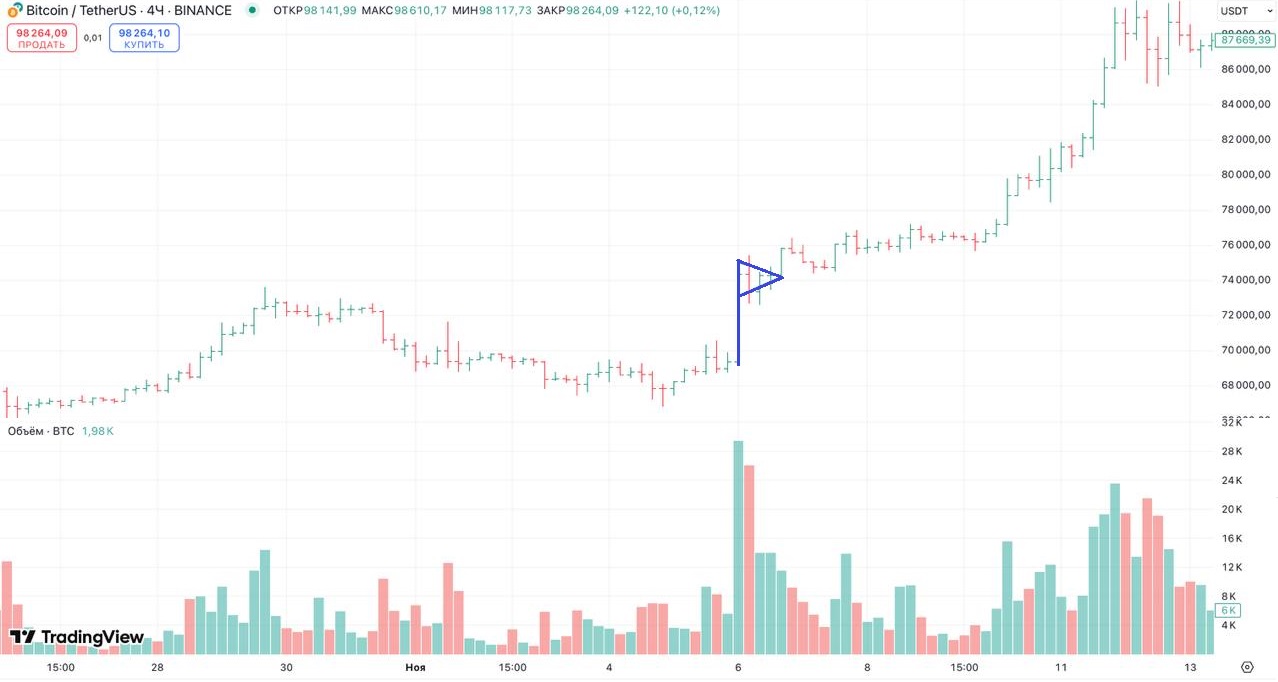
The Pennant differs from the Flag in its consolidation zone shape. Instead of a parallel channel, price forms a symmetrical converging triangle. Support and resistance lines converge, gradually compressing the price range to a critical point from which exit becomes inevitable.
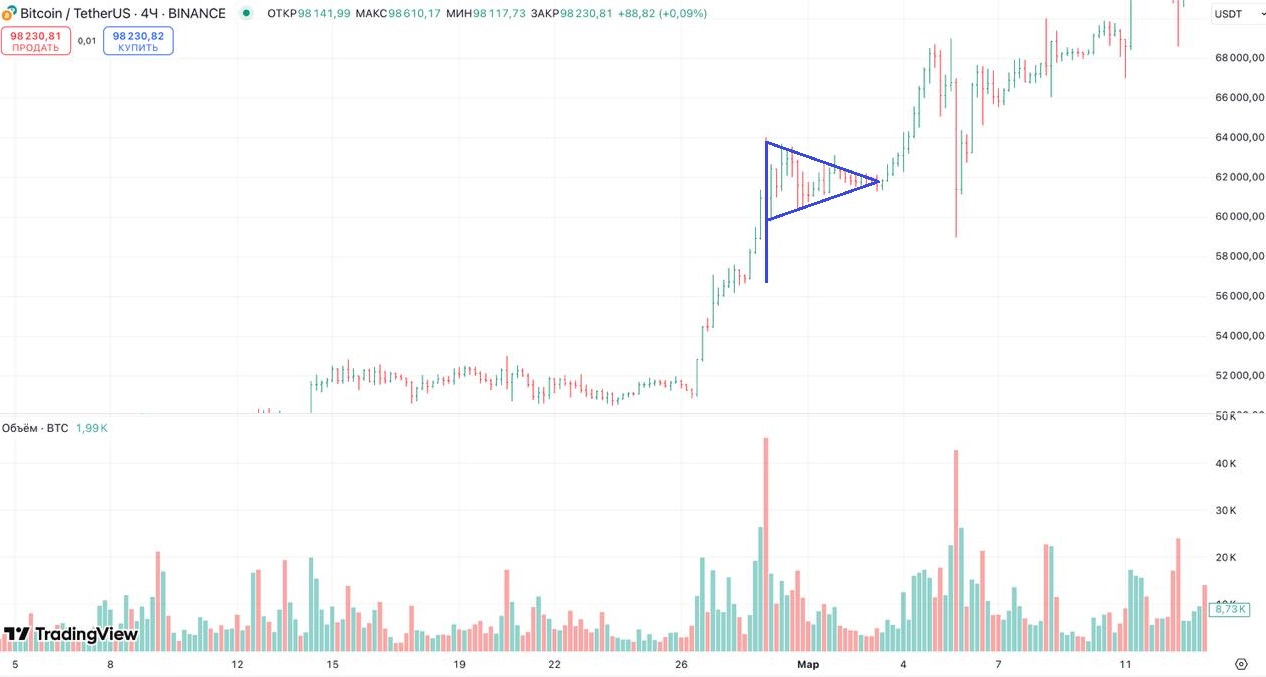
The consolidation phase in a Pennant typically runs shorter than in a Flag. The market accumulates energy for trend continuation more quickly. Volatility within the pattern decreases as the triangle narrows , with volumes falling to minimum values immediately before breakout.
Pennant symmetry means support and resistance lines maintain approximately equal angles. This distinguishes it from ascending and descending triangles, which feature one horizontal boundary. Understanding these distinctions helps correctly classify patterns and forecast breakout direction.
Formation Psychology
Behind chart patterns lie real market participant actions. Following strong impulses, some traders lock in profits, creating pressure against the trend. Other participants who missed the move's beginning await corrections for entry. These opposing forces create temporary equilibrium visually manifesting as flags or pennants.
The key moment involves balance between profit-taking and new demand. If sellers (during uptrends) cannot push price significantly lower, this indicates buyer strength. Gradual range narrowing in pennants or stable channel tilt in flags demonstrates weakening counter-trend pressure.
Breakouts occur when accumulated imbalance between buyers and sellers reaches critical mass. New participants enter the market joining the trend, while those positioned against the move are forced to close positions. This creates impulses often comparable in strength to initial movements.
Quality Pattern Criteria
Not every formation resembling a flag or pennant merits trader attention. Quality patterns possess characteristics that increase successful execution probability. First, the preceding impulse must be pronounced — a sharp directional move with high volume.
Consolidation duration matters. Too brief a pause may prove insufficient for energy accumulation, while too long may indicate momentum loss. Optimal flag duration ranges from one to four weeks on daily charts, with pennants typically forming faster — from several days to two weeks.
Pullback depth represents another critical parameter. Consolidation shouldn't exceed 50% of flagpole height. Deeper pullbacks may signal reversal rather than continuation. Ideal patterns demonstrate pullbacks within 25-38% of the impulsive move.
Volume Confirmation
Volume dynamics serve as the most important pattern quality filter. During the consolidation phase, volumes should decline sequentially. This shows counter-trend movement lacks support from major participants, representing merely a temporary pause.
During breakout, volumes should surge sharply. This volume confirmation represents a mandatory quality signal requirement. Breakouts on low volume often prove to be false breakouts — price exits pattern boundaries but quickly returns.
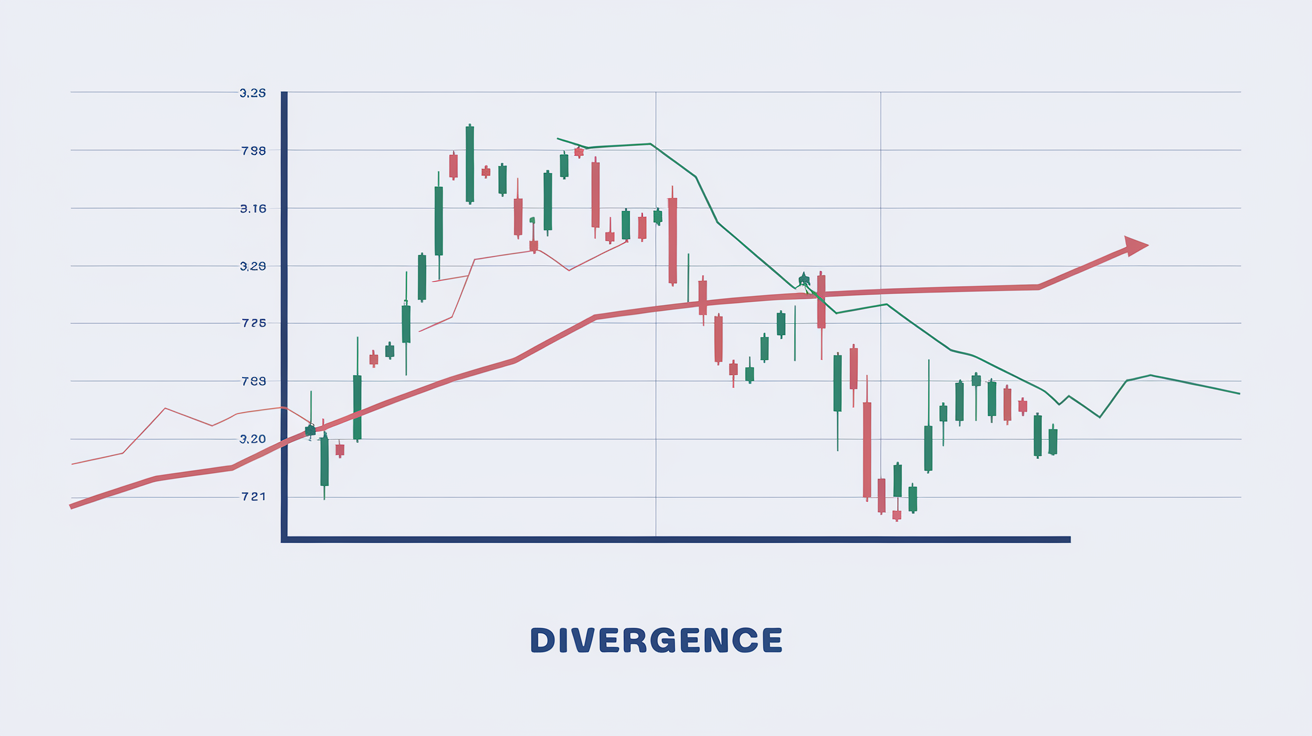
The On-Balance Volume indicator helps assess accumulation before breakout. If OBV rises despite sideways price action, this indicates hidden position building by large players in the trend direction. OBV and price divergence within the pattern strengthens the signal.
Entry Points and Breakout Confirmation
Determining optimal entry represents a key strategy element. The conservative approach involves waiting for candle closes beyond pattern boundaries. This reduces false breakout entry risk, though may result in missing portion of the move.
Technical indicators complement price analysis. RSI above 50 during bullish breakouts or below 50 during bearish ones confirms direction. MACD line crossover in breakout direction strengthens the signal. Moving averages help assess overall trend context.
Aggressive traders enter before pattern completion, opening positions as price approaches the boundary in trend direction. This approach provides better entry prices but carries elevated stop-out risk if consolidation continues.
Position Management
Stop-loss when trading flags is placed beyond the opposite channel boundary. For bullish patterns — below the lower support line, for bearish — above the upper resistance line. For pennants, stops are set beyond the triangle apex opposite the expected breakout direction.
Target level calculation relies on the flagpole method. The height of the impulsive move preceding the pattern is projected from the breakout point. This provides the minimum movement target. Additional targets are determined using Fibonacci levels — 161.8% and 261.8% extensions.
Partial profit-taking at the first target reduces risk and ensures guaranteed results. The remaining position can be held with stop moved to breakeven. Trailing stops capture maximum movement, automatically closing positions on reversal.
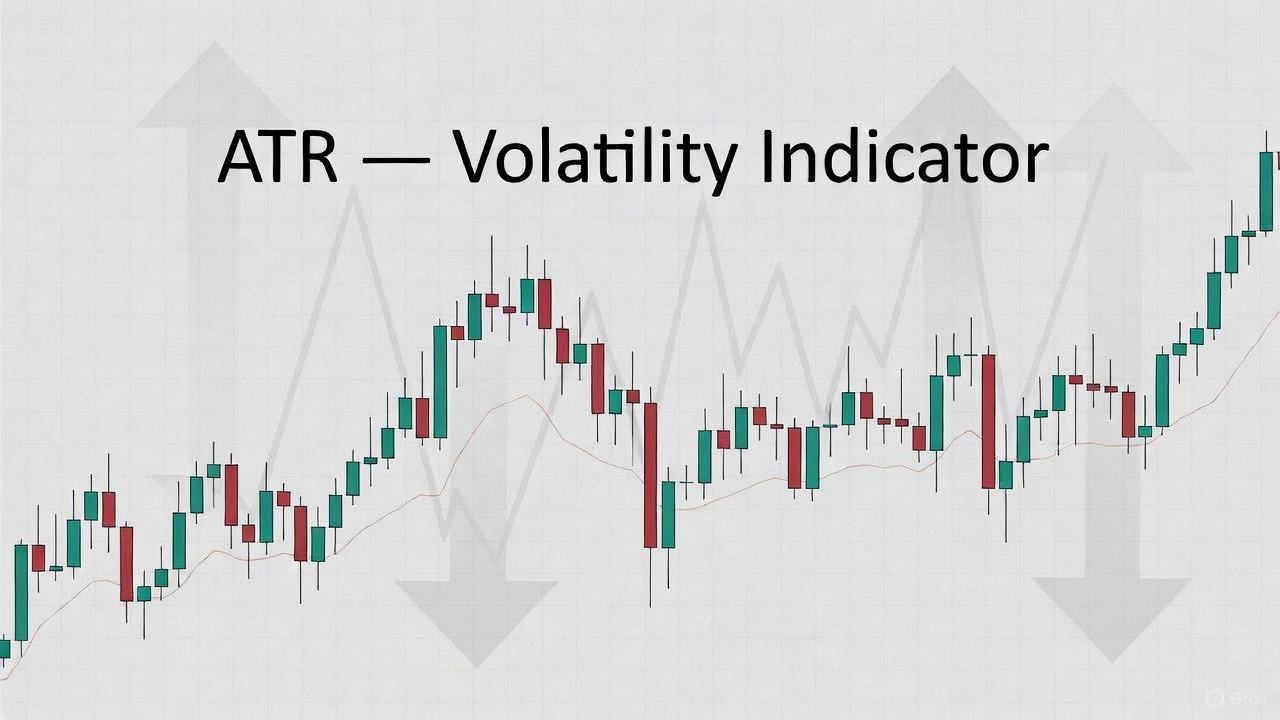
ATR Indicator for Stop Adjustment
ATR (Average True Range) helps adapt stop-loss size to current market volatility . Fixed pip stops may prove too tight during high volatility or too wide during calm markets.
The standard approach places stops 1.5-2 ATR from entry or pattern boundary. This accounts for normal market fluctuations and protects against random noise stop-outs. Meanwhile, stops remain close enough to maintain acceptable risk-to-reward ratios.
ATR calculation uses period 14 on the timeframe where the pattern is traded. When trading daily charts, daily ATR applies; on hourly charts — hourly ATR. This ensures value relevance to current market conditions.
Common Mistakes
Premature entry represents the most common error. Seeing a forming pattern, traders open positions before breakout, hoping for better prices. However, patterns may continue consolidating or even transform into reversal formations.
Ignoring volume leads to false breakout entries. Without volume confirmation, breakouts carry low reliability. Professional traders always analyze volume dynamics both within patterns and at the moment price exits boundaries.
Counter-trend trading — attempting to use patterns for trades against the trend. Flags and pennants are continuation models; they work in the direction of existing trends. Expecting breakouts in the opposite direction proves statistically unprofitable. For beginners, I recommend first studying the anatomy of a trend .
Market Context
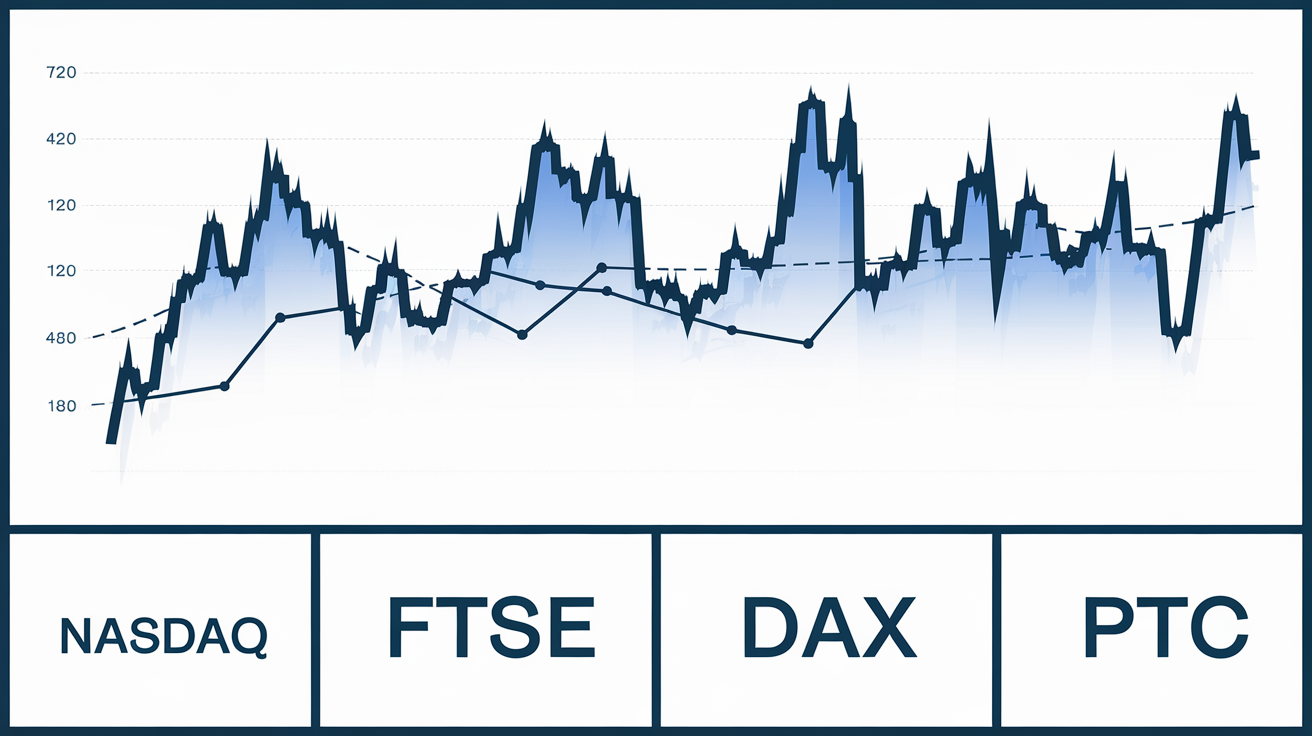
Pattern effectiveness depends on overall market conditions. During strong trends, flags and pennants execute with high probability. In ranging markets, these models form less frequently and prove less reliable — the base trend impulse is absent.
Technical analysis of higher timeframes helps determine main trend direction. Patterns on hourly charts aligned with daily trend direction have greater success chances than patterns forming against the senior tendency.
News flow influences pattern behavior. Significant economic data or corporate report releases can accelerate breakouts or, conversely, lead to unpredictable movement. Checking economic calendars before entry helps avoid surprises.
Conclusion
Flag and Pennant patterns remain among the most reliable chart formations in technical analysis due to their clear structure and predictable behavior. These trend continuation models provide traders with definitive signals for market entry under favorable conditions, when the primary move stands ready to resume after brief consolidation.
Successful trading with these patterns demands a comprehensive approach. It's not enough to simply identify the formation on a chart — you must verify its quality against several criteria: flagpole height, pullback depth, and consolidation duration. Volume confirmation remains the critical filter separating quality signals from false breakouts. To consolidate the material, also study trading channels.
The psychological context underlying pattern formation emphasizes the importance of understanding market dynamics. Behind the chart lines lies a battle between buyers and sellers, and the ability to read this struggle helps traders make well-founded decisions. Each breakout represents more than a technical signal — it reflects real shifts in the balance of power on the market.
Implementing correct position management — using flagpole-method-derived targets, placing stops while accounting for volatility, taking partial profits — transforms these patterns from mere observation into a profitable trading system. Practice demonstrates that traders who consistently apply these principles and carefully analyze market context achieve sustainable results.
Flag and Pennant patterns work across all markets and timeframes — from minute-level cryptocurrency charts to monthly equity graphs. The secret to success lies not in the magic of the patterns themselves, but in discipline, analysis, and the ability to adapt your strategy to changing market conditions. Master these tools, and you'll add a powerful weapon to your trader's arsenal.
Frequently Asked Questions
Flag and Pennant are classic trend continuation patterns that form after strong impulsive price movements. A Flag appears as a tilted rectangular channel, while a Pennant forms a symmetrical converging triangle. Both patterns signal a pause in the trend before continuation.
A Flag forms a parallel channel tilted against the main trend, while a Pennant creates a symmetrical triangle with converging lines. Flags typically have longer consolidation phases, while Pennants are characterized by rapid narrowing of the price range.
A genuine breakout is confirmed by increased trading volume, candle closing beyond pattern boundaries, and absence of quick price return into the pattern. Additional confirmation comes from RSI, MACD indicators, and moving averages.
Target levels are calculated using the flagpole method: the height of the impulsive move preceding the pattern is projected from the breakout point in the trend direction. Additional targets can be identified using Fibonacci extension levels at 161.8% and 261.8%.
For bullish patterns, stop-loss is placed below the lower pattern boundary or beneath the last local minimum. For bearish patterns — above the upper boundary or last maximum. Using the ATR indicator to account for volatility is recommended.
About the Author
Author: Igor Arapov — independent researcher in trading psychology and behavioral finance, practising trader since 2013, founder of arapov.trade, author of a trading book series (Open Library ), (ORCID: 0009-0003-0430-778X ).