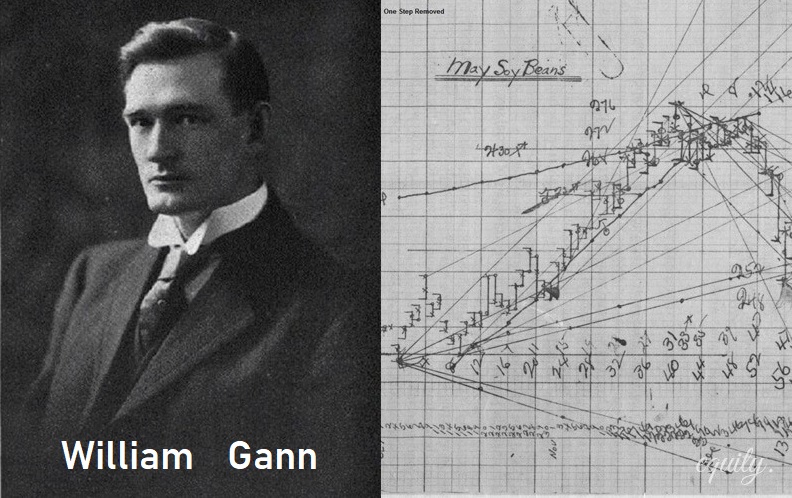
William Gann: Legend of Technical Analysis
William Delbert Gann entered history as one of the most successful traders of the early twentieth century. Born in 1878 in Texas, he dedicated his life to studying financial market patterns and developed a unique analysis system that remains relevant today.
Gann asserted that market movements follow mathematical and geometric laws. To understand this topic more deeply, I recommend studying the trading rules. Unlike contemporaries, he viewed markets as ordered structures where price and time exist in specific proportions. This approach enabled forecasting trend reversals with high accuracy.
Gann's main legacy includes developing technical analysis tools: lines, fan, grid, box, and the famous Square of 9. Each method is based on the principle of price-time interconnection.
Fundamental Principles of Gann Theory
Gann theory bases on the conviction that markets aren't chaotic. Price and time proportions determine movement direction, and understanding these relationships opens opportunities for accurate forecasting.
The basic principle states: when price and time move in equal proportions, markets remain in equilibrium. Deviation from this balance signals potential reversal or trend acceleration.
Time cycles constitute the most important methodology element. Gann discovered that market events repeat with certain periodicity. Studying historical patterns helps predict future movements.
Crowd psychology was also considered in analysis. Gann understood that market participant emotions — fear and greed — create predictable price behavior patterns.
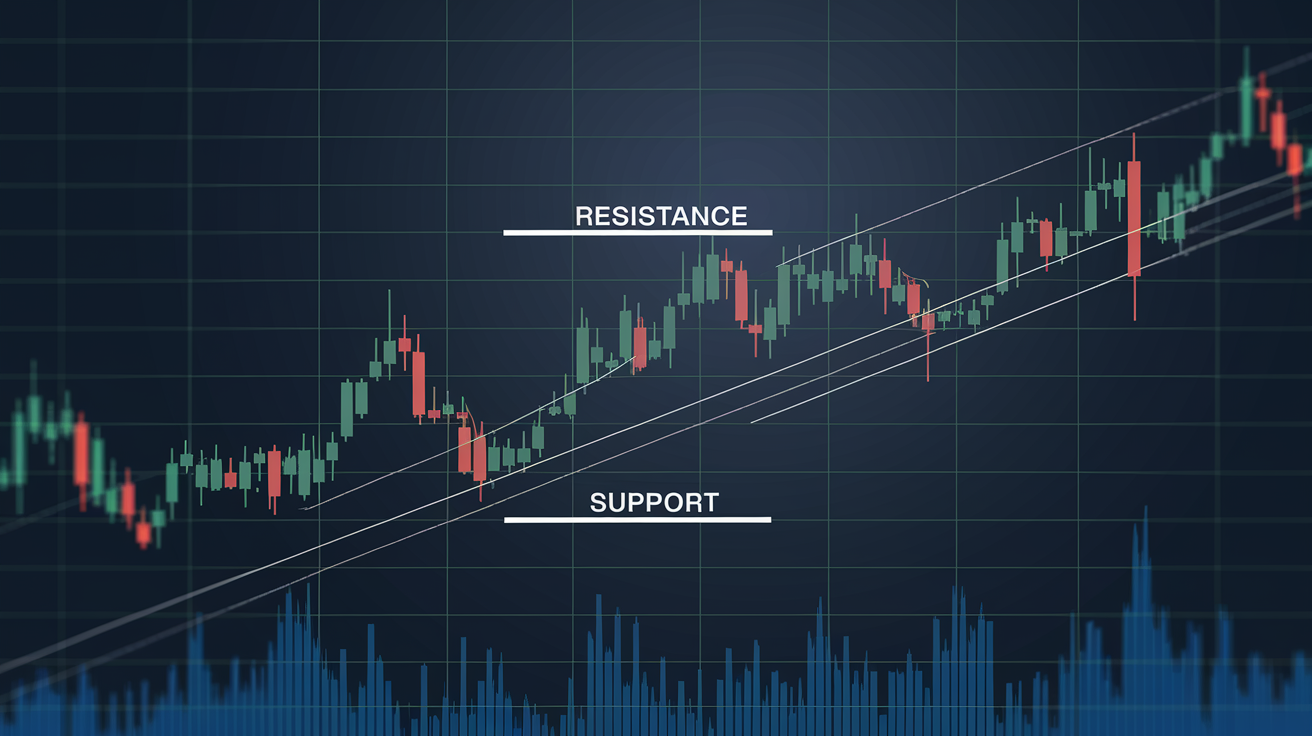
Gann Line: Methodology Foundation
The Gann Line represents a trend line at 45 degrees, designated as 1x1. This angle symbolizes ideal equilibrium: one unit of price change corresponds to one unit of time change.
When price positions above the 1x1 line, markets demonstrate uptrend strength. Positioning below indicates seller dominance. Line crossing often signals market sentiment change.
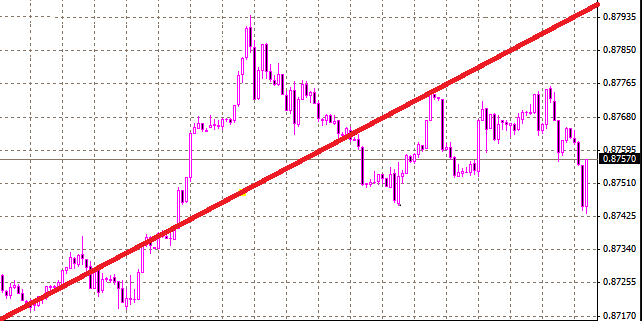
Practical application requires drawing lines from significant lows or highs. Traders use them for determining entry points, placing stop-losses, and taking profits.
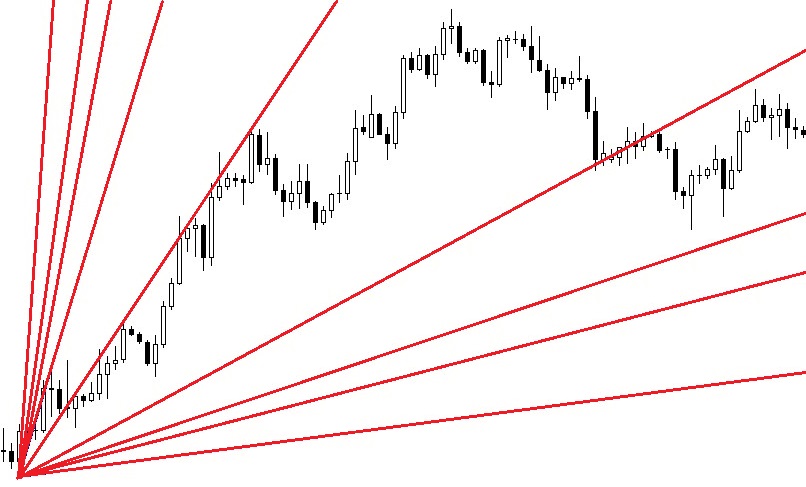
Gann Fan: Multiple Levels
The Gann Fan extends the single line concept, adding trend line sets at various angles. Typical fans include angles 1x1, 2x1, 1x2, 3x1, 1x3, 4x1, 1x4, and 8x1, 1x8.
Each fan line serves as potential support or resistance level. Steeper angles (2x1, 3x1) reflect strong trends, gentler ones (1x2, 1x3) indicate weak or corrective movements.
When one fan line breaks, price typically heads toward the next. This property makes the tool useful for determining movement targets and potential reversal zones.
Gann Grid and Box
The Gann Grid overlays uniform structure on charts, dividing space into squares by price and time. Grid line intersections indicate potential reversal zones.
The tool proves especially effective for identifying price movement symmetry. If previous impulses took certain time units, subsequent ones may prove proportional.
The Gann Box represents rectangular areas bounded by significant extremes. Box boundaries work as support and resistance levels, while dimensions indicate potential amplitude of subsequent movements.
Square of 9: Advanced Tool
The Square of 9 is considered Gann's most complex and mystical tool. This numerical matrix arranges values spiraling from center to periphery.
The main principle involves finding price levels positioned at specific square angles. Numbers on single diagonals or cardinal axes often coincide with actual market reversal levels.
Applying Square of 9 requires deep understanding of mathematical patterns. Experienced traders use it for determining movement targets and entry points with high success probability.
Gann's Trading Rules
Beyond technical tools, Gann formulated successful trading principles based on discipline and psychological risks . management.
Strict adherence to trading plans protects against emotional decisions. Strategy changes under fear or greed influence lead to chaotic actions and losses.
Limiting risk per trade to 2-5% of deposit ensures survival through failure series. Gann emphasized that capital preservation matters more than multiplication.
Partial profit-taking helps avoid losing accumulated income. Greed forcing position holding until the end often leads to market reversals against traders.
Continuous learning and adaptation to changing market conditions distinguish professionals from amateurs. Gann himself continuously improved methods throughout his career.
Practical Application of Gann Methods
Effective Gann tool usage requires comprehensive approaches. Isolated single method application yields less reliable signals than combining several.
Begin by identifying significant extremes on charts. These points become foundations for building lines, fans, and grids. Use multiple timeframes for signal confirmation.
Combine Gann tools with classical technical analysis. Fibonacci levels, candlestick patterns, and volume indicators strengthen forecast accuracy.
Maintain trade journals recording each tool application results. Statistics reveal which methods work better for specific markets and trading styles.
Relevance of Gann Methods Today
Despite algorithmic trading development and new indicator emergence, Gann principles retain practical value. Fundamental price-time relationships haven't changed over the century.
Modern trading platforms include Gann tools in standard sets. This demonstrates professional community recognition of their effectiveness.
Gann methodology disciplines traders, requiring systematic analysis instead of impulsive decisions. This aspect proves especially valuable in eras of information noise and high volatility.
Advantages and Limitations of Gann Methods
Gann tools offer unique combinations of price and time analysis. This comprehensive approach distinguishes them from classical technical analysis indicators working only with price.
The main advantage lies in ability to determine not only reversal levels but also timing of their occurrence. This gives traders opportunities to plan trades in advance.
The geometric nature of tools ensures analysis objectivity. Angles and proportions don't depend on subjective interpretation, unlike many chart patterns.
However, Gann methods require significant time to master. Calculation complexity, especially for Square of 9, discourages beginners. Effective application comes with experience and practice.
Integration with Modern Analysis Methods
Gann tools demonstrate greatest effectiveness combined with other methods. Fibonacci levels often coincide with Gann lines, strengthening significance of certain zones.
Volume analysis confirms or refutes signals generated by geometric tools. Volume increase as price approaches Gann lines raises reaction probability.
Candlestick patterns help determine entry moments. When reversal formations appear on fan lines, signals are considered more reliable.
Momentum indicators add information about current movement strength. Divergence near Gann levels warns of possible trend reversals.
Recommendations for Learning Gann Methodology
Begin mastering with the simplest tool — the 1x1 line. Build it on several charts and observe price reactions. Practice on historical data forms intuitive understanding.
Gradually add the Gann fan, experimenting with various angles. Notice which lines work more often on chosen instruments and timeframes.
Keep detailed records about each tool application. Statistics will show real effectiveness and help develop personal styles for using Gann methods. Continue your learning with the article: Wyckoff Method.
Study Gann's original works and modern interpretations. Understanding the author's philosophy deepens practical application of his tools.
Don't attempt to master all tools simultaneously. Sequential learning yields better results than superficial familiarity with entire methodology.
Frequently Asked Questions
William Delbert Gann (1878-1955) was a legendary American trader and analyst who developed a unique market forecasting system based on mathematics, geometry, and time cycles. His methods are still used by traders worldwide.
The Gann 1x1 line is a trend line at a 45° angle that symbolizes equilibrium between price and time. If price is above the line, the trend is bullish; below it, bearish. This is the fundamental tool in Gann methodology.
The Gann fan is a set of lines at different angles (1x1, 2x1, 1x2, etc.) drawn from a single point. Lines serve as dynamic support and resistance levels. When one line breaks, price typically moves toward the next.
Square of 9 is a numerical matrix where numbers are arranged in a spiral. It's used to determine key price levels and reversal points. Considered one of the most complex but accurate Gann tools.
Yes, Gann methods remain relevant. They're based on fundamental principles of price-time relationships that haven't changed. Many professional traders use Gann tools combined with modern analysis methods.
About the Author
Author: Igor Arapov — independent researcher in trading psychology and behavioral finance, practising trader since 2013, founder of arapov.trade, author of a trading book series (Open Library ), (ORCID: 0009-0003-0430-778X ).