Market Profile: Supply and Demand Analysis by Steidlmayer Method
The Market Profile Concept
Market Profile is a revolutionary market analysis method developed by Peter Steidlmayer in the 1980s while working at the Chicago Board of Trade. Unlike classical technical analysis relying on indicators and chart patterns, Market Profile focuses on the interaction of price, volume, and time, revealing true market structure.
The tool visualizes trading activity distribution across price levels as a horizontal histogram. This allows traders to see where liquidity concentrates, how supply and demand zones form, and where large participants accumulate or distribute positions. Understanding these mechanisms opens paths to predicting market movements with high accuracy and precision.
The method proves especially valuable for analyzing futures, forex , and cryptocurrency markets where sufficient trading volume ensures signal reliability. Market Profile's versatility makes it applicable across any timeframe — from intraday scalping to position trading. Traders worldwide use this instrument to gain advantages over participants relying solely on traditional analysis methods.
Key Components
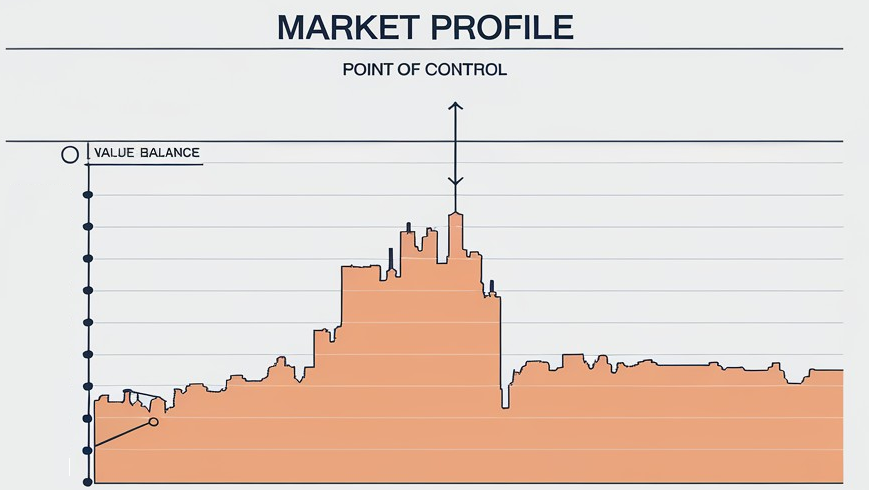
Point of Control (POC)
Point of Control represents the price level with maximum trading volume for the selected period. This point of greatest agreement between buyers and sellers indicates the zone where market spent the most time. POC often acts as a price magnet and serves as dynamic support or resistance depending on approach direction.
Value Area (VA)
Value Area is the price range covering approximately 70% of total trading volume for the session. This zone reflects the fair value area according to market participants. The upper boundary (VAH) and lower boundary (VAL) serve as key levels for determining market context and finding entry points.
High Volume Nodes and Low Volume Nodes
High Volume Nodes (HVN) are zones with high volume concentration where price tends to consolidate. Markets rest at these levels before the next impulse. Low Volume Nodes (LVN) are areas with minimal volume through which price moves quickly. LVN often serve as dividers between supply and demand zones indicating potential breakout areas.
Initial Balance
Initial Balance is the price range formed during the first trading hour. It establishes the day's initial structure and assesses potential volatility. Breaking Initial Balance boundaries often signals the session's main movement direction. Wide IB indicates high volatility while narrow IB suggests strong movement likelihood after breakout. To understand this topic more deeply, I recommend studying market auction.
Supply and Demand Balance Analysis
Market Profile's primary task involves identifying equilibrium and imbalance zones between buyers and sellers. When markets reach equilibrium, price oscillates within Value Area. Breaking beyond its boundaries signals shifting force balance and potential trending movement initiation.
Value Area expansion indicates growing liquidity and participant activation — often preceding sustained trend formation. VA contraction conversely suggests declining interest and approaching consolidation or sharp breakout periods in one direction or another.
POC shifting in specific directions reflects changing market sentiment. Upward movement confirms buyer strength while downward movement indicates seller dominance. Stable POC across multiple sessions points to sustained zones of large participant interest where institutions defend their positions.
Practical Trading Scenarios
Trading from Value Area Boundaries
When price approaches VAH or VAL, traders assess market reaction. Bounces from boundaries with volume confirmation create opportunities for trades toward POC. Breaking boundaries with consolidation above VAH or below VAL signals potential continuation beyond equilibrium zones.
Using POC as a Level
Previous session POC often serves as significant levels for current days. Price gravitates toward POC during consolidations and pushes away during directional movement formation. Confluence of multiple session POCs amplifies level significance and increases execution probability.
Trading LVN Breakouts
Low volume zones serve as potential price acceleration areas. LVN breakouts often accompany impulsive movements since these zones lack resistance from accumulated positions. Traders use LVN for determining movement targets and placing stop-losses beyond these zones for protection. To apply this knowledge, study VWAP.
Advantages and Limitations
Market Profile reveals actions of large participants — banks, hedge funds, and market makers — through analyzing accumulation and distribution liquidity zones. The tool provides objective support and resistance levels based on actual trading activity rather than subjective interpretation of chart patterns.
Application flexibility allows using Market Profile across various timeframes and instruments. Intraday traders analyze 30-minute profiles for entry points while swing traders work with daily profiles for medium-term targets. Position traders study weekly profiles for understanding global market structure and institutional positioning.
The method requires learning time due to specific terminology and market microstructure understanding necessity. Unlike automated indicators, Market Profile involves manual analysis, increasing interpretation's subjective component and requiring practical experience accumulation over time.
Tool effectiveness decreases in low-liquidity markets where insufficient trading volume distorts profiles and makes levels less reliable. For maximum returns, Market Profile combines with delta volume, candlestick patterns , and order flow analysis, creating multidimensional market activity pictures.
Integration into Trading Systems
Market Profile mastery begins with historical data practice. Analyze how price reacted to POC, VA boundaries, and LVN zones in past sessions. Track patterns between profile behavior and subsequent market movements across various timeframes to build understanding.
Combining Market Profile with Fibonacci levels , volume analysis , and technical patterns improves signal accuracy. Multiple method confluence on single levels amplifies their significance and execution probability significantly.
Test strategies on demo accounts before applying real capital. Platforms like NinjaTrader, ATAS, and TradingView provide tools for building Market Profile and analyzing historical profiles across various instruments with detailed customization options.
Maintaining trading journals with Market Profile-based trade records helps identify approach strengths and weaknesses. Record trade context, entry and exit levels, and results for objective method effectiveness assessment over time.
Conclusion
Peter Steidlmayer's Market Profile remains one of the deepest methods for understanding market structure. The tool reveals price formation mechanisms through volume, time, and price level interaction, providing traders advantages in predicting movements across all financial market types.
Systematic Market Profile application combined with risk management and execution discipline forms professional trading approach foundations. Time investment in mastering this method pays off through improved trading decision quality and long-term result stability.
Key Market Profile principles: POC serves as fair price reference, Value Area outlines participant agreement zones, LVN indicates potential movement acceleration areas. Combining these elements creates comprehensive market dynamics pictures for informed decision-making. To consolidate this material, study also the Wyckoff Method.
Remember that Market Profile is a context analysis tool rather than trade signal generator. Its value emerges from understanding where price sits relative to large participant interest zones and which development scenarios are most probable in current situations.
Frequently Asked Questions
Market Profile is a market analysis method developed by Peter Steidlmayer that visualizes volume distribution across price levels and helps determine fair value of assets.
POC is the price level with maximum trading volume for the period. It indicates the zone of greatest agreement between buyers and sellers.
Value Area is the price range covering approximately 70% of total trading volume for the session. This zone shows where market participants consider price to be fair.
HVN (High Volume Nodes) are zones with high volume concentration where price tends to consolidate. LVN (Low Volume Nodes) are areas with low volume through which price moves quickly.
Market Profile is universal and applies to futures, stock, forex, and cryptocurrency markets with sufficient trading volume.
About the Author
Author: Igor Arapov — independent researcher in trading psychology and behavioral finance, practising trader since 2013, founder of arapov.trade, author of a trading book series (Open Library ), (ORCID: 0009-0003-0430-778X ).