What is an Order Block
Order Block represents a specific price zone where large institutional participants accumulated or distributed their positions. These areas form before significant price movements and serve as reference points for identifying entry opportunities. Understanding order block mechanics enables traders to align with institutional capital flow.
The concept of order blocks is part of the methodology Smart Money, which studies the behavior of institutional players. Unlike standard support levels and resistance, order blocks indicate specific entry points of large participants into the market. This makes them significantly more reliable for predicting future price reactions.
The concept builds on the principle of unfilled orders. Institutional players operate volumes impossible to execute instantly without impacting price. Part of their orders remains unfilled in the accumulation zone. When price returns to this area, remaining orders activate, causing predictable market reaction.
Order blocks differ from standard support and resistance levels through their specificity. They always precede impulse movements and reflect concrete entry points of large participants. This makes them significantly more reliable for predicting future price behavior.
Characteristics of Quality Order Blocks
Not every consolidation qualifies as an order block. Specific criteria distinguish genuine zones of institutional interest from random price fluctuations. Traders must learn to recognize these signs to improve analysis accuracy. To understand this topic more deeply, I recommend studying Imbalance and FVG.
Impulse movement following formation is mandatory. A genuine order block always precedes strong directional movement. If price continues sideways after a consolidation zone, it is not an order block. The impulse must be significant and unidirectional.
Volume activity confirms large participant presence. Volume analysis tools reveal anomalous spikes in trading activity. Low volume in a presumed block questions its significance. High volume indicates real institutional interest.
Structural integrity matters for subsequent analysis. Order blocks should have clear boundaries defined by candle extremes in the formation zone. Blurred areas with multiple wicks prove less reliable.
Types of Order Blocks
Order block classification bases on subsequent impulse direction and role in market structure. Each type requires specific approach to analysis and trading.
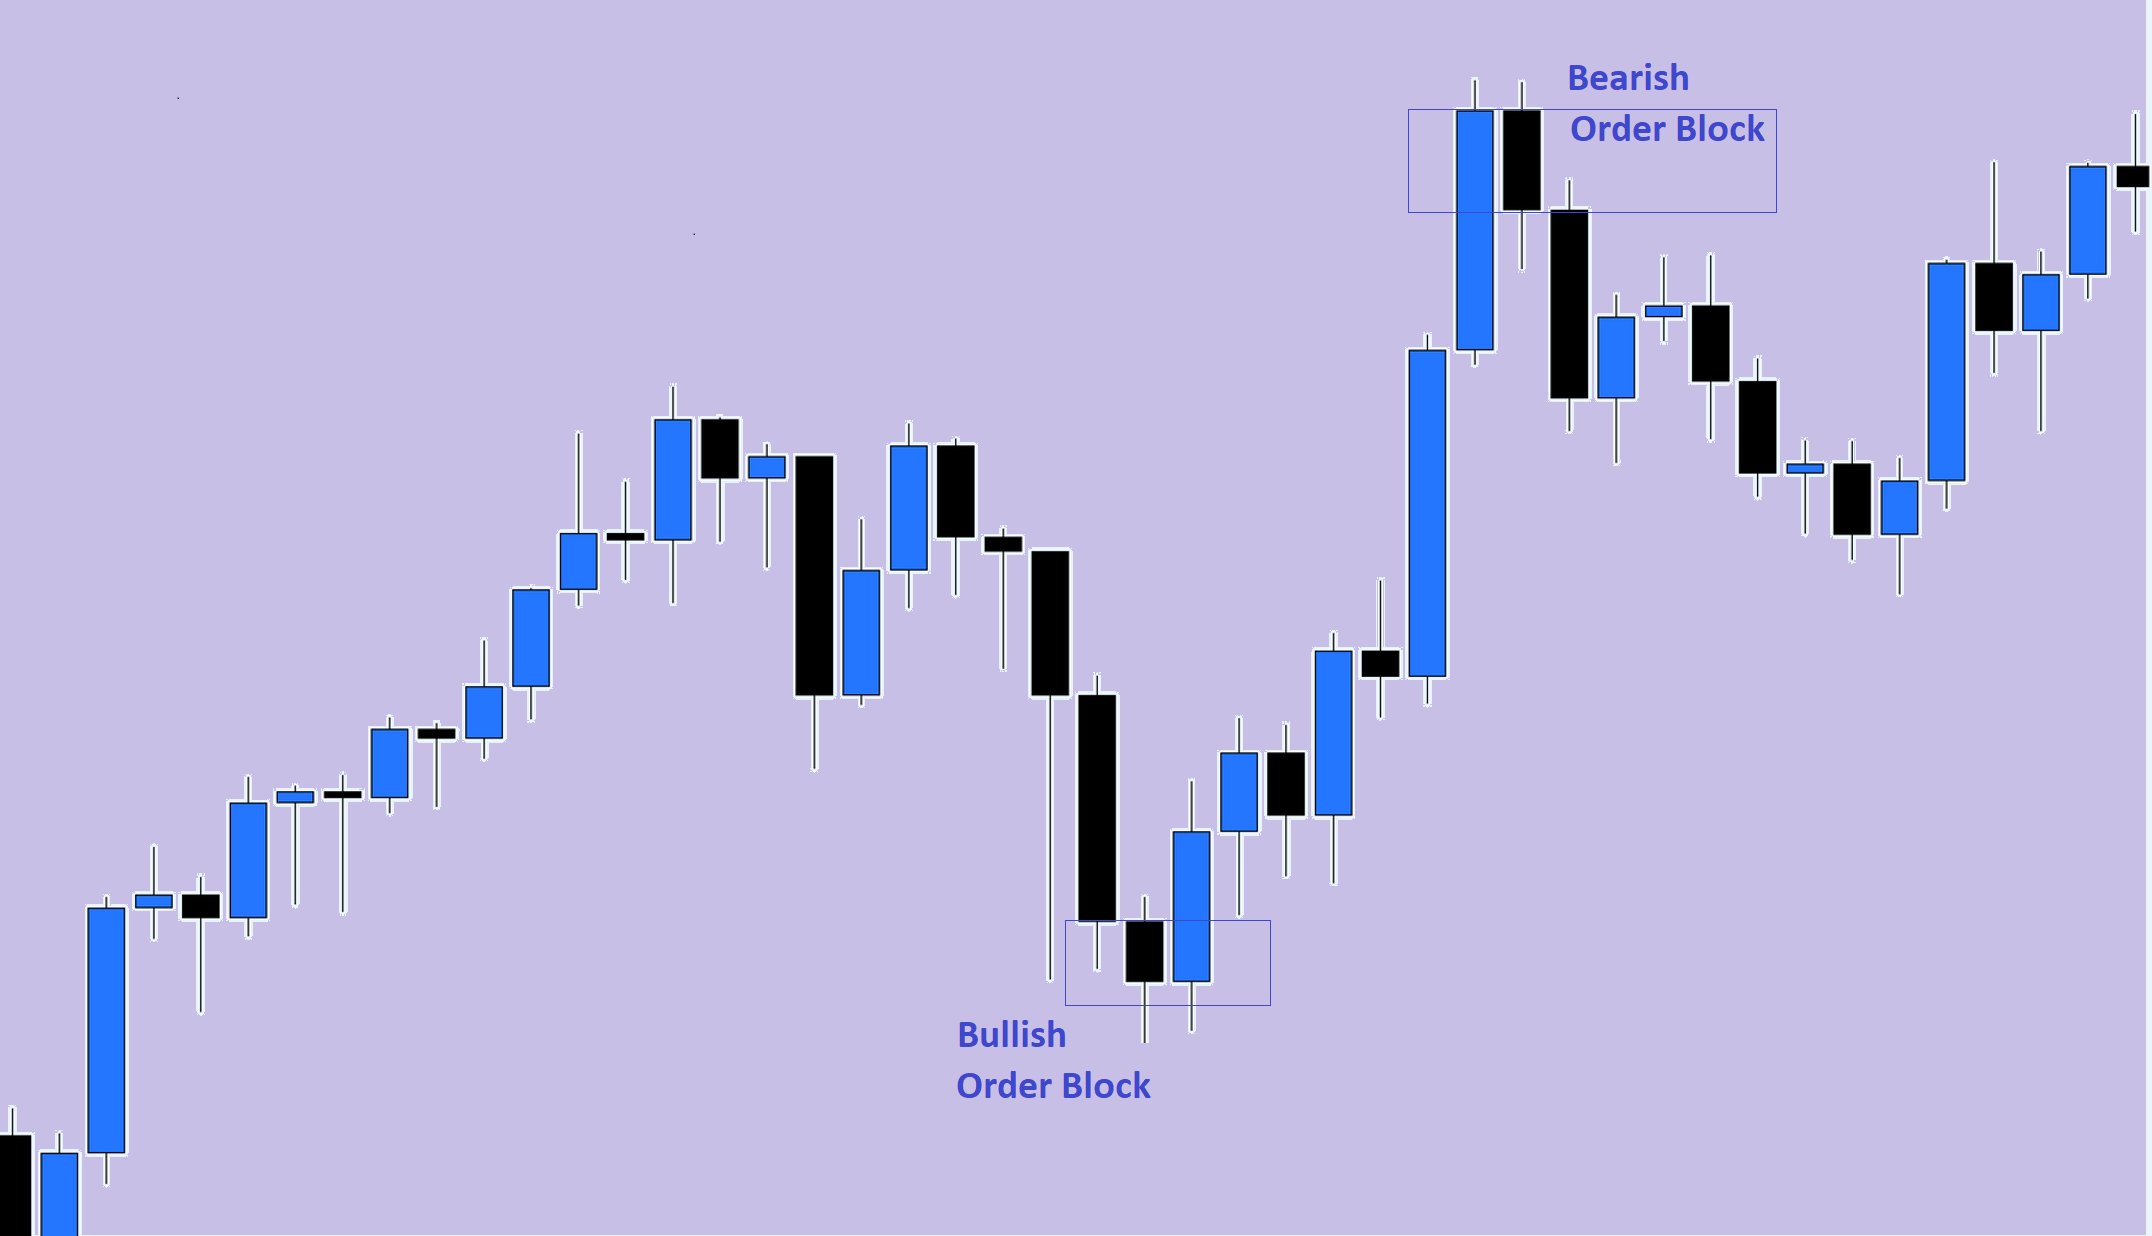
Bullish order block forms as the last bearish candle before strong upward impulse. This zone represents the accumulation area where institutional buyers built long positions. When price returns to a bullish block, buyer reaction and continued growth are expected.
Identification begins with finding strong upward movement. Then the last downward candle before this impulse is determined. Block boundaries are the high and low of this candle.
Bearish order block presents the mirror situation. It forms as the last bullish candle before strong downward movement. Here institutional sellers distributed positions before the decline. Price returning to a bearish block creates opportunity for short positions.
Breaker block occurs when order block structure is violated. When price breaks through a block and closes beyond it, the zone's role changes. Former bullish block becomes resistance zone, bearish converts to support.
Mitigation block forms in zones of inefficient price delivery. These are areas where price moved too quickly, leaving gaps. The market tends to return to these zones to fill the inefficiency.
Methodology for Block Identification
Accurate order block identification requires systematic approach and market context understanding. Mechanical rule application without structural consideration leads to errors.
Market structure analysis precedes block search. Current trend must be determined through sequence of highs and lows. In uptrend, priority goes to bullish blocks; in downtrend, to bearish.
Impulse movement identification is the next step. The impulse should create new structural points or break significant levels. Weak movements without structural changes do not form quality blocks.
Volume confirmation strengthens analysis credibility. Volume Profile shows trading activity concentration. High volume in the presumed block zone confirms institutional interest.
Trading Strategies on Order Blocks
Practical application implements through several proven strategies. Choice depends on market conditions and individual trading style.
First touch trading represents the classic approach. When price first returns to an order block after formation, strong reaction is expected. Entry executes when price reaches block boundary with stop loss beyond the opposite boundary.
Confirmed reaction trading reduces false signal risk. Trader waits for candlestick pattern formation in the block zone. Reversal formations like pin bar, engulfing, or hammer confirm buyer or seller activity.
Breakout and retest trading applies to breaker blocks. After order block breakout, trader awaits price return to broken zone. Entry executes on retest with confirmation of level role change.
Position and Risk Management
Competent risk management determines long-term trading profitability. Even accurate analysis does not guarantee every trade's success, making risk control mandatory.
Stop loss placement considers block structure and market volatility. Basic rule assumes stop placement beyond block boundary. For bullish block, this is level below zone minimum; for bearish, above maximum.
Buffer zone adds to basic stop for false breakout protection. Buffer size depends on instrument volatility and timeframe.
Profit target determination bases on market structure. Nearest targets locate at previous highs or lows, liquidity zones, and opposite order blocks. Risk to reward ratio should be minimum one to two.
Position size calculates from maximum allowable risk per trade. Professional traders limit risk to one to two percent of deposit.
Combining with Other Tools
Order blocks work most effectively combined with additional analysis methods. Comprehensive approach increases signal accuracy.
Fibonacci levels often coincide with order blocks. Retracements to sixty-one and eight-tenths percent zones frequently land on institutional interest areas. Confluence strengthens level significance.
Liquidity zones indicate potential movement targets. Stop order clusters beyond obvious levels attract price before reversal. Order blocks near liquidity zones carry elevated probability of working.
Time analysis adds temporal dimension to price analysis. London and New York sessions characterize by elevated institutional activity. Order blocks formed during these periods carry greater significance.
Common Trader Mistakes
Beginners make characteristic errors working with order blocks. Recognizing these patterns helps avoid losses.
Ignoring market structure leads to counter-trend trading. Bullish block in downtrend has low probability of working. Structure determines direction; order blocks are merely entry points.
Overvaluing every consolidation transforms analysis into searching for nonexistent signals. Not every sideways movement is an order block. Impulse after formation and volume confirmation are required. To consolidate this material, study also Smart Money Strategies.
Too-close stop losses get hit by false breakouts. Price often tests block boundaries before true reaction. Insufficient buffer leads to premature closure of potentially profitable trades.
Frequently Asked Questions
Order Block is a specific price zone where large institutional participants accumulated or distributed positions before significant price movements.
A bullish order block is identified as the last bearish candle before a strong upward impulse. Block boundaries are the high and low of this candle.
Unlike standard levels, order blocks indicate specific entry points of large participants and always precede impulse movements.
Classic strategy is trading on block retest. When price returns, reaction is expected. Entry with candlestick pattern confirmation increases success probability.
Stop loss is placed beyond block boundary with buffer zone. For bullish block — below zone minimum, for bearish — above maximum.
About the Author
Author: Igor Arapov — independent researcher in trading psychology and behavioral finance, practising trader since 2013, founder of arapov.trade, author of a trading book series (Open Library ), (ORCID: 0009-0003-0430-778X ).