How to Predict Price in Trading: Complete Guide
Price forecasting is the cornerstone of successful trading. Whether you trade forex , stocks, or cryptocurrencies, your ability to anticipate market movements directly impacts your profitability. Understanding how prices move and why they move allows traders to identify high-probability setups and manage risk effectively. To understand this topic more deeply, I recommend studying the complete guide to Smart Money.
Financial markets represent a complex ecosystem where millions of participants make decisions based on countless variables. Some traders rely on charts and patterns, others focus on economic data and news events. The most successful traders typically combine multiple approaches to gain a comprehensive market perspective.
Core Methods of Price Prediction
Modern trading offers several proven approaches to market analysis. Each method has unique strengths and limitations, which is why professional traders rarely rely on a single technique.
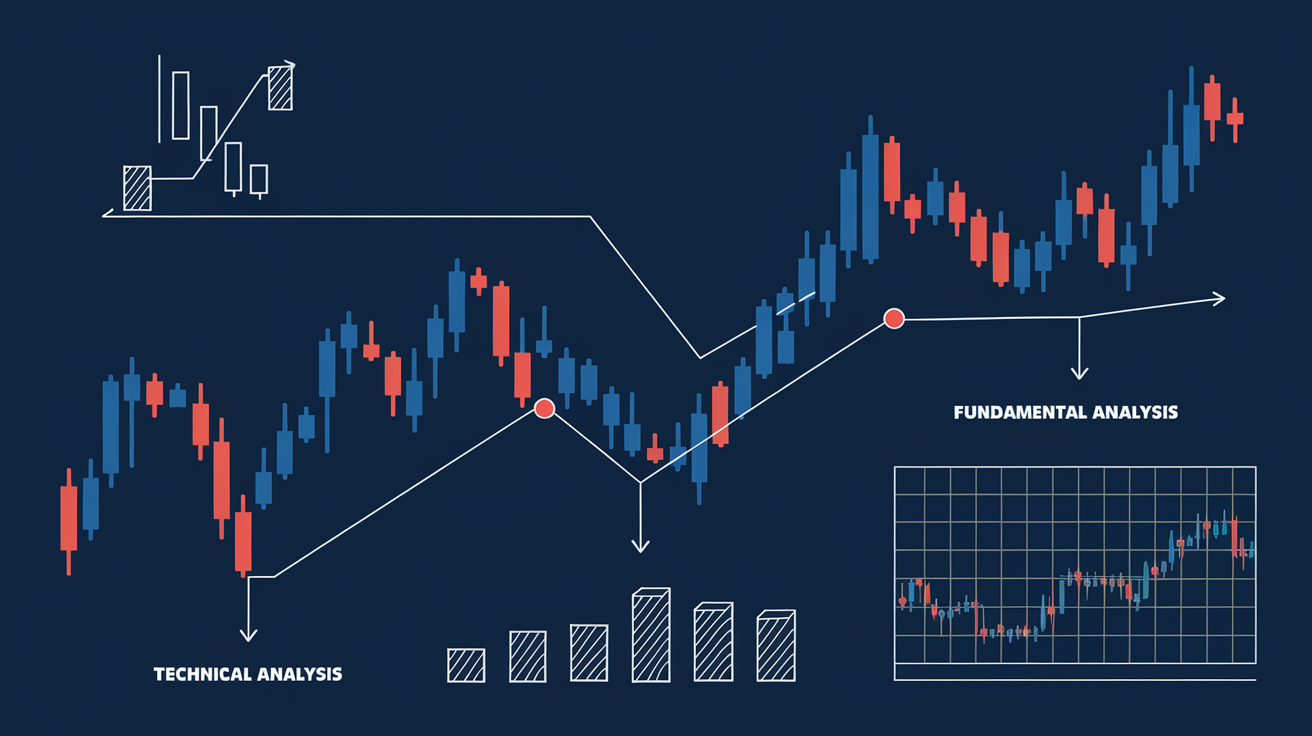
Technical analysis examines historical price data to identify patterns and trends. Practitioners believe that all available information is already reflected in price action, and that market behavior tends to repeat itself. Chart patterns, technical indicators, and support resistance levels form the foundation of technical analysis.
Fundamental analysis evaluates economic, political, and financial factors that influence asset values. Interest rates, inflation data, corporate earnings, and geopolitical events all contribute to the fundamental picture. This method is particularly valuable for longer-term market forecasts.
Quantitative analysis applies mathematical models and statistical methods to uncover hidden patterns in market data. Regression analysis, machine learning algorithms, and automated trading systems represent the cutting edge of quantitative trading.
Sentiment analysis studies the collective psychology of market participants. Fear, greed, and herd behavior often drive short-term price movements and create opportunities for contrarian traders who understand crowd dynamics.
Technical Analysis Fundamentals
Technical analysis remains the most popular method among retail traders due to its visual nature and practical applicability. It provides clear frameworks for analyzing market conditions and making trading decisions.
Chart patterns represent recurring formations that signal potential price movements. Continuation patterns like flags, pennants, and triangles suggest the current trend will likely resume. Reversal patterns such as head and shoulders, double tops, and double bottoms indicate potential trend changes.
Support level and resistance level mark price zones where buying or selling pressure historically concentrated. These levels act as psychological barriers where orders accumulate. A decisive break through a significant level often triggers strong momentum moves as stops are triggered and new positions are initiated.
Trend analysis helps identify the dominant market direction. Uptrends feature higher highs and higher lows, while downtrends show lower highs and lower lows. Trading in the direction of the established trend statistically improves win rates and risk-reward ratios.
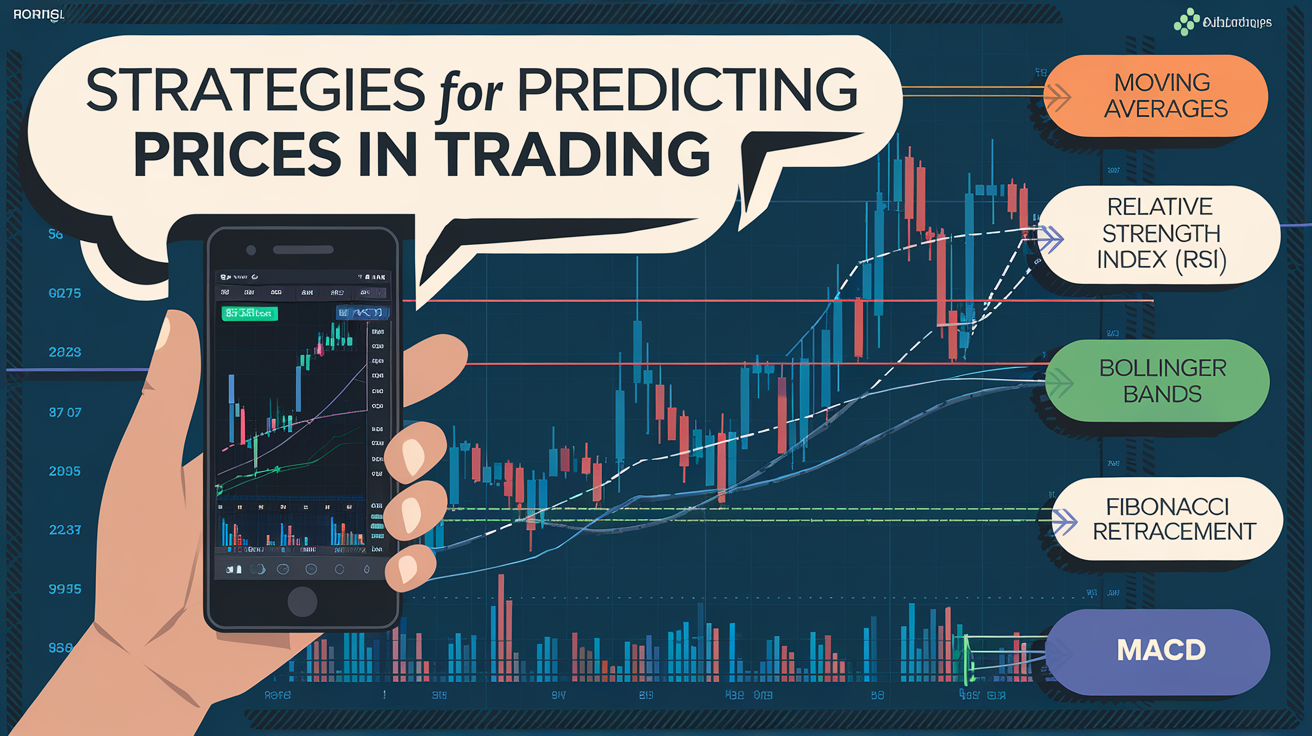
Essential Technical Indicators
Technical indicators transform raw price data into actionable signals. Proper indicator usage significantly enhances forecast accuracy when combined with price action analysis.
Moving average smooths price fluctuations and reveals trend direction. Simple moving averages calculate the arithmetic mean over a specified period, making them suitable for identifying longer-term trends. Exponential moving averages weight recent prices more heavily, providing faster signals for short-term trading. Moving average crossovers generate trading signals when faster averages cross slower ones.
MACD indicator combines trend-following and momentum characteristics. It consists of two lines and a histogram that display trend strength and direction. Divergence between price and MACD often precedes trend reversals, making this indicator valuable for identifying potential turning points.
RSI measures the speed and magnitude of price changes to identify overbought or oversold conditions. Readings above seventy suggest overbought conditions, while readings below thirty indicate oversold levels. RSI divergence with price provides powerful reversal signals that often precede significant moves.
Bollinger Bands measure market volatility and help identify extreme price levels. Band contraction signals decreasing volatility and often precedes strong breakout moves. Band expansion confirms high volatility during trending conditions. Price touching the outer bands can indicate potential reversal zones.
The Ichimoku indicator provides a comprehensive market view, displaying trend direction, support resistance levels, and momentum simultaneously. The cloud formation visually demonstrates equilibrium zones and potential reversal areas.
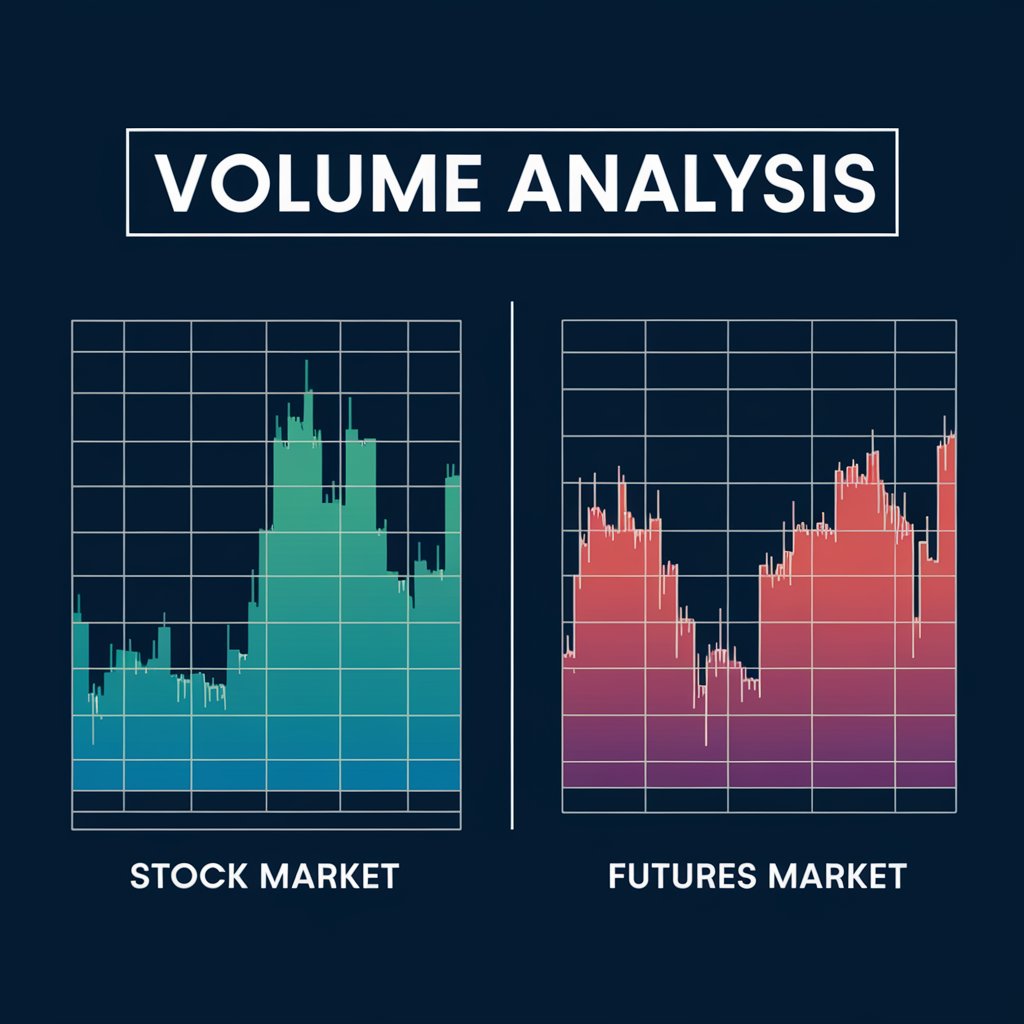
Volume Analysis in Price Forecasting
Volume analysis examines the number of transactions executed during a specific period. Analyzing volume helps traders understand the true strength behind price movements and detect institutional activity.
Volume confirmation is a fundamental principle of technical analysis. Price advances on high volume confirm uptrend strength, suggesting genuine buying interest. Price declines on high volume indicate active selling pressure and potential trend continuation.
Volume divergence warns of potential trend changes. When price makes new highs but volume decreases, the trend may be weakening. Abnormally high volume spikes often accompany institutional activity and can precede significant price moves as large players establish or liquidate positions.
Volume profile analysis shows trading activity distribution across different price levels. High volume zones often act as support and resistance because many market participants hold positions at these levels.
Fundamental Analysis for Market Forecasting
Fundamental analysis proves essential for longer-term forecasting and understanding broader market trends. It provides context for technical signals and helps traders align with major market forces.
Macroeconomic indicators influence currency pairs, stock indices, and commodity markets. Central bank interest rate decisions, inflation reports, GDP figures, and employment data shape the economic environment for trading. Understanding how markets typically react to these releases improves forecast accuracy.
Corporate financial reports determine individual stock valuations. Earnings, revenue growth, debt levels, and management guidance represent key factors for equity analysis. Comparing actual results to analyst expectations often triggers significant price reactions.
Geopolitical events can dramatically alter market dynamics. Elections, trade disputes, sanctions, and international conflicts create volatility and new trading opportunities. Staying informed about global developments helps traders anticipate potential market-moving events.
Practical Forecasting Strategies
Effective price forecasting requires a systematic approach and clear methodology. Professional traders employ proven strategies that combine multiple analytical tools.
Multiple timeframe analysis examines charts across different time intervals. Higher timeframes establish the dominant trend direction, while lower timeframes identify optimal entry points. This approach allows traders to align with major trends while achieving precise trade execution.
Indicator combination improves signal reliability. Using a trend indicator alongside an oscillator and volume analysis provides a more complete market picture. However, overloading charts with too many indicators creates confusion and conflicting signals.
Correlation analysis helps predict one asset movement based on another asset dynamics. Gold and the US dollar typically show inverse correlation. Oil prices influence currencies of exporting nations. Understanding these relationships expands forecasting possibilities and provides confirmation for trade ideas.
Common Forecasting Mistakes
Even experienced traders make forecasting errors. Recognizing common mistakes helps avoid them and improves overall trading performance.
Ignoring the trend leads to losses from fighting the dominant market direction. Trend-following strategies statistically outperform counter-trend approaches. Always identify the prevailing trend before seeking entry opportunities.
Overconfidence in forecasts causes traders to risk excessive amounts on single trades. Markets always contain uncertainty, making position sizing and risk management essential regardless of conviction level.
Lack of signal confirmation increases false entry frequency. Single indicators or patterns provide insufficient confidence. Always seek confirmation from multiple sources before committing capital.
Emotional decision-making destroys even the best forecasts. Fear causes premature profit-taking, while greed leads to holding losing positions too long. Developing emotional discipline separates consistently profitable traders from the majority.
Risk Management Integration
Even the most accurate forecast cannot guarantee profits without proper risk management. Markets can move against expectations due to unexpected events or large player activity.
Position sizing should reflect forecast probability and potential risk-reward ratio. Risking no more than one to two percent of account equity per trade preserves capital through inevitable losing streaks.
Stop-loss orders protect against significant losses when forecasts prove incorrect. Place stops at technically justified levels beyond nearby support or resistance, allowing normal market fluctuation while limiting downside exposure.
Take-profit targets lock in gains when price reaches objective levels. Maintaining minimum risk-reward ratios of one to two, preferably one to three, ensures profitable trading even with moderate win rates.
Psychology of Price Forecasting
Trader psychology directly impacts forecast quality and execution. Emotional control remains essential for consistent trading success.
Cognitive biases distort market information processing. Confirmation bias causes traders to seek only evidence supporting their existing positions. Recency bias overweights recent events in decision-making. Recognizing these biases enables more objective analysis.
Discipline in following trading plans matters more than individual forecast accuracy. Consistently executing a strategy with positive expectancy produces profits over time regardless of short-term results.
Patience allows waiting for optimal trading opportunities. Not every signal deserves a trade. Selecting only high-probability setups where forecasts have the greatest likelihood of success improves overall performance.
Conclusion and Key Principles
Price forecasting is a comprehensive process requiring knowledge, experience, and discipline. Successful traders combine various analytical methods, continuously improve their skills, and strictly follow risk management rules.
Technical analysis provides tools for identifying entry and exit points. Fundamental analysis shapes understanding of global trends. Volume analysis confirms signal validity. Psychological preparation ensures disciplined strategy execution. To consolidate this material, also study the Wyckoff Method.
Remember that no method provides perfect accuracy. Markets represent probabilistic environments, and the trader task involves finding positive expectancy situations while managing risk appropriately. A systematic forecasting approach combined with continuous self-improvement forms the foundation for long-term trading success.
Develop your skills gradually, starting with simple methods and progressively adding more sophisticated tools. Practice on demo accounts before risking real capital. Analyze both successes and failures to continuously refine your approach to forecasting price movements in financial markets.
Frequently Asked Questions About Price Forecasting
The most effective approach combines technical and fundamental analysis with volume analysis. Technical analysis identifies entry points, fundamental analysis determines overall direction, and volume analysis confirms signal validity.
The most popular indicators include moving averages (MA, EMA) for trend identification, RSI for overbought/oversold conditions, MACD for momentum and reversals, Bollinger Bands for volatility, and Ichimoku for comprehensive analysis.
Volume confirms the strength of price movements. Rising prices on high volume confirm the trend. Volume divergence with price warns of potential reversals. Abnormal volume spikes signal institutional activity.
Multiple timeframe analysis allows seeing the bigger picture on higher timeframes while finding precise entries on lower ones. This improves win rates and risk-reward ratios by aligning trades with dominant trends.
The biggest mistake is trading against the trend without valid reasons and ignoring risk management. Even accurate forecasts cannot guarantee profits if a trader risks too much capital on single trades.
About the Author
Author: Igor Arapov — independent researcher in trading psychology and behavioral finance, practising trader since 2013, founder of arapov.trade, author of a trading book series (Open Library ), (ORCID: 0009-0003-0430-778X ).