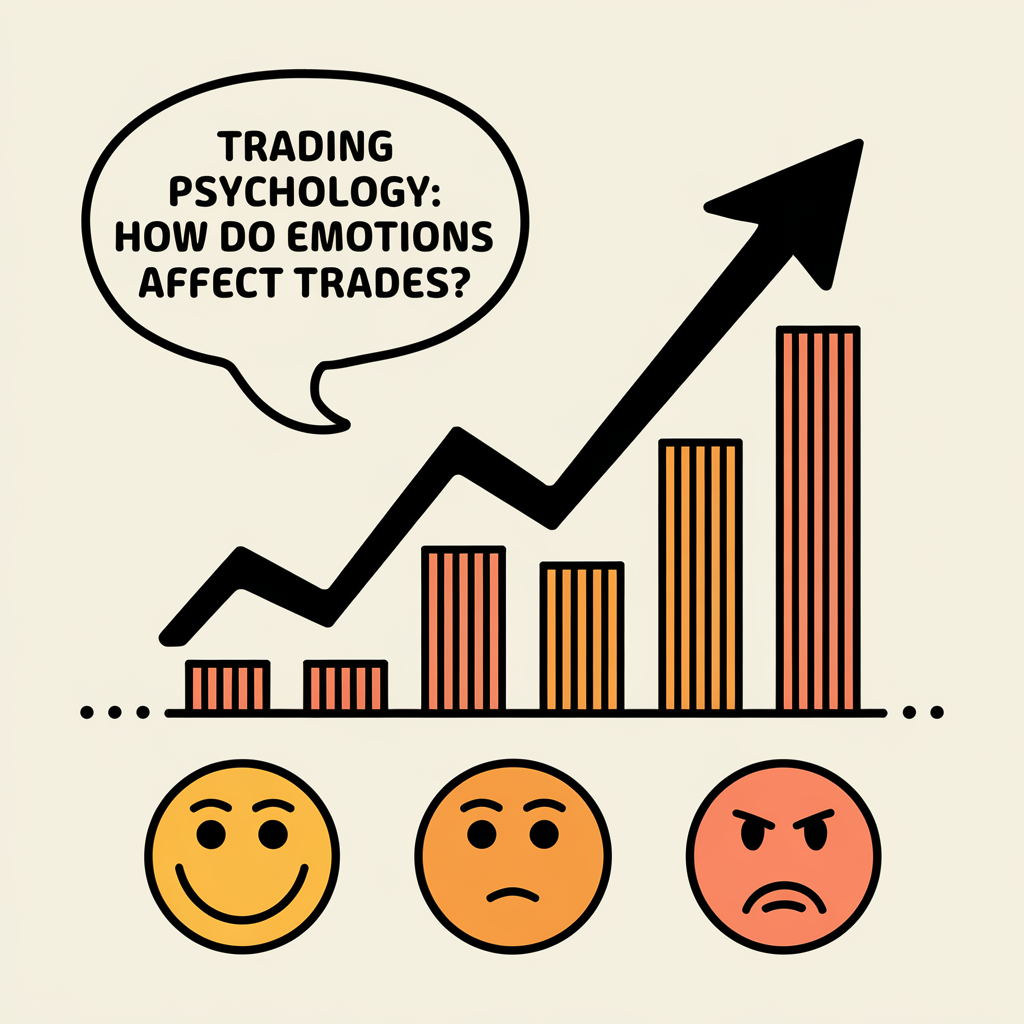
In the early twentieth century, Richard Wyckoff formulated principles that remain relevant a century later. His method is based on a simple idea: markets don't move chaotically but follow specific laws dictated by the balance of supply and demand. Behind every price movement stand specific participants — and understanding their logic gives traders an edge.
The Wyckoff Method isn't a set of indicators but a way of thinking. It teaches you to see real participants behind the chart: large institutional players (Smart Money) who accumulate positions before rallies and distribute them before declines. Understanding their actions allows you to trade on their side, not against them. I also recommend studying peak volume levels for a complete picture.
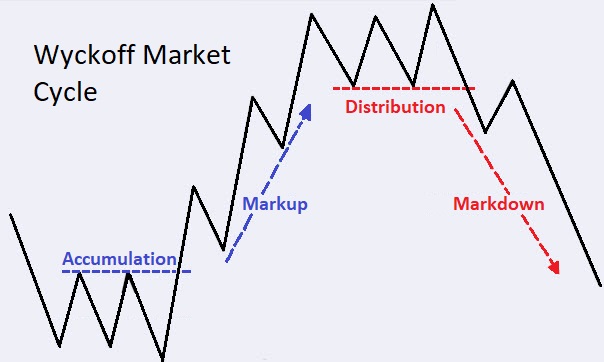
Four Phases of the Market Cycle
Wyckoff identified four phases every asset goes through: accumulation, markup (uptrend), distribution, and markdown (downtrend). These phases repeat on any timeframe and any market — from stocks to cryptocurrencies.
The accumulation phase begins after prolonged decline. Price enters a sideways range where large players gradually buy the asset from panicking retail traders. Volume in this phase is uneven: spikes on lows indicate Smart Money buying. The key sign of accumulation ending is the Spring: a false breakdown below support with quick return above.
After accumulation comes the markup phase. Price breaks above the range's upper boundary on high volume — this is the SOS (Sign of Strength). Pullbacks occur on low volume, new highs on high volume. The trend continues while this pattern persists.
Distribution mirrors accumulation. After a rally, price enters a sideways range where large players sell to retail buyers. Volume increases on highs without trend continuation. The phase ends with an Upthrust — a false breakout above resistance. Then markdown begins.
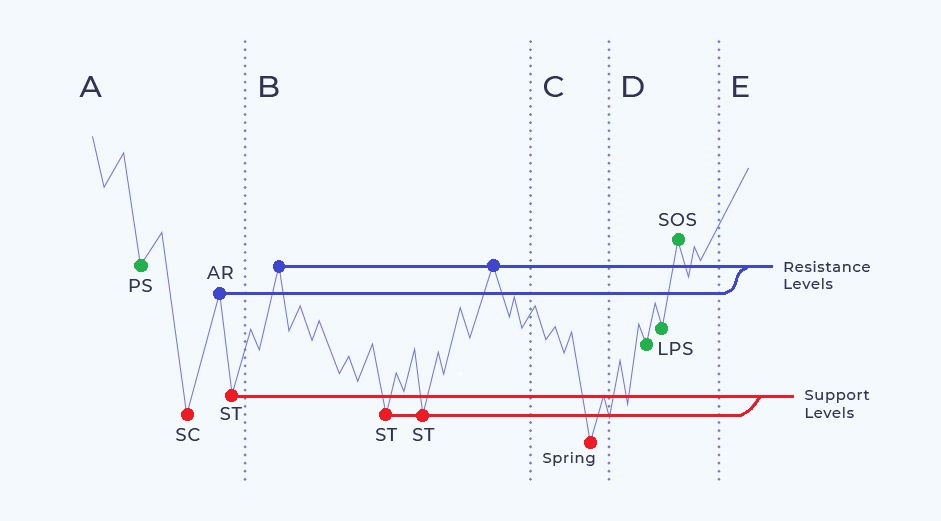
Key Points in Wyckoff Structure
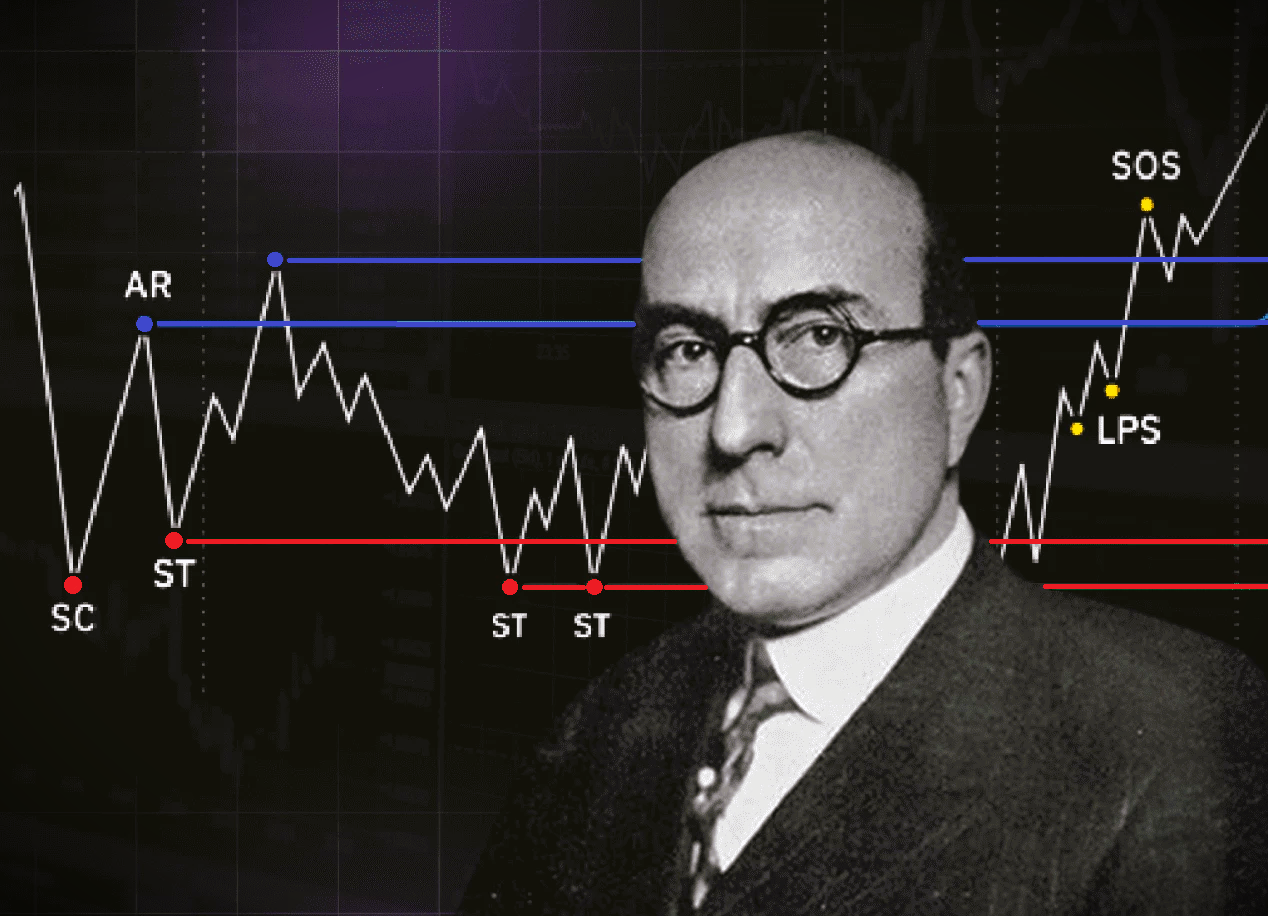
SC (Selling Climax) — panic selling peak. Sharp decline on extremely high volume when panic reaches maximum. Smart Money start buying from those selling in fear. This is the first potential reversal signal.
AR (Automatic Rally) — technical bounce after SC. Short covering drives price higher. Forms the upper boundary of the future accumulation range. Volume decreases compared to SC.
ST (Secondary Test) — retest of the SC low. Price returns to the selling climax zone but volume is significantly lower. If the low holds — buyers are in control.
LPS (Last Point of Support) — final support test before breakout. Price tests the range's lower boundary with minimal volume. This is the optimal entry point for long positions.
SOS (Sign of Strength) — the breakout. Price breaks above the range's upper boundary on sharp volume increase. Confirms accumulation completion and uptrend start.
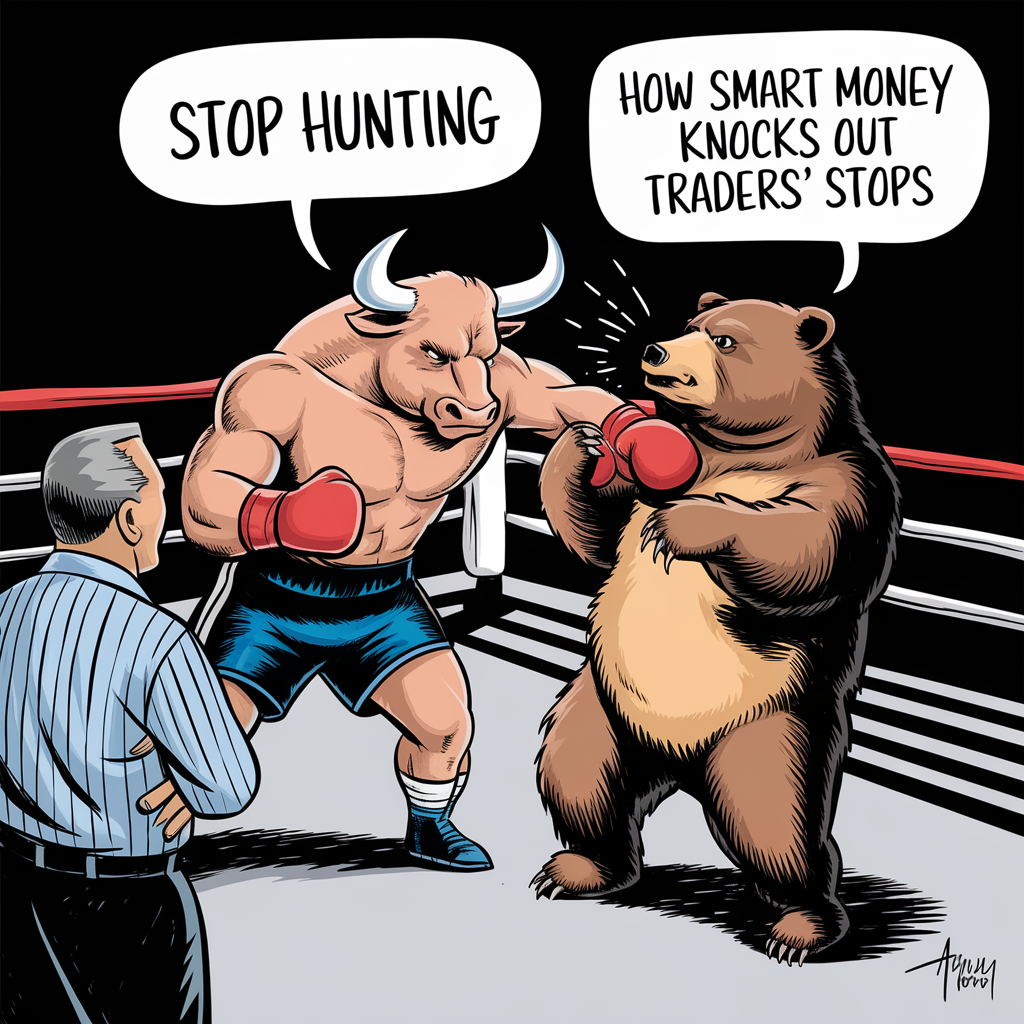
Spring and Upthrust: Traps for the Crowd
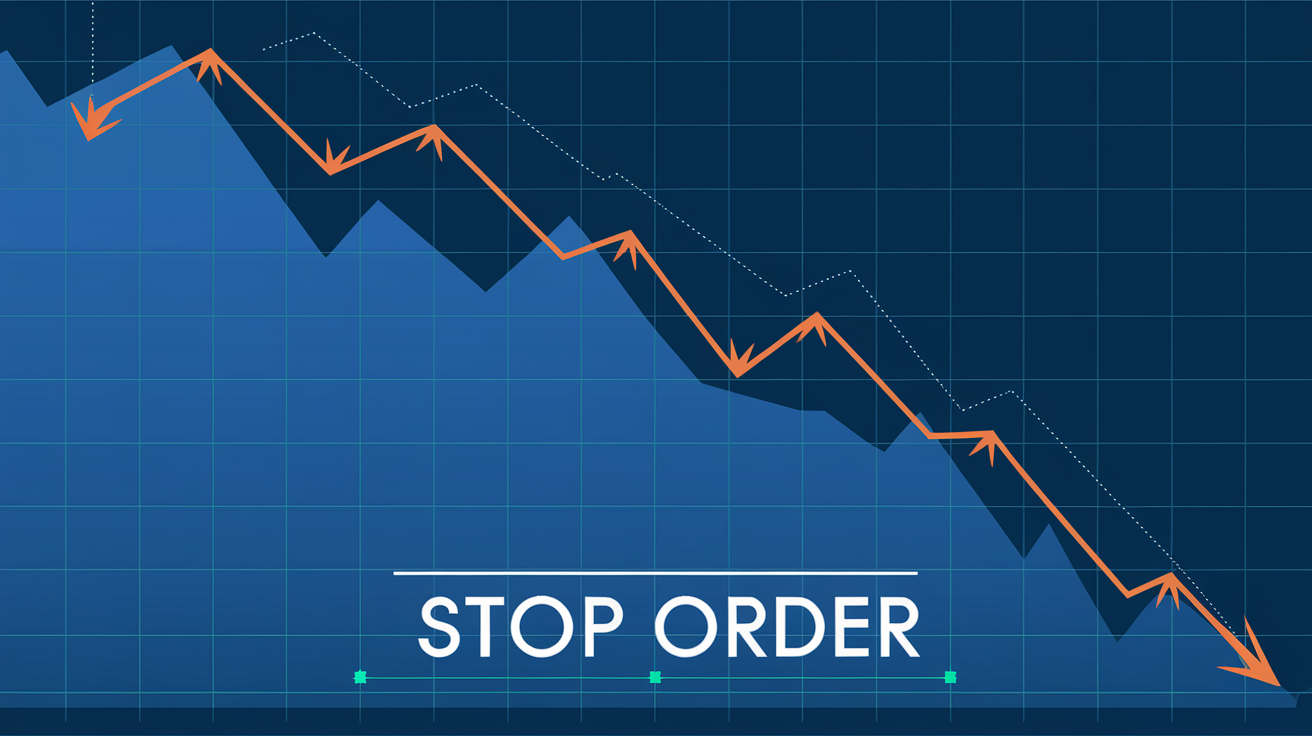
The Spring is one of the most powerful signals in Wyckoff methodology. It's a false breakdown of support in the accumulation phase. Price drops below a key level, triggers retail stop orders, and Smart Money scoop up this liquidity. Then comes a sharp reversal upward.
How to trade the Spring: wait for price to return above the broken level. Confirmation — volume increase on the reversal. Stop-loss below the Spring low. Target — the range's upper boundary or SOS level.
The Upthrust is the mirror pattern in distribution. False breakout above resistance traps buyers, then price drops sharply. Smart Money use this moment to complete their distribution.
How to distinguish false breakouts from real ones: true breakouts come with sustained volume increase and price holding beyond the level. False breakouts — quick return with characteristic volume profile: spike on breakout, decline on reversal.
Volume as Confirmation
Wyckoff's central principle: volume confirms price. Movement without corresponding volume is weak and unreliable. Movement with high volume is significant.
Rising price on rising volume — healthy uptrend. Rising price on declining volume — trend exhausting, possible reversal. Falling price on high volume — strong seller pressure. Falling price on low volume — likely correction, not trend change.
In accumulation, look for volume spikes on lows — that's Smart Money buying. In distribution — spikes on highs without continued rally — that's institutional selling.
Practical Application
Start by identifying the current market phase on a higher timeframe. The daily chart shows the big picture: are we in accumulation, markup, distribution, or markdown? Then move to lower timeframes for entry points.
In accumulation, look for Spring and LPS for long entries. In distribution — Upthrust for short positions. During trends — pullbacks to support levels (former resistance) for adding to positions.
Combine Wyckoff with Volume Profile to identify zones of maximum volume. POC (Point of Control) often coincides with key Wyckoff structure levels, strengthening their significance.
Modern Tools for Wyckoff Analysis
Volume Profile shows horizontal volume distribution across price levels. POC often aligns with accumulation and distribution range boundaries. Value Area — the zone containing 70% of volume — defines fair value in participants' eyes.
Footprint Charts detail volume within each candle. You see where aggressive buying and selling occurred, helping identify SC, AR, Spring and Upthrust points with greater precision. To understand this topic more deeply, I recommend studying volume analysis.
Delta Volume shows the difference between buying and selling. Positive delta on accumulation lows — confirmation of Smart Money buying. Negative delta on distribution highs — signal of institutional selling.
Common Mistakes
First mistake — seeking perfect patterns. Real markets rarely draw textbook diagrams. Phases can be stretched or compressed, SC and AR points unclear. Understanding the logic matters more than finding exact pattern matches.
Second mistake — trading without confirmation. Spring without subsequent volume increase and price holding above level isn't a buy signal. Wait for confirmation: price return, volume increase, impulse move in trade direction. To consolidate this material, also study market auction.
The Wyckoff Method is a framework for understanding market structure. Master it, and you'll start seeing markets differently — not as chaos, but as a logical sequence of institutional actions.
Frequently Asked Questions
An approach to analysis through supply and demand, volume and institutional behavior.
False breakdown below support with quick upward reversal. Smart Money collects liquidity.
False breakout above resistance with downward reversal. Large players complete distribution.
Sideways after decline, volume spikes on lows, Spring, then resistance breakout on volume.
Market psychology hasn't changed. Large players still manipulate liquidity.
About the Author
Author: Igor Arapov — independent researcher in trading psychology and behavioral finance, practising trader since 2013, founder of arapov.trade, author of a trading book series (Open Library ), (ORCID: 0009-0003-0430-778X ).