Market Phases in Trading: How to Identify Current Cycle Stages
Financial markets operate according to predictable patterns that experienced traders have learned to recognize and exploit for profitable trading. At the core of this understanding lies the concept of market phases — recurring stages in price development that repeat across every financial instrument regardless of timeframe. Mastering the ability to identify the current phase transforms a trader from reactive to proactive, enabling strategic positioning before major moves occur. To understand this topic more deeply, I recommend studying Wyckoff analysis.
The foundation of market cycles stems from the eternal interplay between supply and demand. Large institutional participants — investment funds, banks, and market makers — drive the primary direction of price movement. Retail traders typically join movements at later stages, providing the final push that completes each cycle. This interaction creates identifiable patterns that can be studied, recognized, and traded systematically.
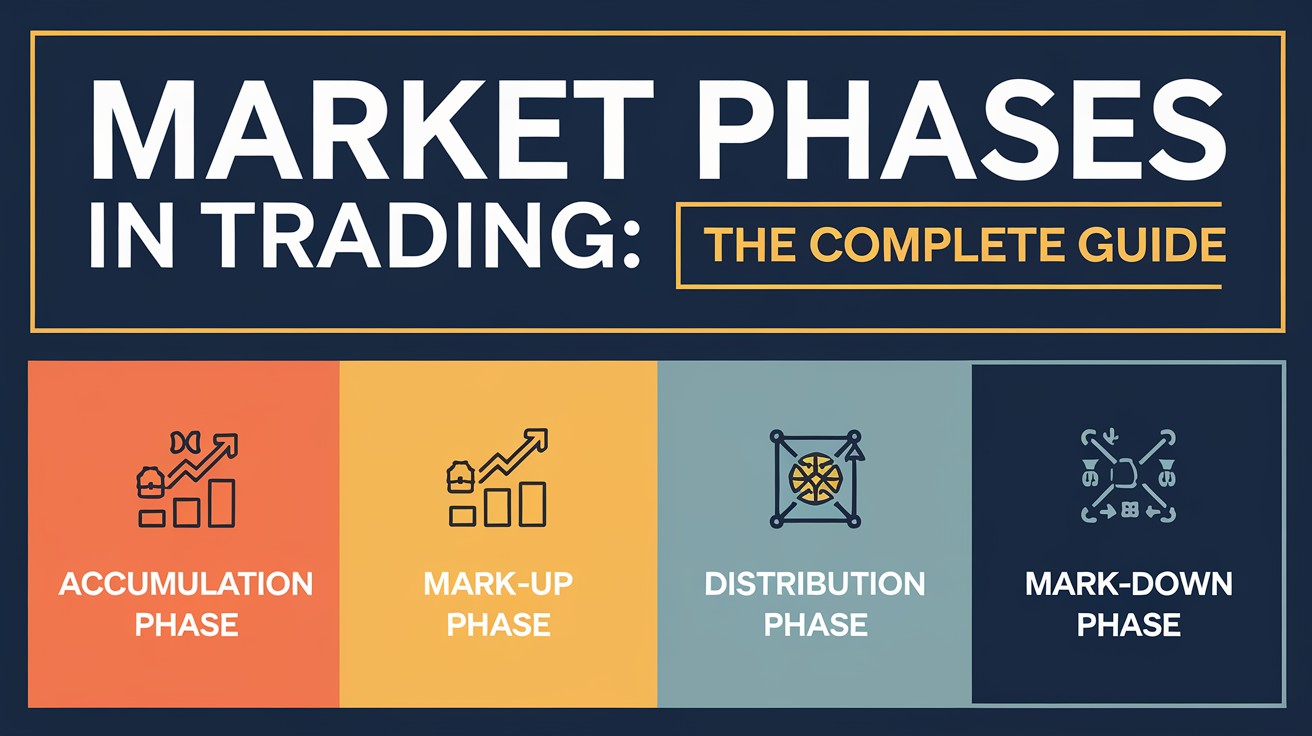
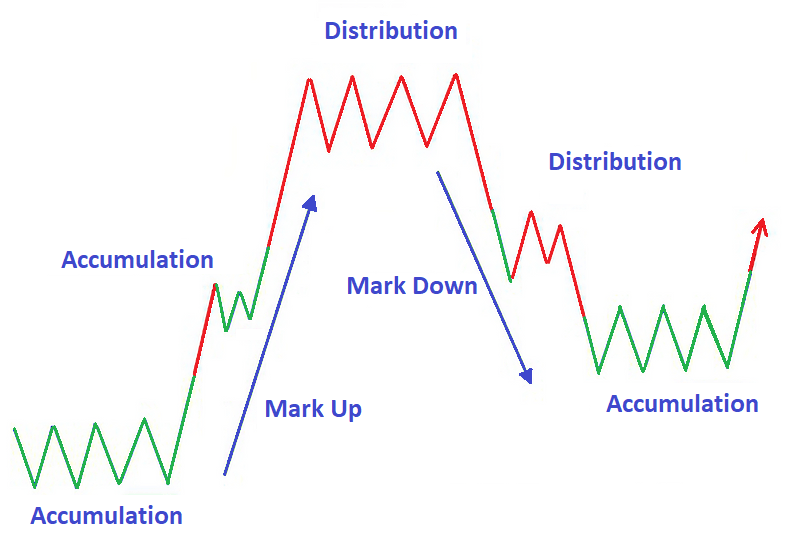
The classical market cycle model identifies four distinct phases: accumulation, uptrend, distribution, and downtrend. Each phase exhibits characteristic features, specific participant psychology, and optimal trading strategies. Understanding this structure transforms what appears to be chaotic price action into a readable map of market opportunities and risks.
Accumulation Phase: Building the Foundation for Growth
The accumulation phase emerges following an extended price decline when an asset reaches levels where institutional players consider it undervalued. Externally, the market appears lifeless: volatility is minimal, trading volumes are low, and media sentiment remains negative. Yet this quiet period conceals the most significant process — the systematic transfer of assets from weak hands to strong ones. Recognizing this paradox provides the key to positioning successfully at the beginning of new bullish cycles. Read more about this in the article: Anatomy of a Trend.
Institutional investors during accumulation operate with maximum discretion. Their objective is to build substantial positions without alerting the broader market. Algorithmic trading systems break large orders into smaller pieces. Dark pools provide anonymous liquidity. Accumulation often extends over weeks or months as patient capital understands that disciplined work during this phase determines future profits.
Retail traders during accumulation typically maintain pessimistic outlooks. Memories of recent losses remain fresh, technical indicators fail to provide clear buy signals, and news flow stays predominantly negative. Many continue selling or remain on the sidelines, creating ideal conditions for institutional accumulation at favorable prices. The disconnect between smart money activity and public sentiment defines this phase.
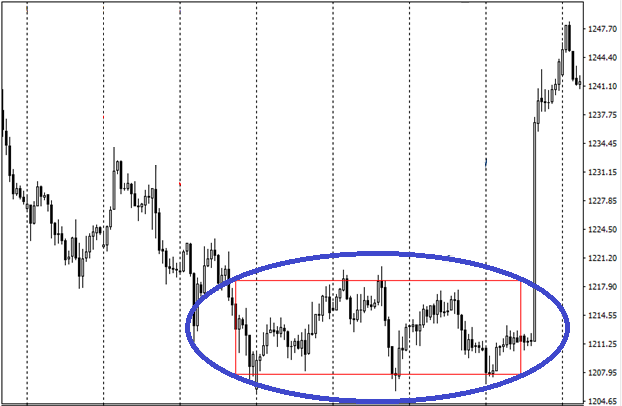
Technical characteristics of accumulation include horizontal price movement within a defined range. Support levels get tested repeatedly but hold, indicating buyer presence. Trading volumes on upward moves begin exceeding volumes on pullbacks. RSI and MACD indicators form bullish divergences , warning of potential reversal. Bollinger Bands contract, signaling compressed volatility that typically precedes significant moves.
Trading strategy during accumulation centers on patience and preparation. The optimal approach involves monitoring base formation and preparing for entry upon breakout above range resistance. Confirmation requires volume expansion and price closing above resistance. Early entries within the range carry higher risk but offer better reward potential for traders who can identify accumulation patterns accurately.
Uptrend Phase: Bullish Movement Development
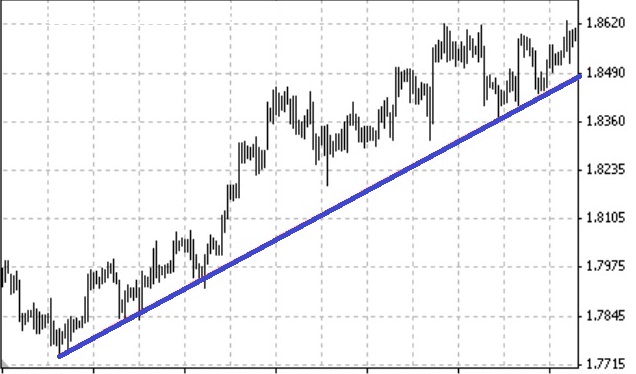
The uptrend phase begins when accumulated demand overcomes supply resistance and drives price upward from consolidation. This represents the most favorable period for trend-following traders as the market demonstrates sustained directional movement with regular higher highs. The bulk of successful trading profits typically originate from capturing portions of these trending moves.
The mechanics of uptrend formation involve interconnected processes. Resistance breakouts trigger stop orders on short positions, amplifying upward momentum. Positive news and improving fundamentals attract new buyers. Technical signals confirm bullish sentiment, encouraging more participants to join the move. This self-reinforcing cycle continues until buying pressure eventually exhausts.
Structurally, uptrends exhibit sequences of higher lows and higher highs. Each pullback finds support above the previous low, while each impulse exceeds the prior peak. Moving averages align in bullish order — short-term above long-term — serving as dynamic support levels. Price consistently respects these averages during healthy trends.
Uptrend trading relies on trend-following principles. Effective strategies include buying pullbacks to support levels or moving averages, entering breakouts of local highs, and employing trailing stops to protect profits. The ADX indicator helps assess trend strength: readings above 25 indicate sustained directional movement worth trading.
Common mistakes during uptrends relate to emotional reactions. Some traders succumb to euphoria and increase position sizes beyond reasonable limits. Others attempt to predict tops and initiate premature short positions against prevailing momentum. Professional approaches emphasize following trends until clear exhaustion signals emerge rather than anticipating reversals. I also recommend studying market auction for the full picture.
Distribution Phase: Preparing for Reversal
The distribution phase signals the completion of bullish movement and market preparation for reversal. During this stage, large players begin taking profits, gradually transferring positions to late buyers. Distribution mirrors accumulation but occurs at cycle peaks rather than troughs. Understanding distribution dynamics helps traders protect gains and prepare for potential downside.
Participant psychology during distribution reaches peak optimism. Financial media publishes positive forecasts, analysts raise price targets, and retail investors pour into the market en masse. Precisely at this moment, experienced traders recognize danger and begin reducing exposure. The divergence between public enthusiasm and smart money positioning creates warning signals.
Technical signs of distribution include slowing growth and range formation at elevated levels. Price stops making new highs despite continued positive news flow. Trading volumes increase on downward moves and decrease during rally attempts. Oscillators form bearish divergences, indicating weakening bullish momentum beneath surface strength.
Distribution trading requires heightened caution. Prudent strategy involves gradual profit-taking on long positions, tightening stop orders, and refraining from new purchases. Aggressive traders may seek short position opportunities upon breakdown of range support with volume confirmation. Risk management becomes paramount as potential reversals approach.
Downtrend Phase: Bear Market Dynamics
The downtrend phase represents the period of seller dominance and sustained price decline. This process triggers upon breakdown of key support levels, after which markets enter capitulation mode. Panic selling, margin calls, and stop-order execution create cascade effects that accelerate declines beyond what fundamentals might justify.
Downtrend structure exhibits sequences of lower highs and lower lows. Each bounce meets resistance below the previous peak, while each selling wave pushes price to new lows. Moving averages align in bearish order, acting as dynamic resistance levels. Rallies that fail at moving averages confirm trend continuation.
Participant psychology during decline progresses through classical stages: denial, anger, bargaining, depression, and acceptance. Initially, many view drops as buying opportunities at discount prices. As declines deepen, optimism transforms into fear and panic. Final stages bring apathy and complete loss of interest in the asset, often marking cycle bottoms.
Downtrend trading opens opportunities for short selling. Effective strategies include selling rallies to resistance levels, entering breakdowns of local lows, and using protective stops above previous highs. Bear markets exhibit heightened volatility and sharp counter-trend moves, requiring adjusted position sizing and risk parameters.
How to Identify Current Market Phase
Determining current market phase requires comprehensive analysis combining price action, volume patterns, and technical indicators. No single indicator perfectly identifies phase transitions. Professional traders use multiple signal confirmation to form complete pictures of market conditions before committing capital.
Volume analysis plays a crucial role in phase identification. During accumulation, volumes increase on upward moves and decrease on pullbacks. Distribution shows the opposite pattern: high volumes accompany declines while rallies occur on reduced activity. Volume Profile tools help identify zones of greatest participant interest, revealing where significant accumulation or distribution occurred. To consolidate this material, also study the Smart Money concept.
Trend and momentum indicators complement volume analysis. Moving averages determine overall market direction. MACD signals momentum strength and direction. RSI identifies overbought and oversold conditions. Divergences between price and indicators serve as leading signals of potential reversals, often appearing before price confirmation.
Practical Trading Recommendations
Successful trading across market phases requires adaptive approaches to position and risk management. Trending phases warrant larger positions with wider stops that allow participation in extended moves. Transitional consolidation phases call for reduced position sizes and tighter stops near entry points. Matching strategy to phase improves overall trading performance.
Risk management remains the foundation of profitable trading regardless of current phase. Limiting per-trade risk to one or two percent of capital protects against catastrophic losses during inevitable wrong calls. Diversification across instruments and timeframes reduces dependency on any single forecast or market condition.
Practical application of market phase knowledge begins with regular multi-timeframe chart analysis. Higher timeframes identify dominant cycle phases while lower timeframes help find optimal entry points. Multi-timeframe alignment increases trading decision accuracy.
Understanding market phases transforms trader approaches to technical analysis . Instead of attempting to predict random price fluctuations, opportunities emerge to act in harmony with natural market rhythms. Phase recognition determines strategy selection, trade direction, and risk management parameters.
Frequently Asked Questions
There are four main market cycle phases: accumulation phase (consolidation after decline), uptrend phase (growth period), distribution phase (consolidation at top), and downtrend phase (decline period). These phases cyclically alternate in sequence.
The accumulation phase is characterized by horizontal price movement within a narrow range following a prolonged decline. Signs include: low volatility, repeated testing of support level without breaking it, increasing volumes on upward moves, bullish divergences on RSI and MACD.
Market phase identification uses: moving averages (trend direction), RSI and MACD (divergences and momentum), Bollinger Bands (volatility), ADX (trend strength), Volume Profile (volume distribution). Combining multiple indicators improves accuracy.
Accumulation occurs at lows after decline — large players buy assets. Distribution occurs at highs after growth — large players sell assets. In accumulation, volumes increase on price rises; in distribution — on price falls.
In accumulation: prepare to buy upon resistance breakout. In uptrend: buy pullbacks, use trailing stops. In distribution: take profits, tighten stops. In downtrend: use short positions. Risk management is essential in all phases.
About the Author
Author: Igor Arapov — independent researcher in trading psychology and behavioral finance, practising trader since 2013, founder of arapov.trade, author of a trading book series (Open Library ), (ORCID: 0009-0003-0430-778X ).