Every trader seeks moments when markets prepare for directional changes. Divergence stands among the most reliable technical analysis tools for identifying these turning points. The phenomenon involves a discrepancy between price behavior and indicator readings, revealing trend weakness before it becomes apparent on price charts alone.
Consider a common scenario: an asset continues making higher highs, projecting strength in the upward movement. Meanwhile, the oscillator forms progressively lower peaks. This discrepancy reveals buyers losing control while the upward push occurs against declining momentum. Understanding these signals provides traders significant advantage over participants focused solely on price action.
How Divergence Forms
Oscillators and momentum indicators measure the speed of price change rather than absolute price levels. During strong trends, price and indicator move in harmony. Problems emerge when trends exhaust themselves: price continues its previous direction through inertia while the indicator already registers deceleration. This mismatch constitutes divergence.
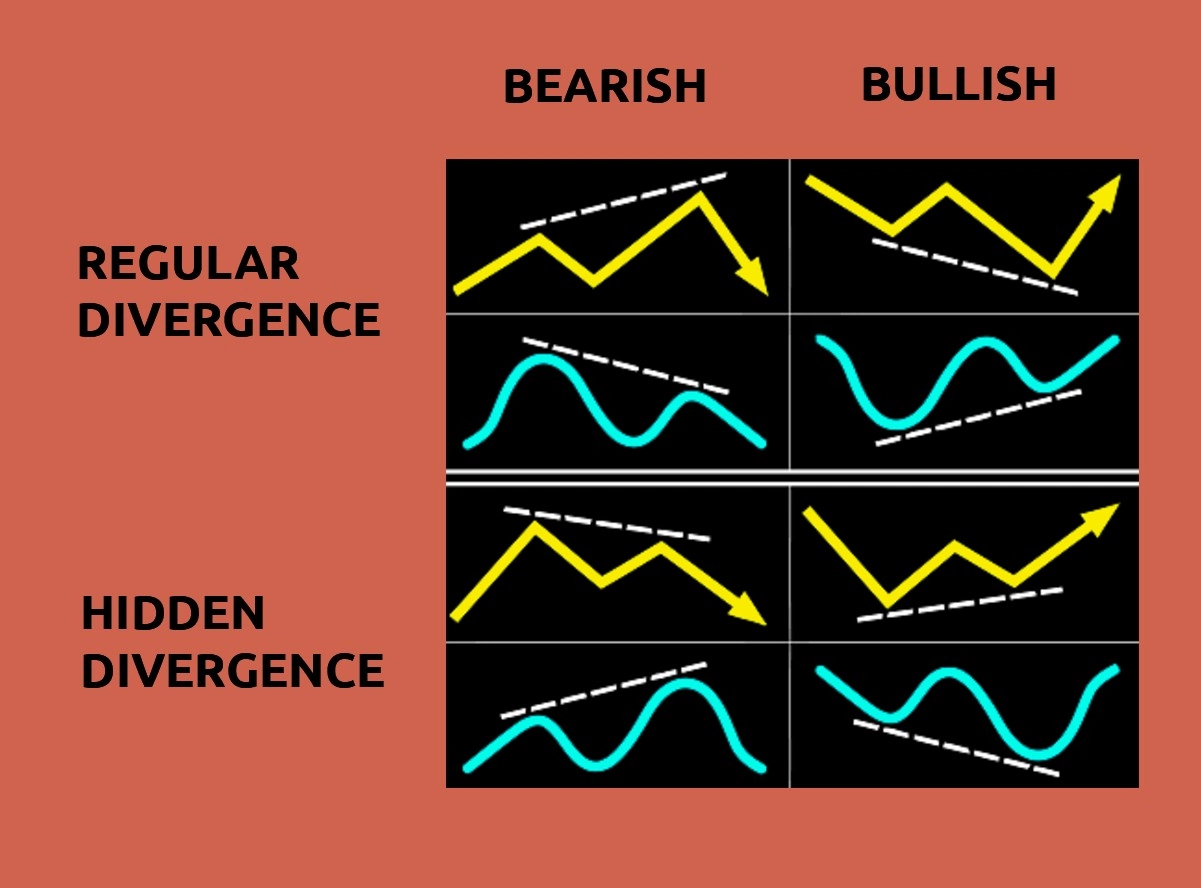
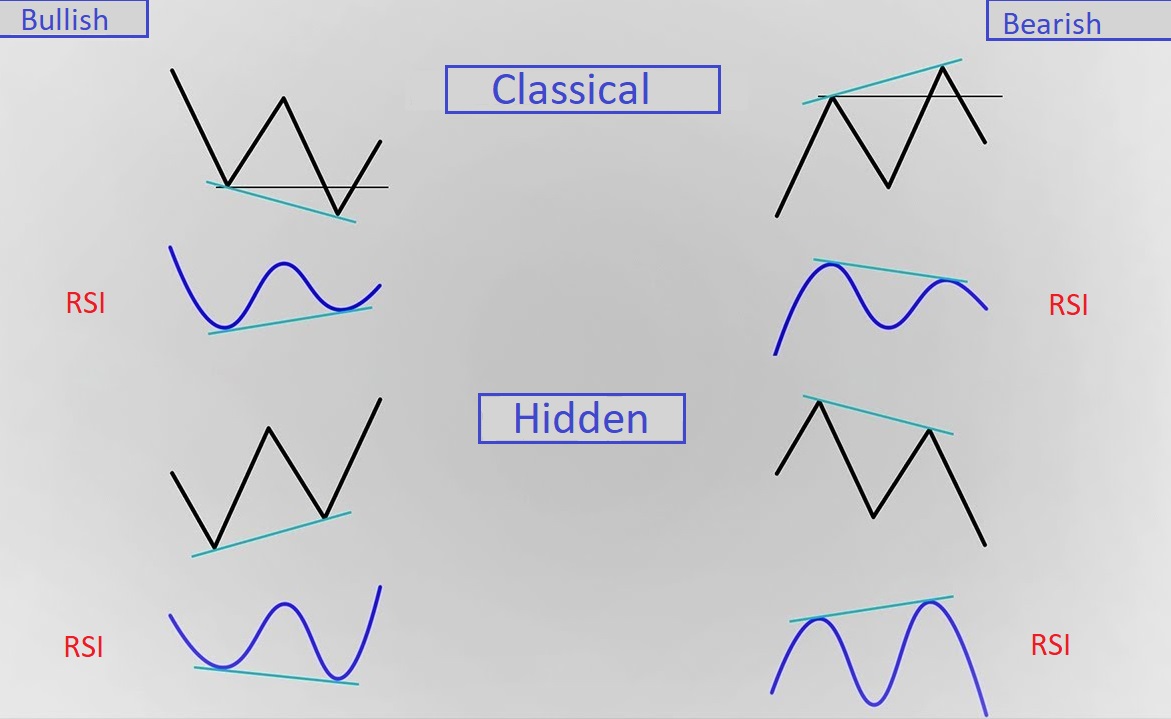
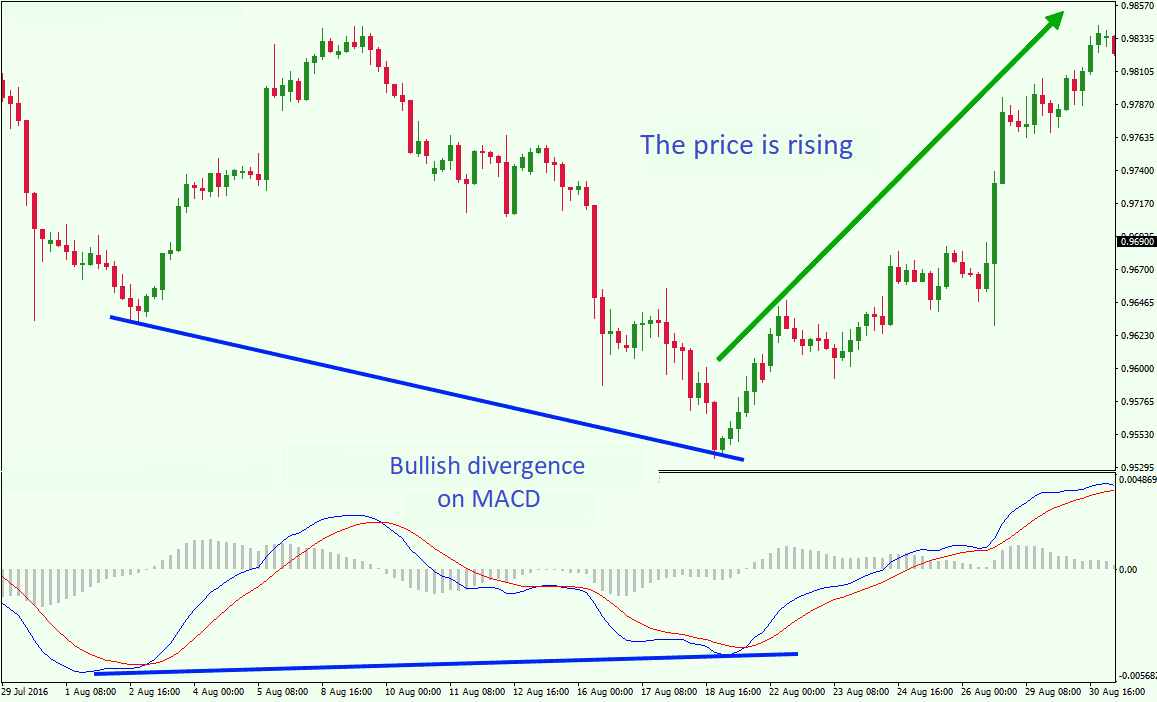
Bullish divergence appears during downtrends when price establishes a new low while the indicator forms a higher low compared to its previous reading. This configuration signals weakening seller pressure and potential upward reversal. Experienced traders view this pattern as grounds for seeking long entry opportunities.
Bearish divergence develops under opposite conditions. During upward movement, price reaches a new high while the indicator prints a lower peak. Despite the appearance of continued growth, buyers are exhausting their strength. Professional market participants utilize these signals for profit-taking on long positions or initiating short trades.
Divergence Classification
Beyond classic bullish and bearish divergence, hidden divergence operates on fundamentally different principles. While regular divergence warns of reversals, hidden divergence confirms continuation of existing trends. During uptrends, hidden bullish divergence emerges when price forms a higher low during correction while the indicator shows a lower low. This indicates bulls retain strength and growth will likely resume following the pullback.
Extended divergence occurs when discrepancy between price and indicator persists across multiple price waves. Such configuration suggests gradual accumulation of contradictions within market structure and often precedes significant price movements. Seasoned traders pay particular attention to extended divergences due to their predictive value.
Indicators for Divergence Detection
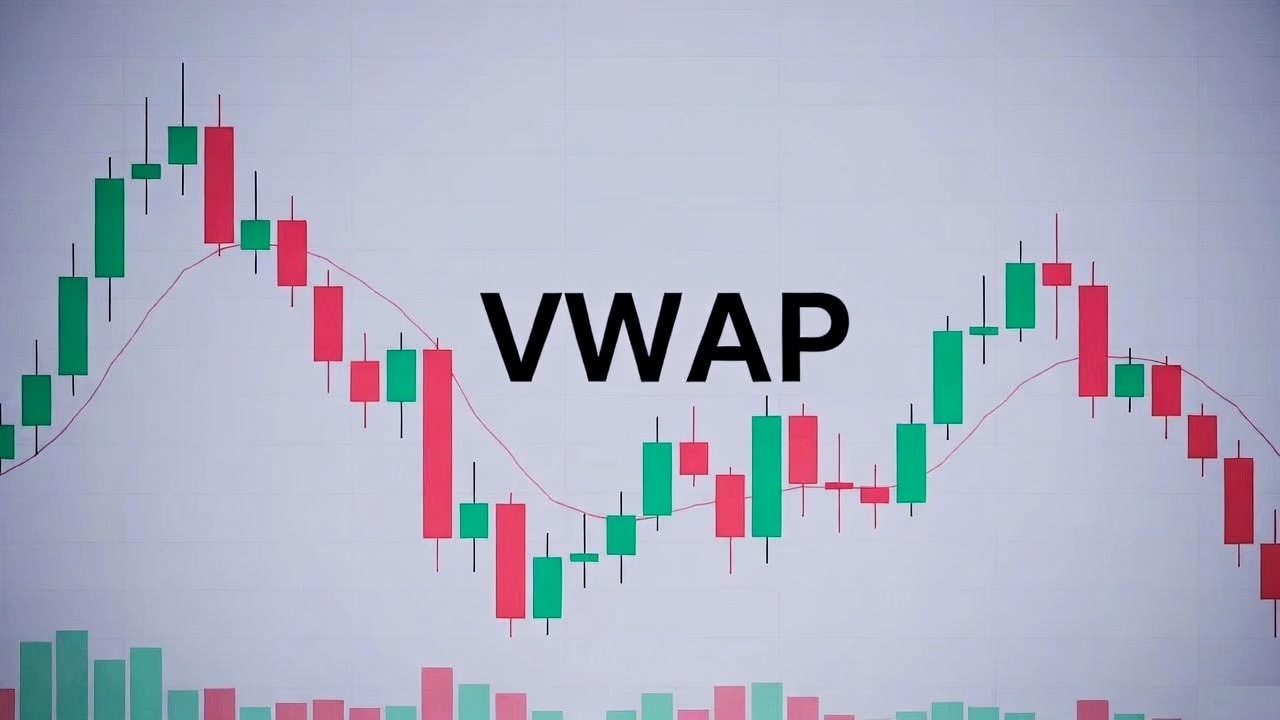
RSI holds the leading position among divergence analysis tools due to signal clarity and visual appeal. The Relative Strength Index oscillates between zero and one hundred, with readings above seventy indicating overbought conditions and below thirty suggesting oversold territory. Divergence on RSI within extreme zones carries enhanced reliability since markets already occupy states conducive to reversal.
The MACD indicator provides additional information through its histogram, reflecting distance between the MACD line and signal line. Histogram divergence proves particularly valuable for medium and long-term trend analysis. When histogram bars contract while price movement continues, this signals gradual momentum loss.
Stochastic Oscillator delivers best results in ranging market conditions. Its readings within overbought and oversold zones combined with divergence create powerful trading signals. However, during strong trends, stochastic may remain in extreme zones for extended periods, generating false reversal signals.
Practical Trading Application
Discovering divergence represents merely the first step in the trading process. The next critical stage involves finding confirmation factors. Divergence forming near significant support or resistance levels carries substantially greater potential. Fibonacci retracements, psychological round numbers, and previous extremes all reinforce divergence signals.
Candlestick analysis provides additional confirmation. Appearance of reversal patterns such as hammer, hanging man, engulfing, or doji at divergence points significantly increases trade success probability. Trading volume also plays an important role: increased activity during reversal candle formation confirms serious intent from market participants.
Risk Management in Divergence Trading
Protective stop-loss placement requires careful attention. With bullish divergence, stops go below the most recent price low; with bearish divergence, above the latest high. This approach provides logical stop justification: triggering indicates the anticipated reversal failed and the current trend continues with renewed strength.
Reward-to-risk ratio should reach minimum two to one. Lower values make trading systems vulnerable to inevitable losing trades. Professional traders frequently employ three-to-one ratios or higher, allowing profitability even with relatively modest win rates.
Method Limitations
Divergence does not provide universal solutions for all trading challenges. During powerful directional moves, divergence signals may appear repeatedly without leading to reversal. Cryptocurrency markets demonstrate this vividly: during strong bullish rallies, bearish divergences form again and again while price ignores technical signals.
The time factor significantly affects signal reliability. On minute and five-minute charts, divergence suffers from market noise influence and often proves false. Transitioning to hourly and daily timeframes substantially improves signal quality while reducing their frequency. Each trader determines optimal balance based on individual trading style.
Trading Psychology
The emotional component plays a critical role in divergence trading success. Impatience drives premature market entry without waiting for confirmation. Fear of missing profits pushes toward excessive position sizing. Desire to recover losses leads to ignoring risk management rules.
Maintaining a trading journal helps identify recurring errors and systematize successful patterns. Recording each trade with divergence type, indicator, timeframe, and outcome provides objective assessment of trading performance. Analyzing this data enables strategy optimization and elimination of ineffective elements.
Integration with Other Analysis Methods
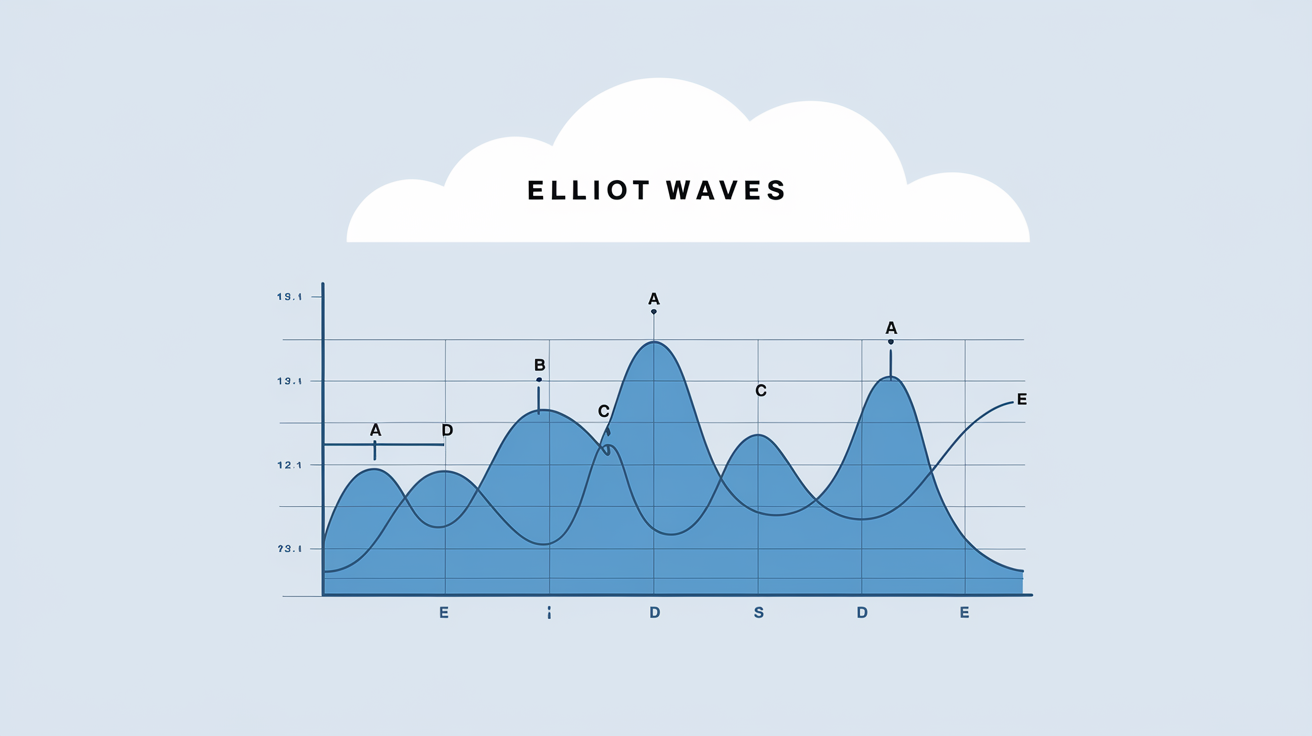
Divergence integrates naturally into comprehensive trading systems. Elliott Wave practitioners apply divergence to identify impulse wave completion. Wyckoff Method followers monitor divergence during accumulation and distribution phases. Smart Money concept adherents use price-indicator discrepancies as additional confirmation for institutional interest zones.
Combining multiple indicators for divergence confirmation requires caution. Excessive filters lead to analysis paralysis and missed opportunities. Optimal approach involves one or two indicators for divergence identification combined with level analysis and candlestick patterns.
Conclusion
Mastering divergence requires time and practice. Begin with historical chart study, marking divergence formation moments and subsequent price dynamics. Demo account testing allows skill development in identification and trading without risking real capital. Gradual complexity increase from simple RSI signals to comprehensive analysis with multiple confirmation factors ensures steady progress.
Divergence remains among the most valuable tools in the technical analyst arsenal. Its ability to reveal hidden trend weaknesses before price manifestation provides informed traders significant advantage. When properly applied alongside disciplined risk management, this method substantially improves trading results across all financial markets.
Frequently Asked Questions
Divergence is a discrepancy between asset price direction and technical indicator readings, signaling trend weakening and potential reversal.
The most effective indicators include RSI, MACD, and Stochastic Oscillator. RSI excels particularly in identifying overbought and oversold zones.
Regular divergence signals potential trend reversal while hidden divergence confirms trend continuation.
False signals occur during strong trends, on lower timeframes, and during major economic news releases.
Confirmation requires convergence of factors: formation near key levels, appearance of reversal candlestick patterns, and increased trading volume.
About the Author
Author: Igor Arapov — independent researcher in trading psychology and behavioral finance, practising trader since 2013, founder of arapov.trade, author of a trading book series (Open Library ), (ORCID: 0009-0003-0430-778X ).