Price Patterns in Technical Analysis: Comprehensive Guide
Price patterns represent visual formations on charts that reflect the battle between buyers and sellers. These patterns have formed throughout a century of market history and continue working today because human psychology remains unchanged. Before continuing, familiarize yourself with the basics of technical analysis . Fear, greed, hope, and despair of millions of traders create recurring graphical structures that savvy market participants can exploit for profit.
Chart patterns transform the chaos of market fluctuations into understandable signals. They help traders structure information, identify regularities, and make informed decisions. When used correctly, price patterns become powerful forecasting tools, although they never guarantee one hundred percent accuracy. Understanding their limitations is as important as recognizing their strengths.
Classification of Price Patterns
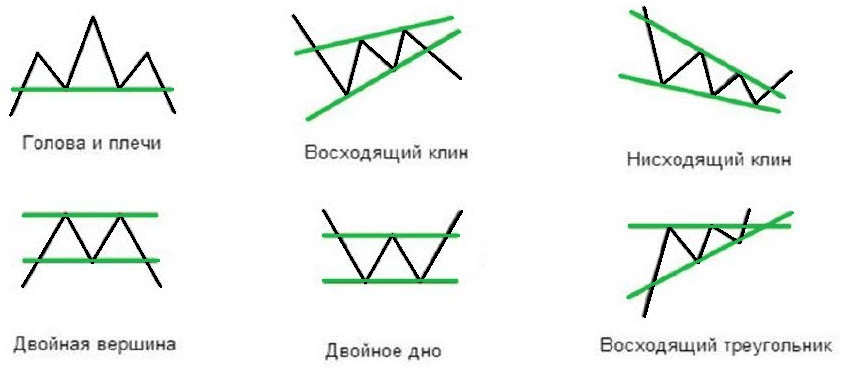
All chart patterns divide into two fundamental categories. Reversal patterns signal exhaustion of the current trend and probable direction change. They form at extremes — uptrend peaks or downtrend bottoms. Classic examples include head and shoulders, double top, and wedge formations that traders have relied upon for generations.
Continuation patterns indicate a temporary trend pause — consolidation after which price continues moving in the previous direction. These patterns represent market participant rest before a new impulse. They include flags, pennants, and various triangle types that provide excellent entry opportunities. This topic is directly related to the cup and handle pattern.
Understanding the nature of each category is critically important for correct interpretation. Reversal patterns are sought at trend endings, continuation patterns within sustained movements. Classification errors lead to opposite trading decisions and losses that could have been avoided with proper pattern identification.
Trend Continuation Patterns
The flag forms after a strong impulsive movement and represents a brief correction in the form of a sloped channel. The flagpole is the preceding impulse, the body is the corrective channel directed against the main trend. Flag boundary breakout in the trend direction activates the pattern and provides an excellent entry point.
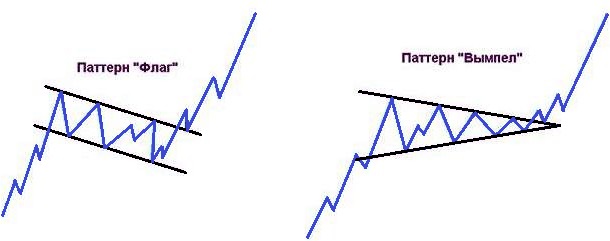
The pennant resembles the flag but instead of a parallel channel forms a narrowing triangle . Converging support and resistance lines indicate volatility compression before an explosive movement. Pennants typically form faster than flags and precede sharp trend continuation with significant profit potential.
Triangles come in three types. Symmetrical triangles form from converging trend lines and don't indicate the future breakout direction — the market decides. Ascending triangles have horizontal resistance and rising support — a bullish signal. Descending triangles feature horizontal support and falling resistance — a bearish signal.
Trend Reversal Patterns
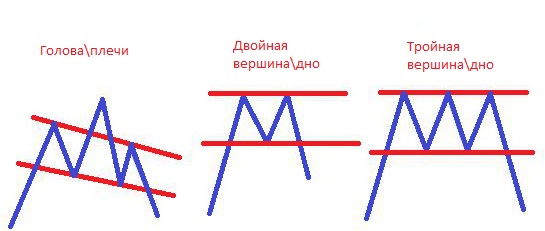
Head and shoulders is a classic reversal pattern forming at uptrend peaks. Three sequential peaks create the characteristic silhouette: left shoulder, head (the central and highest peak), and right shoulder. The neckline connects the lows between peaks and serves as the key level for entry.
Breakout below the neckline confirms the reversal and opens downside potential equal to the head height measured from the neckline. Inverted head and shoulders forms at downtrend bottoms and signals upward reversal. Volume plays a crucial role: right shoulder volume is typically lower than left shoulder — a sign of buyer exhaustion.
Double top and double bottom are failed breakout patterns. Double top forms when price tests the resistance level twice and retreats, creating an M-shaped figure. Intermediate low breakout activates the bearish signal. Double bottom is the mirror reflection: two support tests create a W-shaped formation with bullish potential.
Psychology Behind Pattern Formation
Each price pattern reflects a specific psychological process in the market. Head and shoulders demonstrates three-phase buyer exhaustion: enthusiasm at the left shoulder, euphoria at the head, and capitulation at the right shoulder. Each subsequent peak attracts fewer buyers until sellers take control and reverse the trend.
Flags and pennants reflect a pause after the impulse. Participants take profits, new players assess the situation. Volatility compression creates a spring that releases energy on breakout. Smart Money concepts explain this as position accumulation by large players before movement continuation.
Triangles symbolize uncertainty. Buyers and sellers reach equilibrium, the range narrows. Energy accumulates to a critical point after which one side wins. Breakout direction is determined by the balance of forces, which often becomes clear only at the moment of triangle exit when volume confirms the move.
Volume Confirmation of Patterns
Volume analysis is critically important for assessing pattern credibility. True breakouts are accompanied by volume spikes — real demand or supply stands behind the movement. Breakouts on low volume are highly likely to prove false, with price returning inside the pattern.
In the head and shoulders pattern, volume typically decreases from left shoulder to right. This reflects waning buyer interest. Neckline breakout should be accompanied by volume increase — sellers aggressively enter the market. Volume absence on breakout is a warning signal that the pattern may fail.
In triangles, volume gradually decreases as the range narrows. This is normal — the market waits. Volume explosion on breakout confirms the movement direction. Some traders use volume indicators — OBV, A/D Line — for early identification of probable breakout direction.
Pattern Trading Rules
The first rule is to wait for complete formation. Premature entry before confirmed breakout is a common beginner mistake. The pattern may not complete or transform into a different formation. Patience improves trade quality significantly and protects capital from unnecessary losses.
The second rule is to use additional confirmation tools. Technical indicators RSI, MACD, Fibonacci levels , and candlestick patterns strengthen pattern signals. Multiple factor alignment increases successful trade probability.
The third rule is strict risk management. Stop-loss placement beyond the opposite pattern boundary protects capital. Profit target calculation based on pattern height: head and shoulders height from neckline, triangle height, flagpole length. Risk-to-reward ratio should be at least 1:2.
False Breakouts and How to Avoid Them
False breakouts are an inevitable part of pattern trading. Price exits beyond the pattern boundary, activates trader orders, and returns. This may result from market maker manipulation hunting stop-losses, or simply insufficient movement strength to sustain the breakout.
False breakout filtering begins with volume analysis. True breakouts accompany significant trading activity increases. Another method is waiting for candle close beyond the level. If the candle closes inside the pattern, the breakout is considered unconfirmed and should be avoided.
Some traders use level retest after breakout as an entry point. Price breaks the boundary, returns to it (now support or resistance), and bounces. Retest entry reduces false breakout risk, although sometimes price leaves without returning to offer this opportunity.
Practical Recommendations
Beginning traders are recommended to focus on several basic patterns: flag, head and shoulders, double top. After mastering their identification and trading, gradually expand your arsenal. Attempting to use all patterns simultaneously leads to confusion and errors.
Regular analysis of historical charts develops pattern recognition skills. Study how patterns formed and worked out in the past. Pay attention to context: what was the trend, what volumes accompanied the breakout, did price reach the calculated target. Scalpers use shorter timeframes while swing traders focus on daily charts.
Keeping a trading journal allows analyzing personal statistics. Psychological stability and risk management discipline transform pattern knowledge into a profitable system that generates consistent returns over time.
Frequently Asked Questions
Price patterns are recurring chart formations that reflect market participant psychology. They help forecast the probable direction of price movement after the pattern completes formation.
Price patterns divide into two main categories: reversal patterns (head and shoulders, double top, double bottom, wedge) and continuation patterns (flag, pennant, triangle). Each type signals different market scenarios.
Pattern reliability increases with volume confirmation: a breakout on high volume is more credible. It's also important to wait for complete pattern formation and use additional tools — indicators, support and resistance levels.
Price patterns work on all timeframes — from minute to monthly. However, patterns on higher timeframes (daily, weekly) are considered more reliable and generate more significant signals.
Patterns may fail due to external factors: unexpected news, large player manipulation, low liquidity. Subjective errors in pattern identification are also possible. Therefore, using stop-losses and managing risks is essential.
About the Author
Author: Igor Arapov — independent researcher in trading psychology and behavioral finance, practising trader since 2013, founder of arapov.trade, author of a trading book series (Open Library ), (ORCID: 0009-0003-0430-778X ).