Market Trend Anatomy: Complete Trader's Guide
Understanding Market Trends
Financial markets move in cycles, alternating between directional movements and consolidation periods. A trend represents the dominant direction of price action resulting from imbalances between buyers and sellers. The ability to recognize trending conditions and their characteristics forms the foundation of technical analysis. To understand this topic more deeply, I recommend studying trend volume analysis.
Trend formation operates on fundamental supply and demand principles. When market participants willingly pay progressively higher prices for an asset, an upward tendency develops. Seller dominance creates downward pressure on quotations, initiating bearish movements. These dynamics occur across all timeframes, from minute charts to monthly intervals.
Institutional participants, including investment banks, hedge funds, and market makers, play decisive roles in trend creation through substantial capital deployment. Retail traders and algorithmic systems amplify established movements. Macroeconomic releases, central bank decisions, and geopolitical events serve as catalysts for emerging tendencies.
Classification of Market Trends
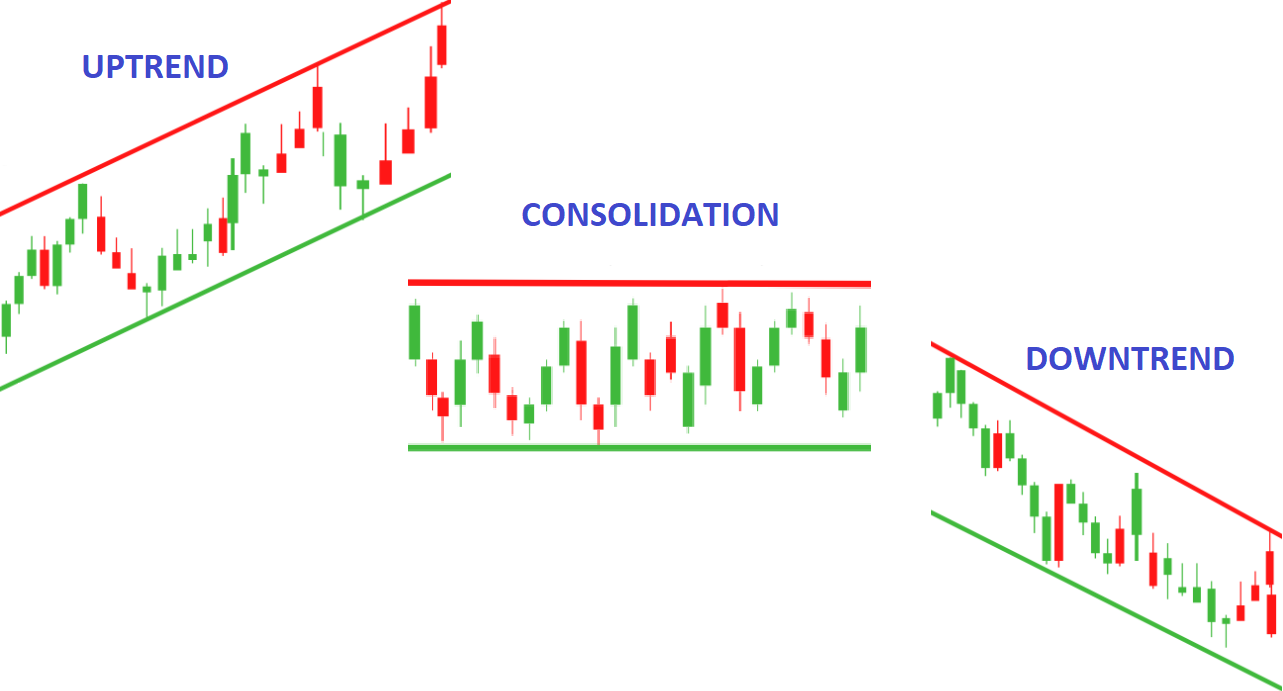
Uptrend: Bull Market Dynamics
An uptrend features sequential formation of higher lows and higher highs. Buyers dominate market activity, accumulating positions and pushing prices upward. The support line drawn through local lows serves as a reference for identifying entry opportunities during pullbacks.
Bullish movement confirmation comes from price positioning above moving averages MA50 and MA200, RSI readings above 50, and MACD crossing the zero line from below. Effective strategy involves buying on retracements to support or Fibonacci levels between 38.2% and 61.8%.
Downtrend: Bear Market Characteristics
A downtrend displays sequential decline in price extremes. Sellers control market conditions, offloading assets and pressing quotations lower. The resistance line constructed through descending highs defines zones for short position entries.
Indicators confirm bearish scenarios when RSI falls below 50, price trades beneath moving averages, and MACD crosses the zero line from above. Traders initiate short positions on bounces from resistance or upon breakdowns of support levels .
Sideways Movement: Market Consolidation
A ranging market represents periods of directional uncertainty where price oscillates horizontally between support and resistance boundaries. Such conditions often precede powerful impulsive movements in either direction as market participants await catalysts.
Oscillators prove effective in sideways conditions: Stochastic identifies overbought and oversold zones, while Bollinger Bands delineate range boundaries. Trading strategy involves buying near lower boundaries and selling near upper ones with mandatory breakout monitoring. Read more about this in the article: Elliott Waves.
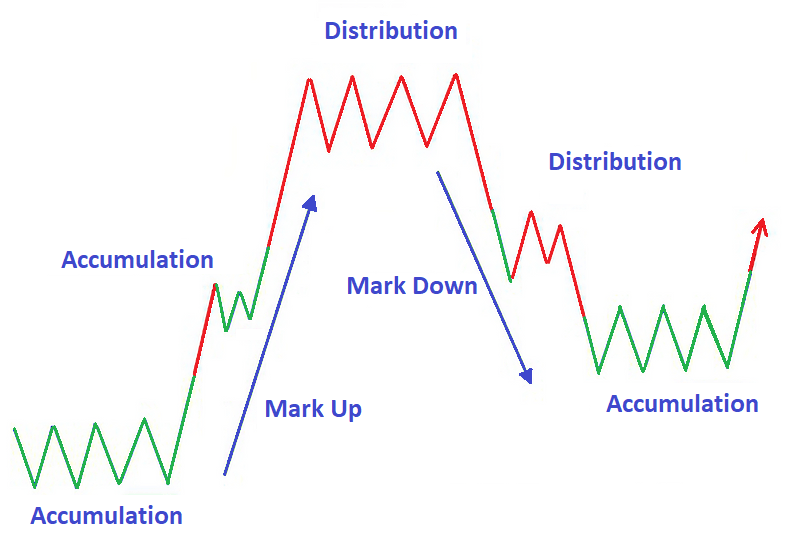
Trend Development Stages
Accumulation: The Hidden Beginning
The accumulation phase features inconspicuous position building by institutional participants. Externally, markets appear dormant with low volatility and no clear direction, yet volumes gradually increase without significant price changes. Reversal candlestick patterns like doji, pin bar, and hammer signal this stage's completion.
Markup: Momentum Development
Following accumulation, price begins moving decisively in the direction of established positions. Volumes surge sharply, key resistance or support levels break. Retail traders join the movement during this phase, amplifying momentum and establishing trending dynamics that can persist for extended periods.
Distribution: Profit Taking
The distribution phase occurs when major participants begin gradually closing positions. Momentum weakens, volumes decline, and reversal patterns emerge, including head and shoulders and double tops. False breakouts appear, indicating directional uncertainty and potential trend exhaustion.
Markdown: Direction Change
Complete institutional exit from positions triggers trend reversal. Volatility spikes sharply, with key levels breaking in the opposite direction. Panic selling or frenzied buying accompanies transitions from bull to bear markets and vice versa, often catching unprepared traders off guard.
Trend Analysis Tools
Moving averages remain fundamental tools for trend identification. Simple SMA calculates average price values, while exponential EMA weights recent data more heavily. Short EMA crossing above long EMA generates buy signals; crossing below produces sell signals. MA200 determines global direction, MA50 indicates intermediate-term trends.
MACD combines trending and oscillating properties. MACD line crossing the signal line indicates potential direction changes. The histogram reflects current movement strength. Divergence between price and indicator warns of trend weakening and possible reversal ahead.
RSI measures relative movement strength on a scale from 0 to 100. Readings above 70 signal overbought conditions and probable pullback, while readings below 30 indicate oversold levels and potential bounce. RSI divergence with price serves as a leading reversal indicator.
ADX quantitatively assesses trend strength regardless of direction. Values above 25 confirm sustained trending conditions, while readings below 20 suggest ranging markets. The +DI and -DI lines determine whether buyers or sellers currently dominate market activity.
Volume analysis verifies price movement authenticity. Rising volumes during trend-direction movement confirm strength. Declining volumes during impulses warn of potential exhaustion. Anomalous volume spikes at key levels indicate major participant activity.
Common Trading Mistakes
Counter-trend trading without confirming signals remains the primary cause of losses. Trends can persist far longer than traders anticipate. Before entering against movement direction, wait for indicator divergence, key level breakouts, or ADX declining below 25.
Late entry at movement peaks leads to buying at inflated prices before corrections. Optimal entry points occur during pullbacks to moving averages or Fibonacci levels. Declining volumes during price advances warn of weakening momentum and suggest caution.
Ignoring volume analysis deprives traders of crucial information about genuine movement strength. Low volumes during advances often precede false breakouts. High volumes during corrections may signal developing reversals that could catch traders positioned incorrectly.
Trading without a stop-loss transforms losing trades into catastrophic events. Protective orders belong beyond key levels, accounting for ATR to filter market noise. Risk per trade should never exceed 1-2% of account equity regardless of conviction level.
Emotional decision-making destroys trading discipline and systematic approach. Fear of closing losing positions leads to amplified losses. Greed prevents profit-taking according to plan. Maintaining a trading journal helps analyze mistakes and refine strategy over time.
Practical Recommendations
Combining technical and fundamental analysis improves forecast accuracy. Technical tools determine entry and exit points, while fundamental factors, including macroeconomic data and central bank decisions, establish overall direction and market sentiment.
Optimal indicator sets include 2-3 tools: moving averages for trend determination, RSI or MACD for signal generation, and volumes for confirmation. Chart overload with indicators creates conflicting signals and analysis paralysis that impairs decision-making quality.
Strategy backtesting on historical data and demo accounts represents a mandatory step before live trading. Analyzing win-loss ratios, average risk, and profit metrics allows effectiveness evaluation before experiencing real losses in actual market conditions.
Regular strategy review accounts for changing market conditions. What worked in trending markets may prove ineffective during consolidation. Adaptability and continuous learning remain key qualities of successful traders navigating evolving market environments.
Diversification reduces dependence on single assets. Capital distribution across various instruments decreases adverse movement impact on overall portfolio performance. Consider correlations between assets, as highly correlated instruments move synchronously without providing genuine diversification benefits.
Psychological resilience determines ability to follow strategy under challenging conditions. Losing streaks test trader discipline and commitment to established rules. Emotional exhaustion provokes impulsive decisions and risk management violations. Taking breaks after stressful periods restores thinking clarity and trading edge.
Conclusion
Trend analysis forms the foundation of professional trading approach in financial markets. Understanding trend formation mechanisms, ability to identify current phases, and correctly interpret indicator signals are skills requiring systematic practice and continuous improvement. Markets constantly evolve with new participants and algorithms changing liquidity structures. To consolidate the material, also study market phases.
Successful trend trading builds on balance between technical mastery and emotional control. No indicator guarantees profits, but proper risk management protects capital from catastrophic losses. Disciplined adherence to proven strategy delivers results over the long term. Trading journal maintenance and regular performance analysis reveal systematic errors and optimization opportunities for sustainable improvement.
Frequently Asked Questions
A trend is a sustained directional price movement over a specific period. Uptrends feature higher highs and higher lows, while downtrends show lower highs and lower lows. Trends reflect the balance between supply and demand in the market.
Trends develop through four stages: accumulation (institutional position building), markup (active movement with retail participation), distribution (profit-taking by large players), and markdown (trend reversal).
Key trend indicators include moving averages (MA50, MA200), MACD for direction changes, RSI for momentum assessment, and ADX for trend strength measurement. Using 2-3 indicators in combination is recommended.
Trading against the trend without confirming signals increases loss risk since trends can persist far longer than expected. Wait for indicator divergence, key level breakouts, or ADX dropping below 25 before counter-trend entries.
Volume confirms trend strength: increasing volume during price movement in the trend direction validates its strength. Declining volume may signal weakening momentum. Price-volume divergence often precedes reversals.
About the Author
Author: Igor Arapov — independent researcher in trading psychology and behavioral finance, practising trader since 2013, founder of arapov.trade, author of a trading book series (Open Library ), (ORCID: 0009-0003-0430-778X ).