Elliott Wave Theory Fundamentals
Elliott Wave Theory stands as one of the most sophisticated forecasting methodologies in technical analysis , offering traders a framework to anticipate market movements based on recurring price patterns. Ralph Nelson Elliott, an American accountant, developed this analytical approach during the 1930s after extensive study of stock market behavior and identifying recurring price patterns. His groundbreaking discovery revealed that markets do not move randomly but follow identifiable wave patterns driven by collective investor psychology and sentiment shifts across global financial markets.
The practical application of Elliott Wave analysis extends across virtually every tradable market in existence today. Professional traders employ this methodology when analyzing equities on major stock exchanges, currency pairs in the global forex market, digital assets on cryptocurrency platforms, and commodities including precious metals and energy products. The technique demonstrates remarkable versatility across all timeframes from minute charts used by day traders to monthly charts favored by long-term investors. Mastering wave pattern recognition provides traders with a significant edge in timing their market entries and exits with precision.
Wave Cycle Structure
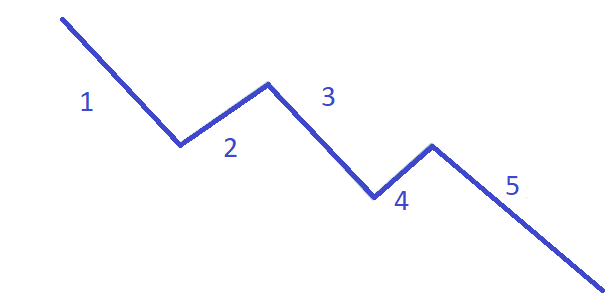
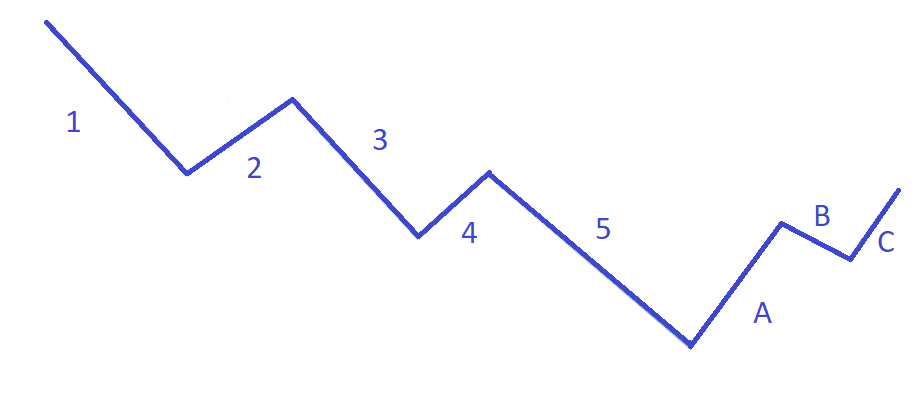
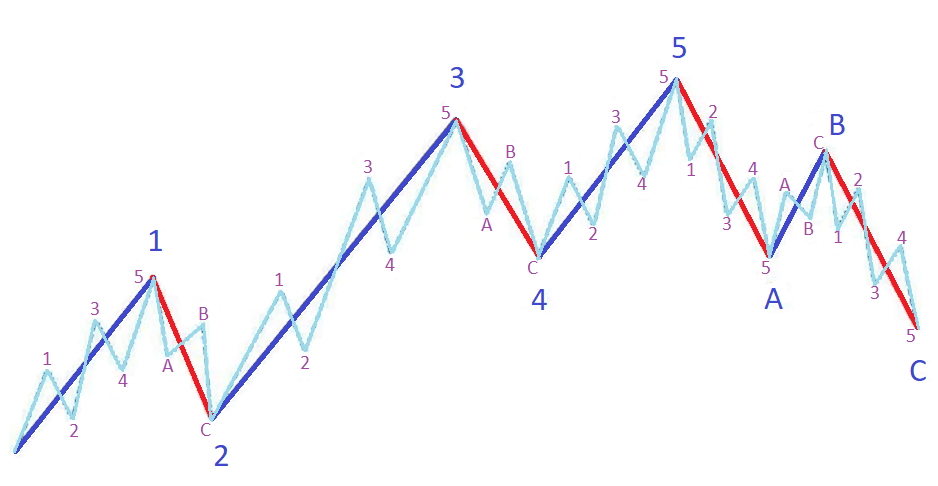
The fundamental wave cycle comprises eight distinct waves forming a complete market cycle with clearly defined phases. Five waves constitute the impulse phase moving in the direction of the dominant market trend and establishing the primary price movement. Three waves form the corrective phase moving against the main trend and representing temporary retracements before trend continuation. Impulse waves receive numerical labels from 1 through 5 while corrective waves use letter designations A, B, and C. This structure exhibits fractal characteristics where each major wave contains a complete smaller-scale wave cycle with identical internal architecture.
First Impulse Wave
The first impulse wave emerges at the beginning of a new trend following the completion of a previous correction or extended consolidation period. Most market participants fail to recognize the directional change during this initial phase and continue operating according to previous trend assumptions. Trading volume remains moderate without attracting significant attention while price movement appears tentative and uncertain. Experienced professional traders identify the first wave through characteristic breakouts above key resistance levels and observable changes in market structure patterns.
Second Corrective Wave
The second wave corrects the first wave by retracing against the new trend direction while testing its strength and sustainability. Market participants actively question the reversal with many rushing to take profits believing the movement has concluded and expecting the previous trend to resume. A fundamental inviolable rule of wave analysis states that wave two never retraces beyond the starting point of wave one under any circumstances whatsoever. Violation of this critical rule definitively indicates an error in the wave count requiring scenario revision. Correction depth typically ranges between 38.2 and 61.8 percent according to Fibonacci retracement levels. The completion of wave two creates an optimal attractive entry point for trading in the direction of the powerful third wave.
Third Wave: Key to Profitable Trading
The third wave rightfully earns recognition as the most powerful and extended wave in the impulse cycle attracting maximum market participant involvement and driving the strongest price moves. The market finally validates the new trend as legitimate while trading volume increases sharply and noticeably. Institutional investors and retail traders broadly join the active movement. The third wave never proves to be the shortest among impulse waves representing an absolutely inviolable rule of wave analysis without exceptions. Typically it reaches an impressive 161.8 or even 261.8 percent of the first wave length according to Fibonacci extensions. Experienced traders capture maximum profit during the third wave with relatively minimal risk exposure.
Fourth Wave Consolidation
The fourth wave represents a necessary correction following the powerful rapid movement of the third wave providing the market adequate time for consolidation before the final concluding movement of the impulse sequence. It typically proves less deep than the second wave and frequently takes the form of prolonged sideways movement symmetrical triangles or complex composite corrective structures. The key rule states that wave four under no circumstances penetrates the price territory of wave one maintaining clear separation between them. Violation of this important rule categorically requires complete revision of the wave count and persistent search for alternative market development scenarios.
Fifth Wave Completion
The fifth wave concludes the impulse phase against a backdrop of maximum enthusiastic optimism among the majority of market participants. The market reaches a state of genuine euphoria while news background becomes maximally positive for the current trend and analysts forecast further movement continuation. However momentum gradually begins to weaken noticeably while trading volume declines compared to the powerful third wave. Characteristic divergences appear on oscillators clearly warning attentive traders about the approaching inevitable reversal. Experienced professionals prepare for the reversal in advance gradually reducing their positions and transitioning to defensive conservative strategies.
Corrective Phase: Waves A, B, C
Following the completion of the fifth impulse a corrective wave phase inevitably begins consisting sequentially of three separate waves forming the ABC correction structure. Wave A decisively initiates movement against the main trend catching many careless participants completely off guard and causing panic selling. Many inexperienced traders naively view it as an ordinary minor pullback and actively attempt to buy the dip hoping for recovery and trend continuation. Wave B masterfully creates a convincing illusion of previous trend resumption sometimes reaching high levels of wave 5 and substantially reinforcing false optimistic hopes among participants. Wave C mercilessly completes the correction often exceeding wave A length and reaching deep support levels according to Fibonacci measurements.
Corrective Patterns
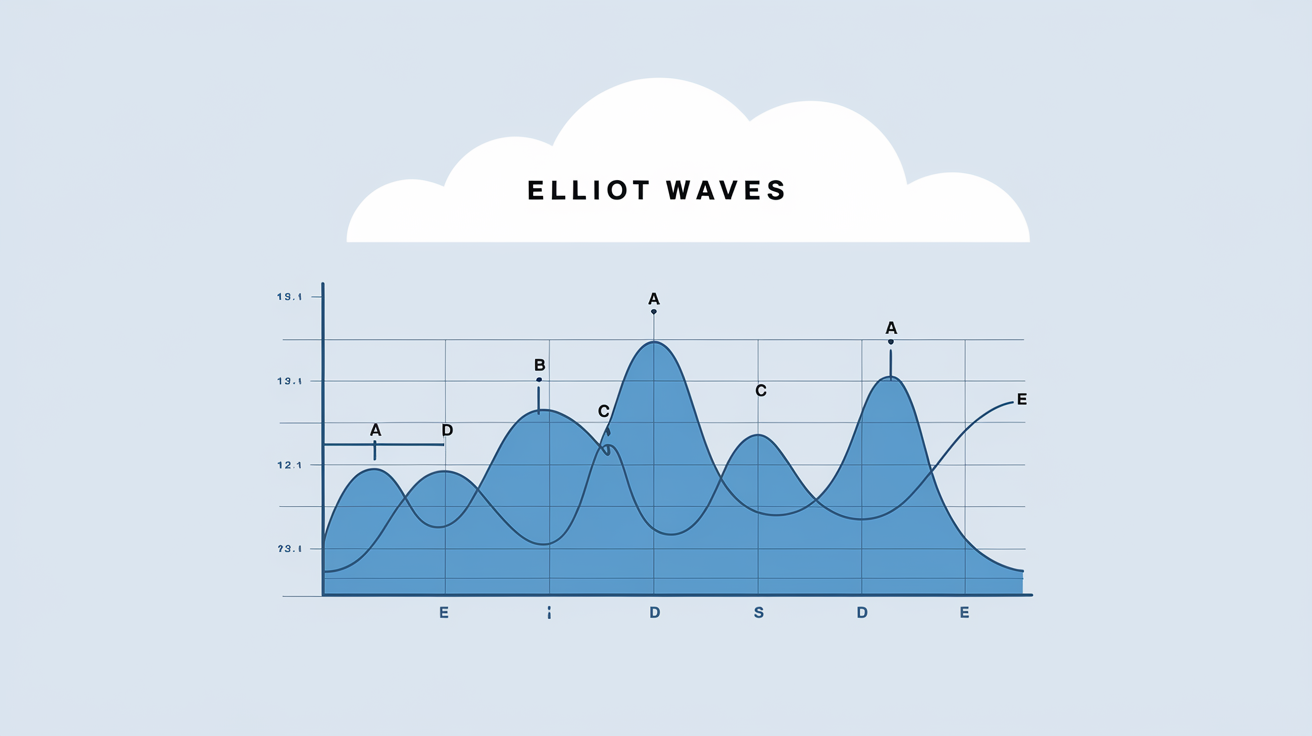
Corrective waves form various patterns depending on current market conditions and preceding trend strength. A zigzag represents a sharp steep correction with ABC structure where wave B fails to reach the start of wave A appearing weak in comparison. A flat features predominantly horizontal movement with approximately equal waves indicating temporary balance between buyers and sellers in the market. A triangle consists of five sequential waves labeled A through E gradually narrowing the price range before a powerful breakout in the direction of the main trend. Recognition of these patterns helps traders identify the precise moment of correction completion.
Practical Application of Elliott Waves
Practical application of Elliott Waves invariably begins with thorough determination of the current market phase and precise price position within the wave cycle. Comprehensive analysis proceeds on higher timeframes to identify the global trend direction and main wave count. The trader then transitions to lower timeframes for targeted search of optimal entry points with minimal risk exposure. Combining multiple time intervals significantly improves forecast accuracy and substantially reduces the risk of acting on false signals.
Fibonacci levels deservedly represent an indispensable complement to wave analysis providing necessary mathematical precision for forecasts and price projections. The ratios of 38.2 and 50 and 61.8 percent determine typical corrective wave depth and effectively help locate potential reversal zones with accuracy. Extensions of 161.8 and 261.8 percent precisely indicate potential impulse wave targets enabling establishment of justified take-profit levels. Confluence of wave targets with Fibonacci levels significantly strengthens the trading signal and improves entry confidence.
Volume analysis reliably confirms wave counts and helps avoid interpretation errors that could lead to incorrect trading decisions. The third wave accompanies maximum volume reflecting mass participation by retail traders and institutional investors alike. The fifth wave demonstrates declining volume despite continuing price movement clearly indicating trend exhaustion and approaching reversal. Corrective waves consistently feature low volume confirming their nature as temporary pullbacks rather than trend changes. Divergence between price and volume signals potential reversal ahead.
Wave Analysis Confirmation Tools
Candlestick patterns help identify wave reversal points with high precision and timing accuracy. Engulfing patterns hammers shooting stars and other reversal formations appear at corrective wave completions signaling market readiness for new directional movement. Doji and pin bars indicate market uncertainty before new movement initiation. Combining wave analysis with candlestick signals substantially increases successful trade probability and improves overall strategy performance.
Technical indicators strengthen wave analysis by providing additional signal confirmation points and filtering out weak setups. RSI identifies overbought and oversold zones at wave boundaries helping determine movement exhaustion moments with precision. MACD confirms trend direction and strength while its divergences warn about impulse wave completion. Moving averages define dynamic support and resistance levels on charts providing additional reference points for traders.
Risk Management in Wave Trading
Risk management in wave trading bases itself on clear rules for protective order placement and position size control to preserve capital. Stop-loss placement occurs beyond the current wave start or at a key level determined by wave analysis ensuring adequate protection. Risk-to-reward ratio should equal at least one to two for ensuring positive mathematical expectation over a series of trades. Position size calculation derives from acceptable risk per trade typically one to two percent of total trading capital.
Market entry points derive from corrective wave completions and receive confirmation from additional technical signals before execution. Second wave completion opens opportunity for participation in the powerful third wave with optimal risk-reward ratio and high profit potential. Fourth wave completion enables joining the fifth wave although potential is typically more limited. ABC correction completion signals the start of a new impulse cycle presenting fresh trading opportunities.
Movement targets calculate through Fibonacci projections and wave ratios enabling justified take-profit establishment with mathematical backing. The third wave typically reaches 161.8 percent of first wave length though it may extend to 261.8 percent in strong trending markets. The fifth wave often equals the first wave or constitutes 61.8 percent of the combined first and third wave lengths.
Limitations and Overcoming Subjectivity
Interpretation subjectivity remains the primary limitation of wave analysis requiring significant experience and practice to overcome. Different analysts may produce different wave counts on identical charts arriving at opposite conclusions about market direction. Practice and study of historical examples develop accurate wave counting skills and understanding of typical market situations. Maintaining a detailed trading journal helps analyze mistakes and continuously improve understanding of wave structures.
The fractal nature of waves means that each higher-degree wave contains a complete smaller-scale wave cycle within it. An impulse wave includes five sub-waves while a corrective wave includes three sub-waves following the same structural rules. This property allows market analysis at any level of detail and enables finding trading opportunities across different timeframes simultaneously.
Crowd Psychology and Wave Structures
Crowd psychology lies at the foundation of wave formation and determines their unique characteristics and behavior patterns. The first wave reflects actions of informed participants who recognize the new trend start earlier than others. The third wave demonstrates mass participation as fear of missing out drives broader joining of the trend. The fifth wave features euphoria and excessive optimism when even conservative investors finally participate.
Wave analysis integrates with other technical analysis methods to improve trading decision reliability and reduce error rates. Trend Structure and price channels help visualize wave boundaries and potential reversal zones. Support and resistance levels confirm wave reversal points with additional validation. Chart patterns complement the wave picture and provide context. A comprehensive approach improves trading decision reliability and overall strategy performance.
Successful application of Elliott Waves requires systematic practice on historical charts and continuous skill improvement over time. Beginning traders should start by counting waves on daily and weekly timeframes of major indices and currency pairs. To consolidate the material, study also Wyckoff analysis. Gradual transition to lower timeframes develops the skill of adapting to different market conditions and trading environments.
Frequently Asked Questions
Elliott Waves represent a technical analysis method describing market movement as repeating wave cycles. A complete cycle consists of eight waves: five impulse waves in the trend direction and three corrective waves against it. The theory bases itself on mass psychology of market participants.
Three fundamental rules govern Elliott Waves: wave 2 never retraces beyond the start of wave 1; wave 3 is never the shortest among impulse waves; wave 4 never enters the price territory of wave 1. Violation of these rules indicates an error in the wave count.
Levels of 38.2%, 50%, 61.8% determine corrective wave depth. Extensions of 161.8% and 261.8% indicate impulse wave targets. Wave three often reaches 161.8% of wave one length. Confluence of wave targets with Fibonacci levels strengthens the trading signal.
The third wave proves most powerful and profitable for trading. It is never the shortest and often reaches 161.8-261.8% of wave one. Entry occurs after the second corrective wave completion when the trend has market confirmation.
Main corrective patterns include: zigzag — sharp ABC correction; flat — horizontal movement with equal waves; triangle — five waves (A-E) narrowing the range. Each pattern indicates different correction strength and helps identify completion timing.
About the Author
Author: Igor Arapov — independent researcher in trading psychology and behavioral finance, practising trader since 2013, founder of arapov.trade, author of a trading book series (Open Library ), (ORCID: 0009-0003-0430-778X ).