Trading levels is one of the most effective and time-tested approaches in technical analysis, used by traders worldwide. This method allows identifying key price zones where the price may reverse, continue its movement, or consolidate. In this article, we will thoroughly explore what levels are in trading, how to properly identify them, which strategies to apply for trading, as well as discuss the advantages, limitations, and practical tips for improving efficiency. If you aim to master trading levels and enhance your market performance, this material will serve as a comprehensive guide.
What is a Level in Trading?
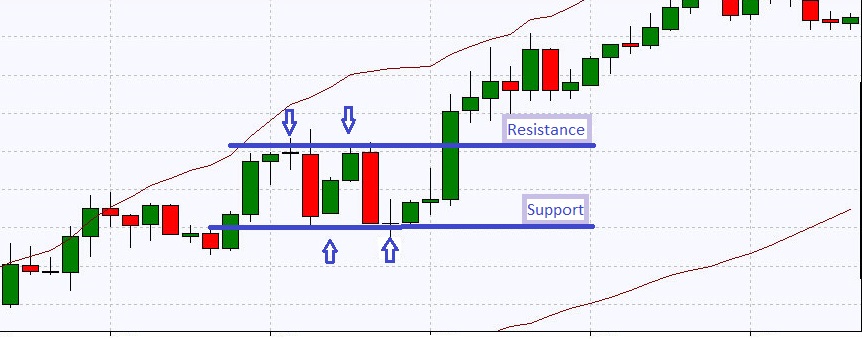
A level in trading is a horizontal line on a price chart that marks a range where the price has previously shown significant changes in direction or consolidation. These levels are formed due to the interaction of supply and demand in the market and are often perceived as key reference points for making trading decisions. The main types of levels are support and resistance, which play a crucial role in predicting price behavior.
Support and resistance levels help traders identify zones where the price is highly likely to pause, reverse, or break through and continue moving. Understanding these zones enables the creation of effective strategies, risk minimization, and finding entry points with high profit potential.
Types of Levels
- Support Level: This is a price zone where demand for an asset increases, preventing further price decline. Typically, in this zone, the price starts to rise as buyers actively enter the market.
- Resistance Level: This is a zone where the supply of an asset increases, halting price growth. Here, sellers begin to dominate, often leading to a price decline.
It’s important to understand that support and resistance levels are not static. After a support level is broken, it may become resistance, and vice versa. This phenomenon, known as role reversal, is often used by traders to confirm signals and build strategies.
How to Identify a Level?
Building levels is a process that requires attention to detail and an understanding of market dynamics. To accurately identify a level, a trader needs to analyze historical chart data and pinpoint key areas where the price showed significant changes. Here are the main steps for identifying levels:
- Find Reversal Points: Pay attention to zones where the price sharply changed direction—these could be local lows (for support) or highs (for resistance).
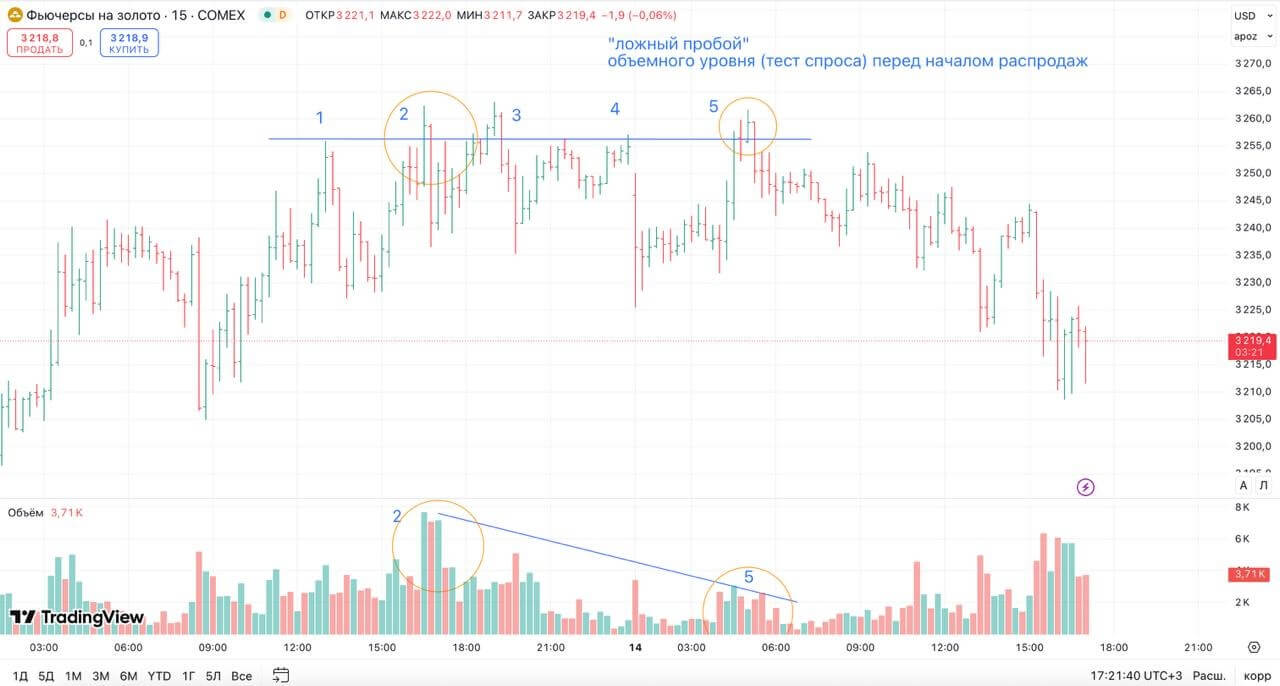
- Assess the Strength of a Level: The more times the price has touched a level without breaking it, the stronger it is considered. For example, a level tested 5–6 times is more significant than one tested only once.
- Consider Volume: High trading volumes at a level confirm its importance, as they indicate active participation from major players.
- Use Multiple Timeframes: Levels visible on higher timeframes (e.g., D1 or W1) carry more weight than those on lower timeframes (M5 or M15).
To improve analysis accuracy, indicators such as volume analysis or Pivot Points can be used to help identify key zones.
Why Do Levels Work?
Support and resistance levels work because they reflect the psychology of market participants. For instance, at a support level, traders see an opportunity to buy an asset at a "favorable" price, increasing demand. At a resistance level, conversely, many lock in profits or open short positions, intensifying selling pressure. Additionally, major players, such as institutional investors and hedge funds, often use levels to place large orders, making them even more significant.
Another reason for the effectiveness of levels is the self-fulfilling prophecy effect. Since many traders use levels in their analysis, these zones become areas of heightened attention where significant market events occur.
Main Strategies for Trading Levels
Trading levels can be implemented through several approaches, each with its own characteristics and requiring a certain level of expertise. The most popular strategies are trading within a range (bouncing off a level) and trading level breakouts. Let’s examine them in detail.
Trading Within a Range
Range trading assumes that the price will move between support and resistance levels without breaking them. This approach is particularly effective in low-volatility markets where the price exhibits sideways movement (flat). Key rules for trading within a range:
- Buy at Support: Open long positions when the price reaches a support level, expecting a bounce upward.
- Sell at Resistance: Open short positions at a resistance level, anticipating a price decline.
- Define Targets: The target is usually the opposite level of the range. For example, when buying at support, the target would be the resistance level.
- Avoid News: During the release of significant economic data (e.g., employment reports or central bank decisions), ranges may be broken, increasing the risk of false signals.
To improve signal accuracy, levels can be combined with indicators such as RSI (to identify overbought/oversold conditions) or moving averages.
Example: Suppose an asset’s price moves within a range between support at $100 and resistance at $120. A trader opens a long position at $100, setting a take-profit at $118 (just below resistance) and a stop-loss at $98. If the price reaches the target, the trader locks in a profit. If the price breaks support, the loss is limited by the stop-loss.
Trading Level Breakouts
A level breakout occurs when the price surpasses a support or resistance level, continuing its movement in the breakout direction. This approach is suitable for trending markets and requires careful analysis to avoid false breakouts. Key signs of a genuine breakout:
- Impulsive Movement: The breakout is accompanied by a sharp price move and increased volume.
- Candle Close Beyond the Level: Confirmation of a breakout is a candle closing above resistance or below support on the chosen timeframe.
- Level Retest: In most cases (about 80–90%), the price returns to the broken level for a retest before continuing its movement.
The breakout trading strategy includes the following steps:
- Wait for breakout confirmation (e.g., a candle closing beyond the level).
- Wait for a retest of the broken level for a more favorable entry point.
- Open a position in the breakout direction, setting a stop-loss beyond the level (slightly above for sells, slightly below for buys).
- Determine the target based on the next significant level or use a risk/reward ratio (e.g., 1:2).
Example: An asset’s price breaks resistance at $50 with high volume. After the breakout, the price returns to $50 for a retest, and the trader opens a long position at $50.10, setting a stop-loss at $49.80 and a take-profit at $52. If the price reaches the target, the trader secures a profit, while the stop-loss protects against a false breakout.
Combined Strategies
To enhance trading efficiency, many traders combine levels with other technical analysis tools. Here are some popular combinations:
- Levels + Fibonacci:Fibonacci levels help identify correction zones that often align with support and resistance levels.
- Levels + Trendlines: Trendlines help determine the market direction, while levels identify key entry points.
- Levels + Candlestick Patterns: Candlestick patterns, such as "Engulfing" or "Pin Bar," strengthen signals at levels, increasing the likelihood of success.
Combined strategies require experience, so beginners are advised to master basic approaches first before gradually incorporating additional tools.
Advantages and Limitations of Trading Levels
Trading levels is one of the most popular technical analysis methods used by traders to predict price movements. Like any approach, it has its strengths and weaknesses. Understanding these aspects allows traders to effectively apply support and resistance levels, minimize errors, and adapt strategies to various market conditions. In this section, we will thoroughly explore the advantages and limitations of trading levels to help you maximize the use of this tool in your practice.
Advantages
Trading levels attracts traders with its simplicity and effectiveness. This method requires no complex calculations or deep knowledge, making it accessible even for beginners. Here are the key advantages that make levels a powerful tool in a trader’s arsenal:
- Ease of Identification: Support and resistance levels are easily identified on a chart through visual analysis. Simply locate zones where the price repeatedly reversed or consolidated to highlight key levels. This makes the method accessible to traders of all experience levels, from novices to professionals.
- High Signal Accuracy: When correctly identified, levels provide clear entry and exit points for positions. For example, a bounce from support or a breakout of resistance is often followed by predictable price movements, enabling traders to plan trades with a high probability of success.
- Versatility of Application: Levels work across all financial markets, including forex, stocks, cryptocurrencies, commodities, and indices. They are also effective on any timeframe—from minute (M1) to monthly (MN)—making them suitable for both scalpers and long-term investors.
- Integration with Other Tools: Levels seamlessly combine with other analysis methods, such as technical analysis, Price Action, Fibonacci levels, or indicators (RSI, MACD, Bollinger Bands). This allows for the creation of more complex and reliable trading systems.
- Psychological Significance: Levels reflect the behavior of market participants, such as major players, institutional investors, and retail traders. Support and resistance zones often become areas of concentrated orders, amplifying their impact on price.
- Support for Long-Term Analysis: Levels formed on higher timeframes (H4, D1, W1) remain relevant for weeks, months, or even years. This allows traders to build long-term forecasts and strategies.
Example: In the forex market, the EUR/USD pair shows a support level at 1.1000, which the price tested five times over the past three months. A trader uses this zone to buy, combining the level with an oversold signal from RSI. The trade is successful as the price bounces upward, reaching resistance at 1.1200.
Limitations
Despite its many advantages, trading levels is not without drawbacks. Understanding these limitations helps traders avoid common mistakes and adapt to challenging market conditions. Here are the main limitations traders face when using levels:
- Subjectivity of Analysis: Identifying levels largely depends on a trader’s experience and perception. For instance, one trader may consider a zone significant after two price touches, while another might wait for at least five. This subjectivity can lead to erroneous signals, especially for novice traders.
- False Breakouts: The market sometimes generates false signals when the price breaks a level but quickly reverses. Such situations are particularly common on lower timeframes (M1, M5) or during high volatility triggered by news. False breakouts can result in losses if a trader does not use confirmations.
- Influence of Fundamental Factors: Macroeconomic events, such as inflation data releases, central bank decisions, or geopolitical conflicts, can disrupt the logic of levels. For example, an unexpected interest rate hike may trigger a sharp breakout of a level that previously seemed reliable.
- Need for Experience: Although levels appear simple, accurately identifying them requires practice and a deep understanding of market dynamics. Beginners often err by marking minor zones or ignoring key factors like volume or market context.
- Risk of Chart Overload: Traders, especially beginners, may plot too many levels on a chart, leading to confusion and reduced analysis efficiency. This complicates decision-making and increases the likelihood of false signals.
- Limited Effectiveness in Trending Markets: Levels work best in flat or moderately volatile conditions. In strong trending markets, the price may ignore levels, breaking them without a retest, which complicates trading.
Example: On the BTC/USD chart, a trader notices a resistance level at $40,000. The price breaks this level, and the trader opens a long position, expecting continued growth. However, the breakout turns out to be false, and the price quickly drops to $39,500. Had the trader waited for a retest or volume confirmation, the loss could have been avoided.
To overcome these limitations, traders should combine levels with other analysis tools, use signal confirmations, and strictly adhere to risk management rules. This helps improve trade accuracy and minimize the impact of subjective factors.
How to Minimize Risks When Trading Levels?
Trading levels, despite its effectiveness, always involves risks, as does any other trading method. Market unpredictability, news impact, and psychological factors can lead to losses if caution is not exercised. In this section, we will review key recommendations to help minimize risks, increase the likelihood of successful trades, and protect your capital when trading levels.
- Use Stop-Loss: Setting a stop-loss is the foundation of risk management in trading. A protective order limits losses if the market moves against your position. When trading levels, a stop-loss is typically placed just above (for sells) or below (for buys) a key level to account for potential false breakouts.
- Analyze Volume: Trading volume is a critical indicator of a level’s significance. High volumes at a support or resistance level confirm its strength, indicating active participation from major players. Use indicators like Volume or On-Balance Volume (OBV) to enhance analysis accuracy.
- Avoid Overtrading: Opening too many positions, especially in uncertain conditions, increases the risk of losses. Focus on high-potential trades based on strong levels and confirmed signals. Quality matters more than quantity.
- Monitor News Background: Fundamental events, such as employment reports, interest rate decisions, or corporate news, can cause sharp price movements, disrupting the logic of levels. Check the economic calendar and refrain from trading during major data releases unless your strategy is adapted to high volatility.
- Test Strategies: Before applying a new strategy on a live account, test it on a demo account or using historical data. This allows you to evaluate the approach’s effectiveness, identify weaknesses, and adapt it to your trading style.
- Maintain Risk/Reward Ratio: Ensure that the potential profit from a trade is at least twice the possible loss (a ratio of 1:2 or higher). This helps maintain a positive mathematical expectation even through a series of losing trades.
- Study Market Context: Levels do not exist in a vacuum. Analyze the overall trend direction, volatility, and price behavior to gauge the likelihood of a level holding. For instance, a support level in a strong downtrend is more likely to be broken than in a sideways market.
Example: A trader trades at a support level of $50 for asset XYZ. They open a long position at $50.10, setting a stop-loss at $49.80 and a take-profit at $52.00, yielding a risk/reward ratio of 1:3. High volumes at the level and a calm news background confirm the signal. The price reaches the target, generating a profit, while the stop-loss protects against an unexpected breakout.
Applying these recommendations requires discipline and a systematic approach. Regular trade analysis and adherence to risk management will help minimize losses and steadily improve results when trading levels.
Practical Recommendations for Successful Level Trading
To achieve consistent profits from trading levels, traders need to combine technical skills, discipline, and a deep understanding of the market. Support and resistance levels are not just lines on a chart but reflections of market psychology and participant behavior. In this section, we share practical tips to help you master this method and succeed in trading.
- Work with Multiple Timeframes: Analyzing levels on higher timeframes (H4, D1, W1) helps identify global zones that carry more weight in the market. Lower timeframes (M15, H1) assist in finding precise entry points and minimizing noise. For example, a support level on a daily chart, confirmed by a bounce on an hourly timeframe, provides a strong buy signal.
- Combine Tools: Levels become even more effective when used alongside other analysis methods. For instance, a support level coinciding with a 61.8% Fibonacci level or a Price Action candlestick pattern (e.g., "Pin Bar") strengthens the signal. Indicators like RSI or moving averages are also useful for trend confirmation.
- Keep a Trading Journal: Record all your trades, including levels, entry/exit points, reasons for opening a position, and results. This helps identify the strengths and weaknesses of your strategy and understand which levels perform better in specific market conditions. Over time, the journal becomes a valuable resource for optimizing trading.
- Control Emotions: Greed, fear, and impatience are a trader’s worst enemies. For example, entering a trade without signal confirmation or increasing position size after a series of losses can lead to catastrophic losses. Strictly follow your trading plan and avoid deviating from it under emotional influence.
- Study the Market: Regularly analyze historical data to understand how levels behave in different conditions—during trends, flats, or high volatility. Studying past price behavior on charts helps develop intuition and improve skills in identifying significant zones.
- Use Confirmations: Don’t open a position based solely on a level touch. Wait for additional signals, such as increased volume, candlestick pattern formation, or a retest of a broken level. This reduces the risk of false signals and increases the likelihood of success.
- Adapt to the Market: Markets constantly evolve, and levels that worked in the past may lose relevance. Regularly review your levels, especially after significant market events like trend changes or major news.
Example: A trader analyzes the GBP/USD pair on a daily chart and notices a resistance level at 1.4000. On an hourly timeframe, they spot an "Engulfing" pattern at this level, confirmed by high volume. The trader opens a short position, logs the trade in their journal, and takes profit when the price reaches support at 1.3800. Later analysis of the journal reveals that combining levels with candlestick patterns yields the best results.
By following these recommendations, you can build a systematic approach to trading levels that is resilient to market changes and helps achieve consistent results.
Common Mistakes Traders Make When Trading Levels
Trading levels may seem straightforward at first glance, but even experienced traders make mistakes that can lead to losses. Understanding these errors and how to prevent them is key to successful trading. In this section, we will review the most common mistakes and provide practical advice on how to avoid them.
- Ignoring Confirmations: Many traders open positions immediately after a level touch without waiting for additional signals, such as a retest, increased volume, or candlestick pattern formation. This increases the risk of false breakouts and losses. Solution: Always wait for confirmation, such as a candle closing beyond the level or the appearance of a Price Action pattern, before entering a trade.
- Trading on Lower Timeframes: Levels on low timeframes (M1, M5) are often prone to market noise, making them less reliable. Beginners frequently trade on such charts, losing money due to false signals. Solution: Use timeframes from H1 and above to identify levels, and lower timeframes only to refine entry points.
- Too Many Levels: Plotting too many levels on a chart creates confusion and complicates decision-making. Traders may lose focus by trying to trade minor zones. Solution: Focus on 2–3 key levels that the price has tested multiple times and are confirmed by volume or other tools.
- Lack of Risk Management: Ignoring stop-losses, miscalculating position sizes, or using a low risk/reward ratio are common causes of significant losses. Solution: Always use a stop-loss and maintain a risk/reward ratio of at least 1:2. Calculate position size so that the risk per trade does not exceed 1–2% of your deposit.
- Trading Against the Trend: Some traders attempt to catch reversals at levels while ignoring the overall market direction. For example, buying at a support level in a strong downtrend rarely succeeds. Solution: Analyze the trend using trendlines or indicators and trade primarily in the direction of the trend.
- Underestimating News: Trading during major news releases without considering their impact can lead to unexpected level breakouts. Solution: Study the economic calendar and avoid active trading during data releases like Non-Farm Payrolls or Fed decisions.
By avoiding these mistakes, traders can significantly improve the effectiveness of level trading. The key is a systematic approach, discipline, and continuous learning.
Conclusion
Trading levels is a versatile and powerful tool that helps traders structure market analysis and find high-potential entry points. Support and resistance levels reflect the psychology of market participants, making them a reliable guide for decision-making. By mastering this method, you can trade on any market—from forex and cryptocurrencies to stocks and commodities—with greater confidence and efficiency.
However, success in trading levels requires not only technical skills but also discipline, patience, and risk management. Combine levels with other tools, such as technical analysis, Fibonacci levels, or Price Action, to improve signal accuracy. Monitor the news background, analyze volume, and regularly test your strategies on a demo account.
To deepen your knowledge, explore our materials on risk management, trading psychology, and market volatility. Start applying levels to your trading today, and you’ll see how a systematic approach can transform your results!
About the Author
Author: Igor Arapov — independent researcher in trading psychology and behavioral finance, practising trader since 2013, founder of arapov.trade, author of a trading book series (Open Library ), (ORCID: 0009-0003-0430-778X ).