Market Auction: How Price Forms and Where to Find Entries
Every price in the market results from continuous negotiation between buyers and sellers. This process is called the market auction. Understanding its mechanics allows you to see not just price movement, but the logic behind every bar and candle. Auction theory explains why price moves the way it does.
The market constantly seeks a level where the number of willing buyers equals the number of willing sellers. When such a level is found, balance forms — price trades in a range. When equilibrium breaks, imbalance begins — directional movement toward a new zone of agreement. To understand this topic more deeply, I recommend studying market phases.
Market Auction Phases
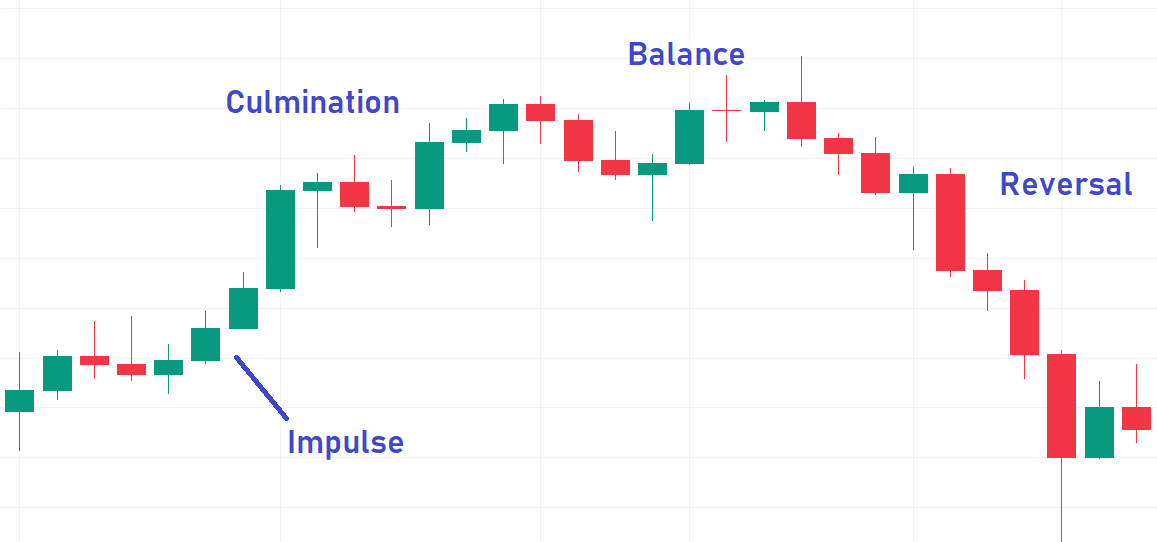
The auction develops through specific stages. The opening phase forms the initial range based on accumulated orders. Participants test levels, determining where supply and demand exist. Then the market either remains in balance or breaks out.
The balance phase features sideways movement. Price oscillates between upper and lower boundaries, forming a fair value zone. Market Profile shows this zone as the area with maximum trading volume. The center of this area — POC (Point of Control) — is the level where most trades occurred.
The imbalance phase starts when one side gains advantage. Buyers or sellers take control, and price breaks beyond the balance zone. This is trend beginning. Important: the breakout must come with volume increase. Without volume, the breakout may be false.
The climax phase ends the move. Large players take profits, volume spikes sharply, but price stops advancing. This signals potential reversal or new consolidation beginning.
Market Profile as an Analysis Tool
Market Profile visualizes the auction process. Instead of traditional price charts, it shows how much time or volume price spent at each level. The result — a bell-shaped profile during balance or elongated form during trends.
VAH (Value Area High) and VAL (Value Area Low) are upper and lower boundaries of the value zone where 70% of volume traded. Breaking beyond these boundaries signals potential trend start. POC inside this zone acts as a price magnet.
Practical application: if price trades below yesterday's VAL and volume increases — sellers control the market. If price returns inside the value zone on low volume — false breakout, bounce likely.
Sentiment: Market Participant Mood
Sentiment is the aggregate mood of traders and investors. It reflects whether optimism or fear prevails in the market. Sentiment analysis complements auction theory, showing the emotional backdrop behind price movements.
Fear & Greed Index — a popular indicator measuring market fear and greed. Values above 80 indicate euphoria — the market may be overheated. Values below 20 — panic and potential bottom. Extreme values often precede reversals.
Put/Call Ratio shows the ratio of put options to call options. Values above 1 mean bearish sentiment dominates. Below 0.7 — bullish optimism that may signal overheating.
Long/short position ratio reflects retail trader positioning. If most are long, this may signal large players to push price down — harvesting stop-order liquidity.
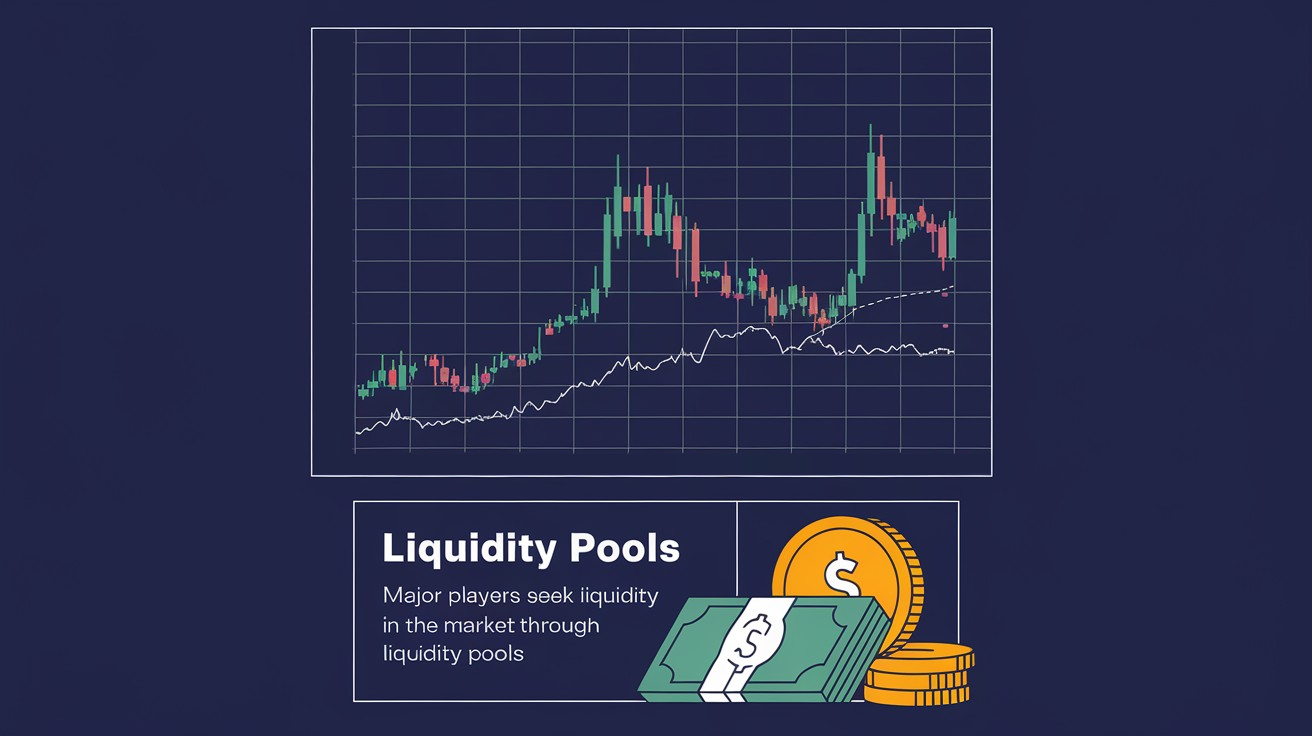
How Market Makers Use Sentiment
Large players see crowd positioning and use this knowledge. They know where most stop orders are placed and move price toward those zones. This is called stop hunting or liquidity harvesting.
False breakouts are a classic tool. Price breaks beyond a level, triggers stops, collects liquidity, and reverses. Understanding this mechanism helps avoid traps and even use them for entries.
Order book manipulation: large orders appear and disappear, creating illusion of supply or demand. This is spoofing. Watching the tape helps distinguish real trades from manipulation.
Practical Application
Trading from balance: wait for Value Area boundary breakout with volume confirmation. If VAH breaks on rising volume — look for longs. If price returns to the zone on low volume — false breakout likely.
Trading from POC: when price approaches the maximum volume level and reversal signs appear (candlestick patterns, delta, large orders in the book) — this is a potential entry point. POC works as a magnet and often becomes support or resistance.
Combining with sentiment: if Market Profile shows upward balance breakout, but Fear & Greed Index shows extreme high values — be cautious. The market may be overheated, and the breakout could be a trap.
Climax analysis: sharp volume spike without continued movement signals large player profit-taking. If sentiment shows extreme values simultaneously — high reversal probability.
Types of Auction Days
Auction theory fits perfectly with the Wyckoff Method. Normal day — price moves in narrow range, profile is symmetric, POC in center. This is a balance day, suitable for trading from boundaries.
Trend day — price moves in one direction all day, profile is elongated. POC forms near the beginning or end of the day. Such days are rare (15-20% of sessions) but offer maximum profit on correct entry.
Double distribution day — two separate balance zones form. Between them — a low volume zone. This indicates sharp sentiment change within the session. Often occurs after important news.
Protection from Manipulation
Don't enter on impulse without confirmation. Wait for level retest or consolidation after breakout. Analyze volume — true breakouts come with volume increase. Watch the tape for real trade identification.
Use POC and Value Area to determine significant levels. These zones show where real trading happened, not random fluctuations. Place stops beyond these levels with volatility buffer.
Market auction and volume analysis are powerful tools for understanding market mechanics. They show not just what happens, but why. Master them, and you'll start seeing the logic behind every price movement.
Frequently Asked Questions
Price formation mechanism through supply and demand interaction seeking equilibrium.
Balance — equal supply and demand, ranging price. Imbalance — one side dominates, trend forms.
Find POC, VAH, VAL. Breaking Value Area with volume — trend start. POC is price magnet.
Prevailing sentiment: high values — greed and overheating, low — fear and potential bottom.
Wait for volume confirmation. Analyze the tape and order book for real activity.
About the Author
Author: Igor Arapov — independent researcher in trading psychology and behavioral finance, practising trader since 2013, founder of arapov.trade, author of a trading book series (Open Library ), (ORCID: 0009-0003-0430-778X ).