Head and Shoulders is one of the most reliable reversal patterns in technical analysis, signaling a change in the current trend direction. Traders use this pattern across stock, forex, and cryptocurrency markets to identify optimal entry points. The formation develops at the top of an uptrend and indicates potential price decline.
Structure of the Head and Shoulders Pattern
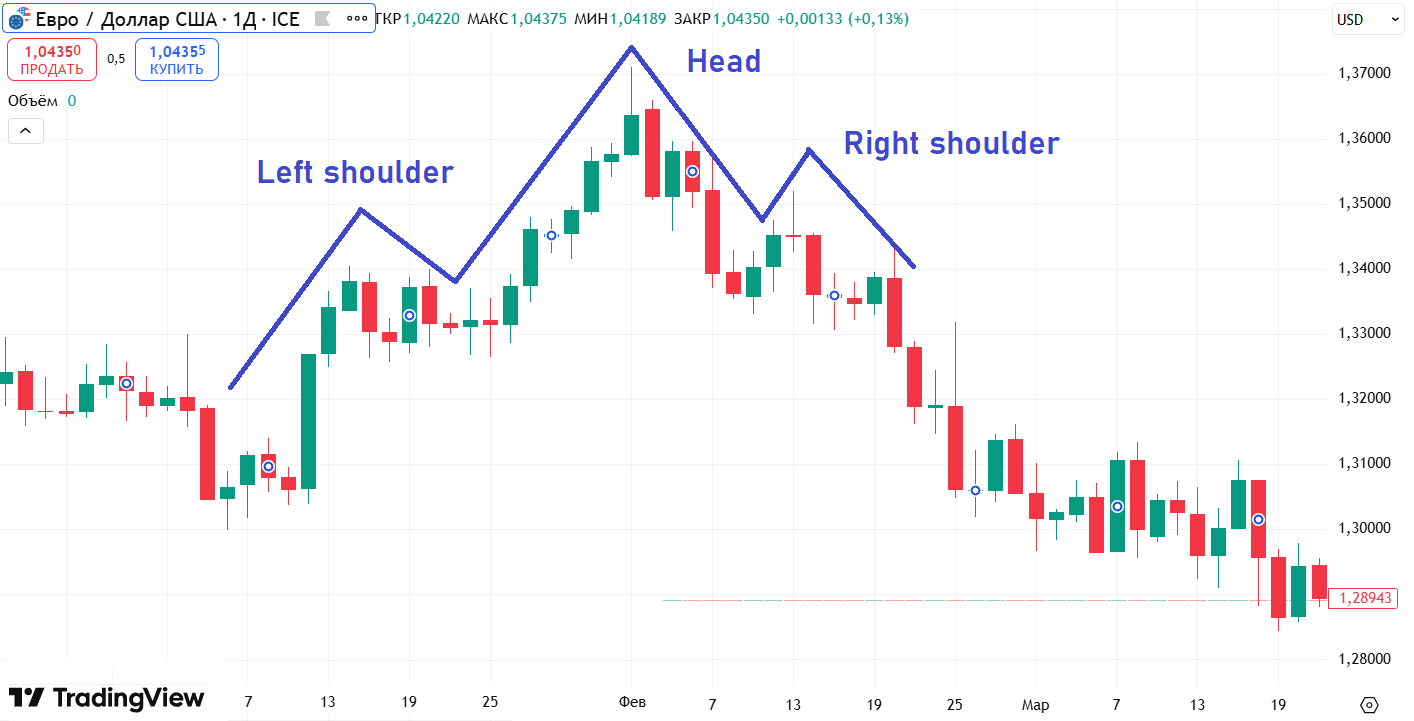
The classic formation consists of three key elements. The left shoulder represents the first peak, followed by a minor downward correction. The head is the highest point of the pattern, demonstrating the final impulse of upward movement. The right shoulder forms lower than the head and confirms weakening buyer activity.
The Neckline
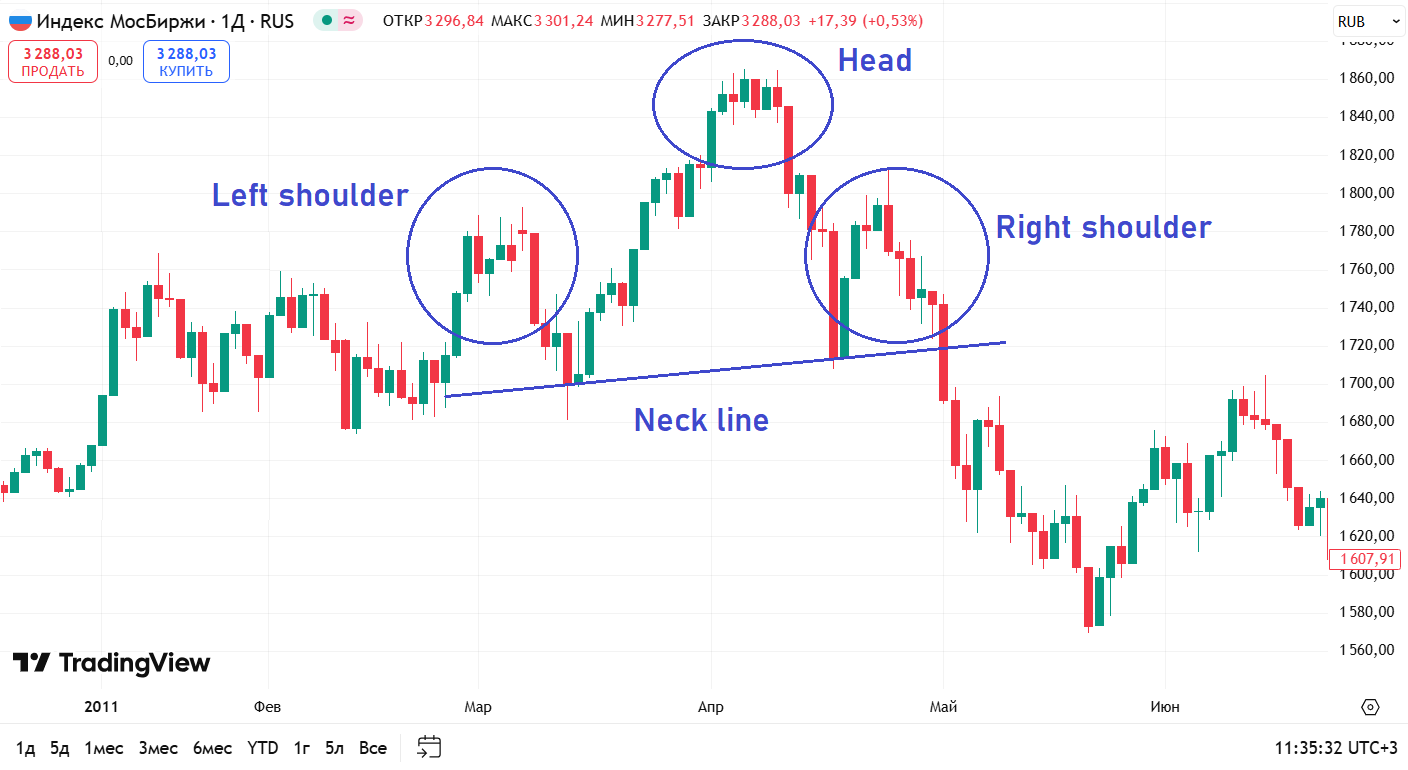
The neckline connects the lows between the left shoulder and head, as well as between the head and right shoulder. It can be horizontal or sloping. Breaking this line serves as the main signal of trend reversal and market readiness for decline. Read more about this in the article: reversal patterns.
Entry Signals
Position opening occurs after confirmed neckline breakout. Key factors for decision-making include candle close below the neckline, increased trading volume on breakout, and possible neckline retest as new resistance. Additional confirmation may come from indicators : divergence on RSI or MACD indicates weakening upward momentum.
It is crucial to wait for complete pattern formation before entering a position. Premature entry before confirmed neckline breakout is one of the most common mistakes among beginner traders. The market may form a structure resembling Head and Shoulders but then continue moving in the direction of the original trend. This topic is directly related to the article on price patterns.
Stop-Loss and Take-Profit Placement
Stop-loss is placed above the right shoulder for a conservative approach or above the head for a wider stop. The profit target is calculated using the symmetry rule: measure the distance from head to neckline and project it downward from the breakout point. This represents the minimum price movement target. Partial position closure is possible at 50% of the target distance.
The risk-to-reward ratio when trading the Head and Shoulders pattern typically ranges from 1:2 to 1:3, making this formation attractive for systematic trading. Some traders use the ATR indicator to calculate an adaptive stop-loss that accounts for current market volatility. This is particularly relevant for highly volatile instruments.
Combining with Other Tools
Pattern effectiveness increases when using additional analysis methods. Check if the neckline coincides with a significant support level. Candlestick patterns such as bearish engulfing on the right shoulder or pin bar near the neckline strengthen the signal. Fibonacci levels help determine additional profit targets.
Volume analysis plays a critical role in pattern confirmation. During head formation, volumes are typically higher than during shoulder formation. During neckline breakout, volumes should increase significantly, confirming large player participation in the move. Declining volume on breakout may indicate a false signal.
Practical Trading Examples
Consider an example on the EUR/USD daily chart. After an extended uptrend, a classic Head and Shoulders pattern forms. The left shoulder develops at the 1.1200 level, the head reaches 1.1350, and the right shoulder forms at 1.1180. The neckline passes through the 1.1050 level. After neckline breakout with increasing volume, a short position is opened with stop-loss above the right shoulder (1.1220) and take-profit at 1.0750 (pattern height of 300 pips).
Inverse Head and Shoulders
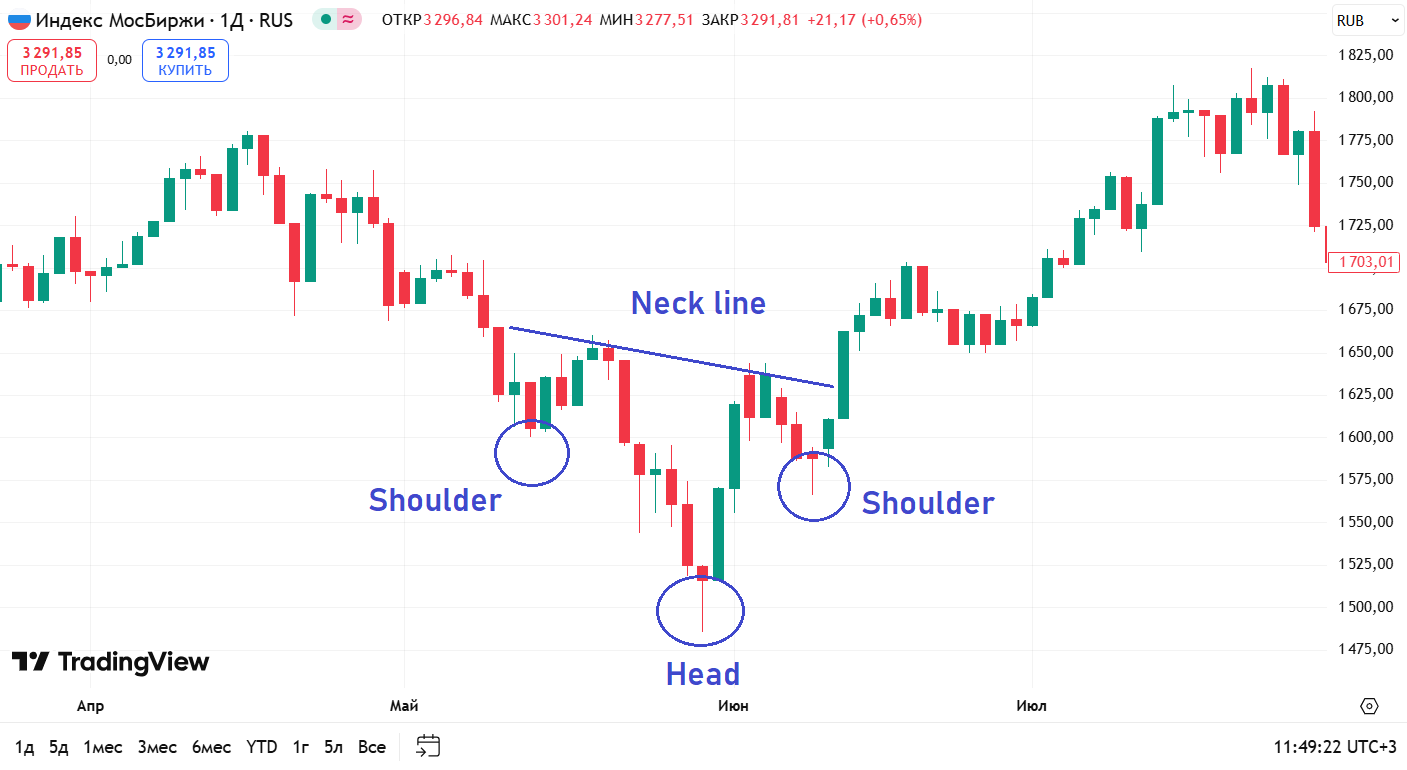
The Inverse Head and Shoulders represents a mirror version of the classic pattern, forming at the bottom of a downtrend. The formation consists of three troughs: left shoulder, head (deepest point), and right shoulder. An upward neckline breakout signals reversal toward growth.
Trading the inverse formation follows similar principles: entry after confirmed neckline breakout with volume increase, stop-loss below the right shoulder, take-profit based on pattern height. Sometimes after breakout, price returns to test the neckline as a new support level — this provides a good additional entry point.
Common Trader Mistakes
Major mistakes when trading the pattern include premature entry before confirmed breakout, ignoring volume during breakout analysis, setting stop-loss too tight, and lacking a clear take-profit target. Many traders also mistakenly identify similar structures as true Head and Shoulders patterns without verifying compliance with classic criteria.
Another common mistake is ignoring overall market context. The Head and Shoulders pattern is most effective after a strong extended trend. In a sideways market or after weak movement, the formation may produce false signals. It is also important to consider fundamental factors: major economic news releases can negate technical signals.
Pattern Psychology
Understanding the psychology behind the Head and Shoulders pattern helps traders make more informed decisions. The left shoulder forms when buyers still control the market, but first signs of exhaustion appear. The head reflects bulls' final attempt to push price higher, however sellers begin actively entering the market. The right shoulder demonstrates buyers' inability to make a new high, indicating their weakness.
The neckline breakout is the culmination of the battle between buyers and sellers. At this moment, sellers definitively take control of the market, while buyers holding long positions begin closing them en masse, accelerating the downward movement. This is why neckline breakout is accompanied by increased volume.
Market Conditions for Application
The pattern works best on daily and four-hour charts after a strong trend. On smaller timeframes, the probability of false signals increases. Volume increase during neckline breakout confirms signal strength. Using additional indicators and support and resistance levels improves analysis reliability.
In the Forex market, the Head and Shoulders pattern works effectively on major currency pairs due to their high liquidity and technical nature of movement. In stock markets, the pattern performs well on large company stocks and market indices. In cryptocurrency markets, due to increased volatility, using wider stop-losses and waiting for clear breakout confirmation is recommended.
Features of the Inverse Formation
The Inverse Head and Shoulders pattern has its own trading characteristics. Formation occurs at the bottom of a downtrend when sellers lose control of the market. Volume during head formation is typically high, while during right shoulder formation it decreases, indicating seller exhaustion. Upward neckline breakout should be accompanied by increasing volume to confirm trend change.
When trading the inverse formation, stop-loss is placed below the right shoulder or below the head for a wider stop. Take-profit is determined similarly to the classic version — height from head to neckline is projected upward from the breakout point. Neckline retest after breakout provides an additional opportunity to enter a long position. To consolidate this material, also study false breakouts.
Conclusion
The Head and Shoulders pattern is a universal tool for identifying reversal points across various markets. Its successful application requires patience, signal confirmation through volume and indicators, and proper risk management. When following trading rules, the formation demonstrates high effectiveness in identifying trend changes.
Frequently Asked Questions
Head and Shoulders is a reversal chart pattern that forms at the top of an uptrend. It consists of three peaks: left shoulder, head (highest point), and right shoulder. A neckline breakout signals a trend reversal to the downside.
The neckline is a support level connecting the lows between the left shoulder and head, and between the head and right shoulder. It can be horizontal or sloping. Breaking this line is the main signal to enter a trade.
Stop-loss is placed above the right shoulder (conservative approach) or above the head (wider stop). You can also use the ATR indicator to calculate an adaptive stop based on current market volatility.
Inverse Head and Shoulders is a mirror version of the pattern forming at the bottom of a downtrend. It consists of three troughs: left shoulder, head (lowest point), and right shoulder. An upward neckline breakout signals a reversal to growth.
The profit target is calculated using the symmetry rule: measure the distance from the head to the neckline and project it from the breakout point in the trade direction. This distance is the minimum price movement target after breakout.
About the Author
Author: Igor Arapov — independent researcher in trading psychology and behavioral finance, practising trader since 2013, founder of arapov.trade, author of a trading book series (Open Library ), (ORCID: 0009-0003-0430-778X ).