The Double Top and Double Bottom stand among the most recognizable reversal patterns in the technical analyst's toolkit. These classic formations reflect moments when the dominant market force exhausts itself and control transfers to the opposing side, creating opportunities to enter at the beginning of a new trending movement. To understand this topic more deeply, I recommend studying price patterns.
Understanding the logic behind these model formations extends beyond simple visual recognition. Behind chart patterns lies real battle between buyers and sellers, and the ability to read this dynamic enables traders to make informed decisions about position entry and exit.
Double Top Formation Mechanics
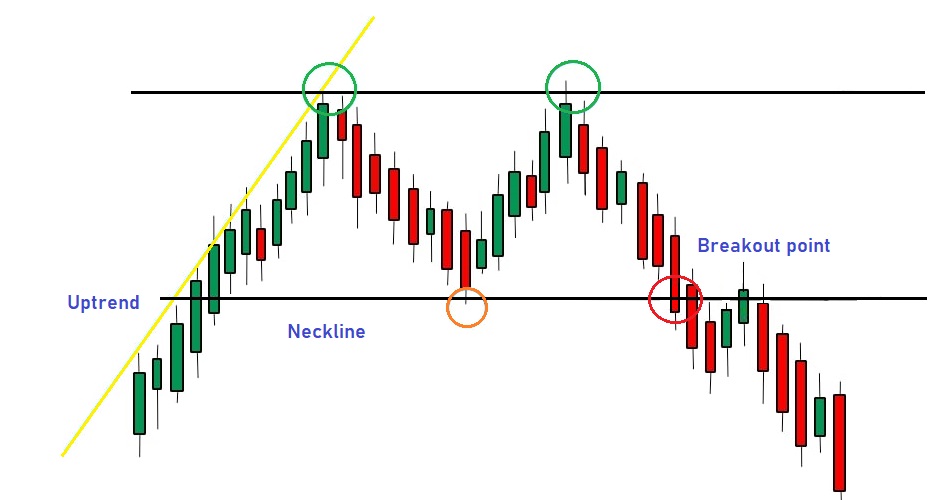
A Double Top emerges after extended upward movement when buyers attempt twice to push price above a certain level but fail. The first peak forms at the height of bullish enthusiasm when some traders begin taking profits, triggering a pullback to the neckline.
Following the pullback, buyers make a second attempt, but their strength proves insufficient to overcome the previous high. Formation of the second peak at approximately the first's level demonstrates weakening bullish momentum. Each failed resistance assault strengthens seller positions and undermines buyer confidence.
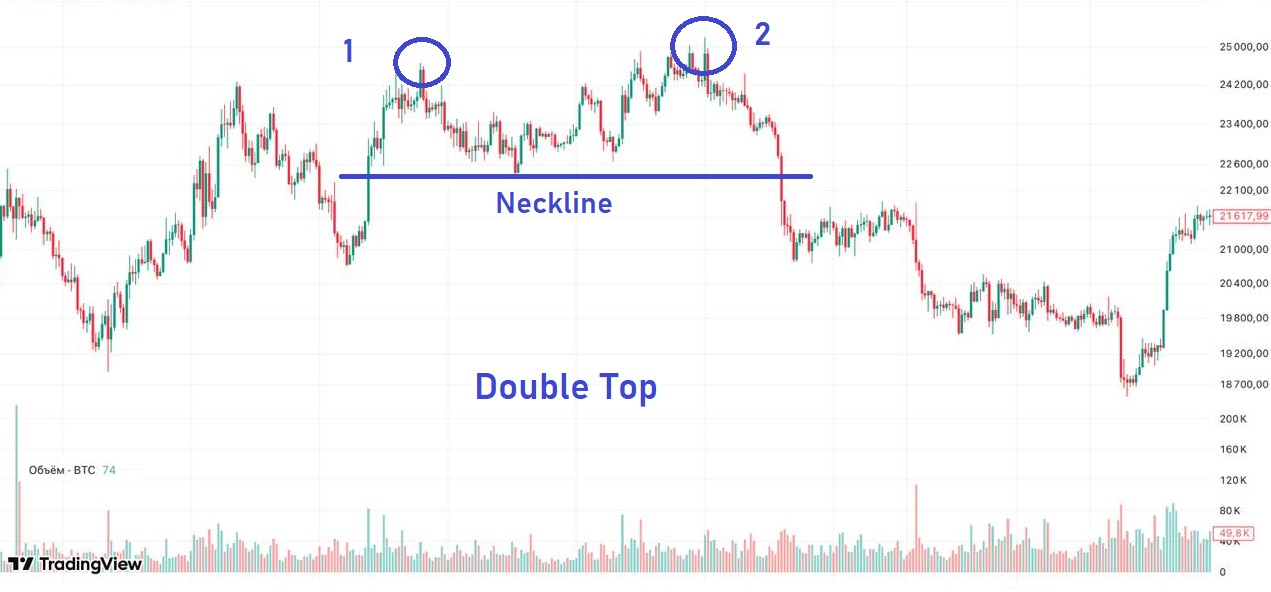
The critical moment arrives with neckline breakout — the horizontal level drawn through the minimum between two peaks. This break activates buyer stop orders and attracts new sellers, creating momentum for downward movement development.
Double Bottom Structure
Double Bottom represents the mirror image of Double Top and forms after sustained downtrend. Sellers test a certain support level twice but cannot push price lower. The first minimum emerges at maximum pessimism when some bears begin closing short positions.
The subsequent bounce creates an intermediate high forming the pattern's neckline. Sellers' second attempt to break the low fails — buyers seize initiative, demonstrating readiness to defend the support level.
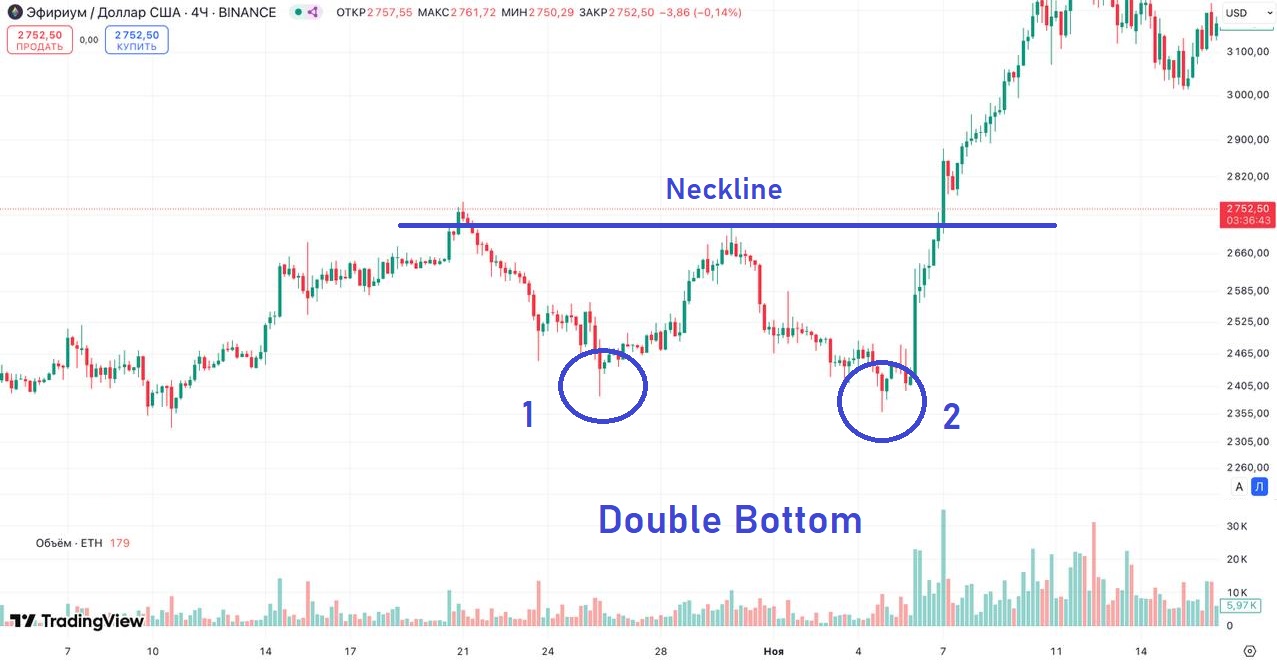
Upward neckline break confirms bearish phase completion and new upward movement beginning. Sellers holding short positions are forced to cover, adding fuel to the bullish impulse.
Quality Pattern Criteria
Extreme symmetry increases pattern reliability. Ideally, both peaks or both lows should sit at close price levels — the difference shouldn't exceed 2-3%. Significant level divergence may indicate formation of a different model or signal weakening.
The time interval between extremes affects pattern significance. Too close placement of peaks or lows may prove mere noise. Optimal spacing on daily charts ranges from several weeks to several months — enough time for complete market structure formation.
Pullback depth to neckline between extremes should be meaningful — at minimum 10-15% of impulse move height. Shallow pullbacks create blurred patterns with unclear necklines, complicating entry point determination.
Volume Confirmation
Volume dynamics provide valuable information about pattern strength. During second extreme formation, volumes typically run lower than the first — reflecting dominant force weakening. Buyers (for double top) or sellers (for double bottom) lose enthusiasm.
Volume confirmation of neckline break proves critically important. Genuine breakout accompanies significant trading activity surge indicating major player participation. False breakouts typically occur on low volume — price exits beyond neckline but quickly returns.
The On-Balance Volume indicator helps assess accumulation or distribution during pattern head and shoulders formation. Divergence between OBV direction and price can warn of probable reversal in advance.
Divergence as Confirming Signal
Divergence between price and technical indicators significantly strengthens reversal signals. During double top formation, price reaches approximately equal highs while RSI or MACD show lower peaks — this bearish divergence indicates weakening momentum.
Similarly, during double bottom, bullish divergence manifests when price forms two lows at close levels while indicators demonstrate rising lows. This discrepancy shows bearish momentum exhausting despite visually similar price levels.
Most reliable signals emerge when divergence coincides across multiple indicators — RSI, MACD, stochastic. Multiple confirmation increases successful reversal probability.
Entry Strategies
The conservative approach involves waiting for confident neckline break with candle closing beyond it. This reduces false breakout entry risk, though may result in missing portion of the move. For additional confirmation, candlestick patterns are used — bullish or bearish engulfing on breakout strengthens the signal.
Neckline retest after breakout provides a second entry opportunity. Price often returns to the broken level to test it in its new role — former support becomes resistance and vice versa. Successful retest with bounce confirms breakout strength.
Aggressive traders enter during second extreme formation without waiting for neckline break. This approach provides better entry price but carries elevated risk — the pattern may not complete, and price may continue trending movement.
Risk Management
Stop-loss when trading double top is placed above the second high with small buffer for market noise. Breaking level invalidates the pattern — if buyers can overcome resistance, the reversal failed.
For double bottom, stop is set below the second low. The logic remains identical — sellers' ability to push price below this level cancels the bullish scenario. Using the ATR indicator helps adapt stop size to current market volatility .
Pattern height projection determines minimum movement target. Distance from extreme to neckline is measured from breakout point in new trend direction. Additional targets are determined using historical support and resistance levels.
Market Context
Reversal pattern effectiveness depends on overall market conditions. A double top after extended bull market carries higher success probability than similar formation at upward movement beginning. Technical analysis of higher timeframes helps assess trend maturity.
Pattern location relative to key levels increases its significance. Double top at historical resistance or double bottom at multi-year support carries greater weight than formations in random price zones.
News flow can accelerate or slow pattern development. Significant economic data or corporate report releases create additional volatility capable of both confirming and invalidating forming models.
Common Mistakes
Premature entry before neckline break represents common beginner error. The pattern may not complete: price can form a third peak or third bottom, transforming into a different model. Waiting for breakout confirmation protects against premature entries.
Ignoring volume leads to false breakout entries. Professional traders always analyze trading activity during pattern formation and especially during neckline break. Low-volume breakout rarely produces sustained movement.
Inflated target expectations present another frequent problem. Height projection provides minimum, not guaranteed target. Partial profit-taking at intermediate levels locks in results even with incomplete pattern execution.
Application Across Markets
In forex markets, double tops and bottoms often form around key psychological levels and central bank intervention zones. High forex market liquidity contributes to clear pattern formation with well-defined boundaries.
Stock markets demonstrate these models on individual equity and index charts. Corporate events — earnings releases, dividend cutoffs, merger announcements — can serve as catalysts for pattern completion.
Cryptocurrency markets with their high volatility regularly create double top and bottom formations. However, elevated volatility requires wider stops and caution when determining targets. Patterns in crypto may execute faster, but false breakouts occur more frequently.
Frequently Asked Questions
A Double Top is a reversal pattern forming after an uptrend. It consists of two consecutive peaks at approximately the same level with an intermediate pullback. A downward break of the neckline confirms the reversal and signals the beginning of a downward movement.
A Double Bottom is a reversal pattern appearing after a downtrend. It consists of two consecutive lows at approximately the same level with an intermediate bounce upward. An upward break of the neckline confirms the reversal and signals the beginning of an upward movement.
The neckline is drawn through the local minimum between the two peaks (for double top) or through the local maximum between the two lows (for double bottom). Breaking this line is the key signal for trade entry.
The minimum target is calculated by projecting the pattern height from the neckline breakout point. Pattern height is the distance from the peak (or bottom) to the neckline. Additional targets are determined using support and resistance levels.
Confirmation uses volume (increase on neckline break), RSI (divergence at second extreme), MACD (line crossover in reversal direction). Candlestick patterns at the second extreme also strengthen the signal.
About the Author
Author: Igor Arapov — independent researcher in trading psychology and behavioral finance, practising trader since 2013, founder of arapov.trade, author of a trading book series (Open Library ), (ORCID: 0009-0003-0430-778X ).