The triangle pattern stands as one of the most recognizable chart formations in technical analysis of financial markets. Traders actively utilize this model across stock, forex, and cryptocurrency markets to forecast future price movements with greater accuracy. Triangle formation indicates a temporary market consolidation where buying and selling forces reach equilibrium. The narrowing price range signals energy accumulation before a powerful impulsive breakout in a particular direction. This pattern's versatility makes it an indispensable tool in every trader's analytical arsenal.
This pattern emerges during periods of market uncertainty regarding the subsequent trend direction. Price gradually forms converging trend lines, creating the characteristic geometric shape on the chart. Understanding triangle formation mechanics enables traders to prepare for potential breakouts and enter positions aligned with the primary movement. This topic is directly related to the flag and pennant. Professional market participants view the triangle as an accumulation or distribution period by large institutional players.
Triangle Classification in Technical Analysis
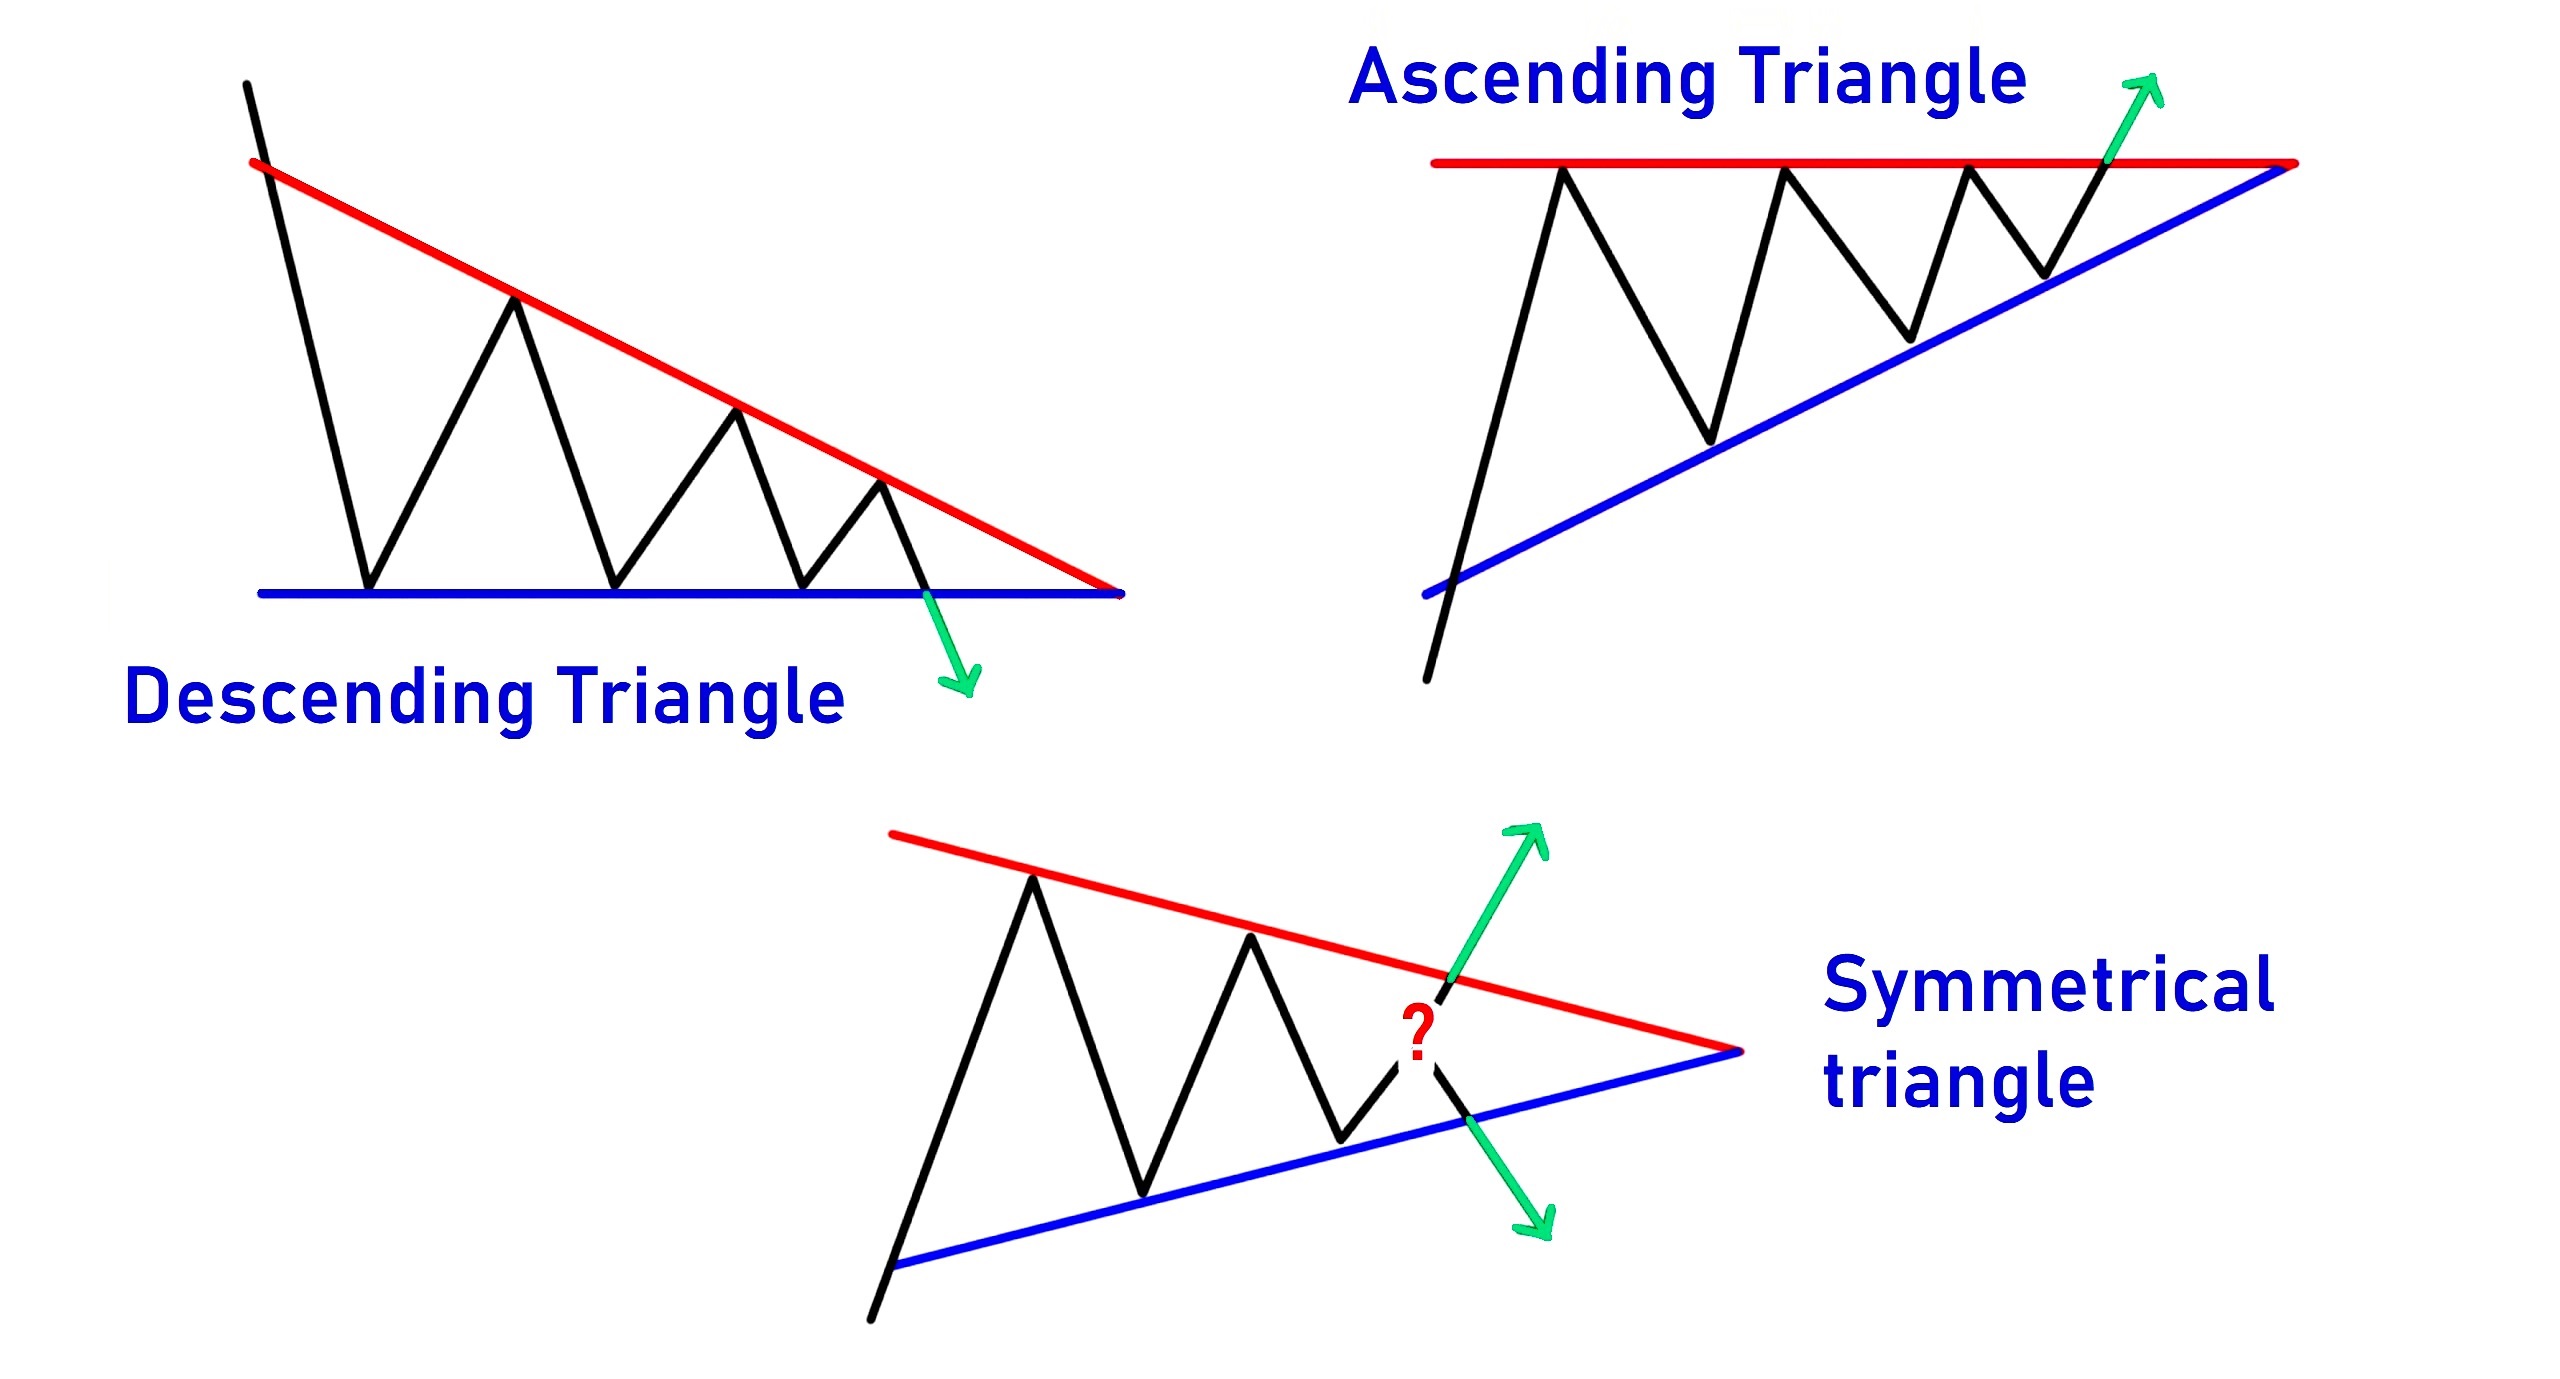
Technical analysis identifies three primary variations of triangle patterns in chart formations. Each type possesses unique characteristics and provides distinct trading signals for decision-making purposes. Accurate identification of triangle type proves critically important for successful trading across all financial markets. Statistical data demonstrates varying breakout probabilities depending on formation type and market context.
The ascending triangle forms with a horizontal resistance level and an ascending support line on the price chart. Buyers demonstrate strength by consecutively forming higher lows in the price structure. Horizontal resistance indicates a zone where sellers temporarily maintain control over the market situation. Statistically, ascending triangles more frequently break upward, confirming the bullish character of this formation. Upward breakout probability reaches approximately seventy percent according to historical analysis of numerous market examples.
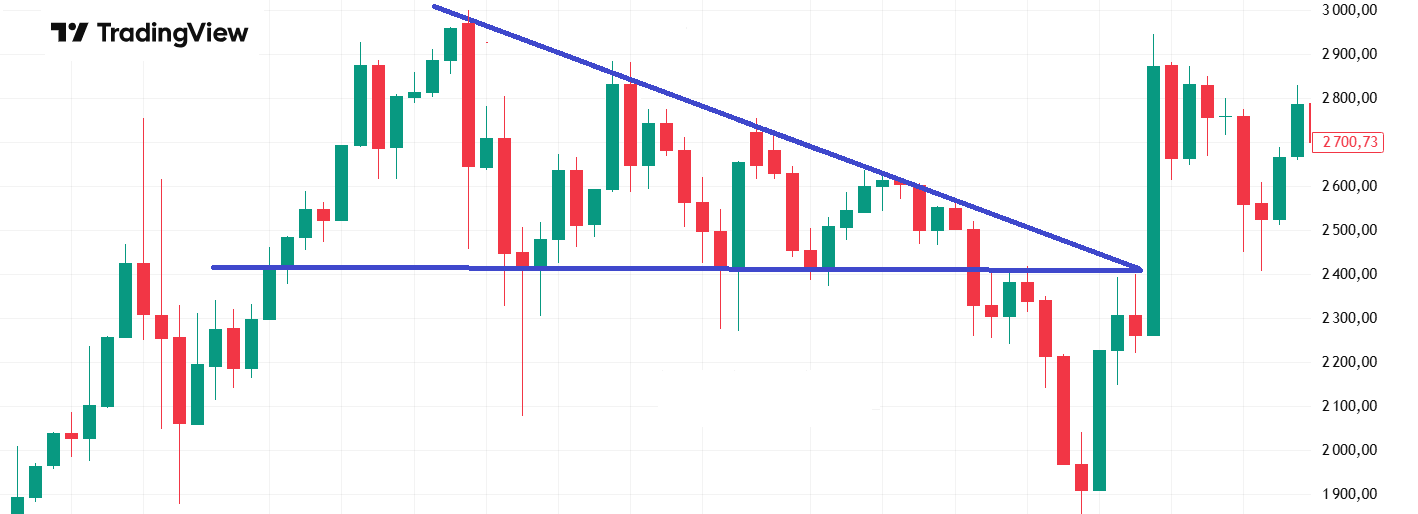
The descending triangle represents a mirror reflection of the ascending variant of this chart formation. A horizontal support line combines with a descending resistance line on the price chart. Sellers exert constant pressure on the price, forming a sequence of lower highs consistently. Breaking horizontal support confirms the bearish scenario for market situation development. This configuration frequently appears during final stages of downtrends before buyer capitulation occurs.
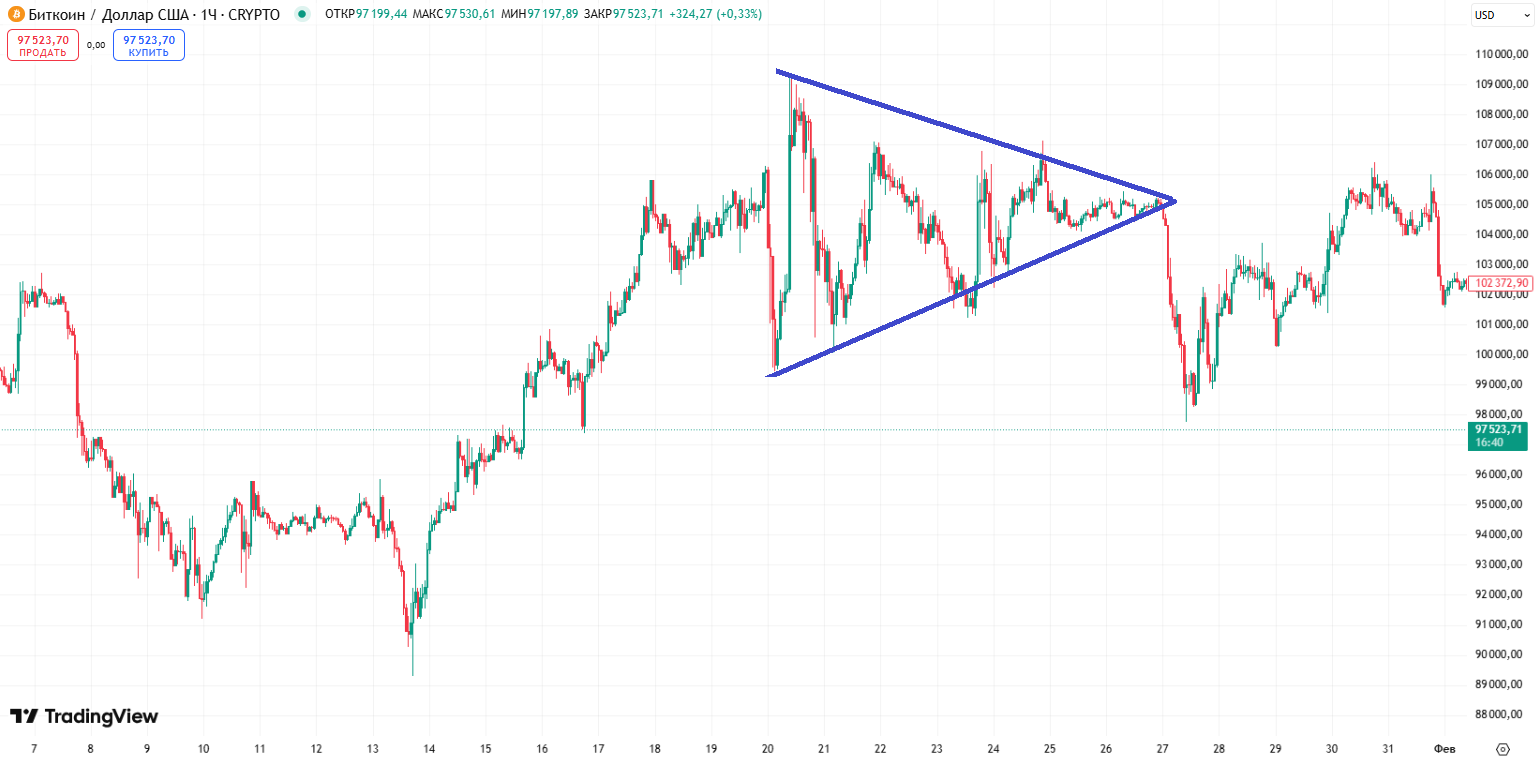
The symmetrical triangle features simultaneous convergence of both trend lines within the formation structure. The upper boundary angles downward while the lower boundary moves upward toward intersection. This configuration reflects complete equilibrium between market forces of buyers and sellers. Breakout direction remains unpredictable, prompting traders to await clear confirmation before position entry. Symmetrical triangles most commonly serve as continuation patterns of existing market trends.
Triangle Formation Mechanics
Triangle formation mechanics reflect market participant psychology during uncertainty periods and anticipation phases. During the initial stage, an impulsive price movement occurs in a specific direction on the chart. Subsequently, the market enters a consolidation phase where neither bulls nor bears establish definitive control. Volatility gradually decreases as price fluctuations become less pronounced with each successive movement within the formation.
Each subsequent touch of triangle boundaries reduces price movement amplitude inside the formation structure. Trading volumes typically contract as price approaches the pattern apex during consolidation. Accumulated market energy releases at the moment of boundary breakout from the formation. Impulsive movement following triangle exit often corresponds to triangle height measured at its base.
Large institutional players utilize consolidation periods for gradual position accumulation or distribution activities. The narrowing range allows them to operate unnoticed by most retail market participants effectively. Understanding this dynamic helps traders interpret market situations more accurately and make well-informed trading decisions.
Valid Pattern Identification Criteria
Recognizing authentic triangles requires adherence to specific validity criteria for the chart formation. Minimum touch point count equals four: two on the resistance line and two on the support line. Fewer contacts significantly reduce formation reliability and increase false signal risk substantially.
The time factor plays a substantial role in assessing triangle pattern potential for trading purposes. Formations developing over several weeks or months typically lead to more significant post-breakout movements. Short-term triangles on lower timeframes generate less reliable trading signals and produce false breakouts more frequently.
Volume analysis provides additional confirmation of pattern validity on the price chart display. Volume decline within the triangle and sharp increase during boundary breakout confirm signal authenticity. Level Breakout without volume expansion often prove false and lead to price returning inside the formation.
Triangle Breakout Trading Strategy
The classic strategy involves position entry following confirmed breakout of formation boundary. Confirmation requires candle closing beyond triangle boundaries at a significant distance from the level. Some traders await retest of the broken level for obtaining better entry points with reduced risk.
Aggressive traders may enter positions directly upon boundary breakout of the triangle formation. The conservative approach involves waiting for daily candle closing beyond formation limits completely. A compromise option includes entry upon breakout with partial position and adding volume upon movement confirmation.
Protective stop-loss placement occurs beyond the opposite boundary of the triangle on the chart. For upward breakouts, stops are placed below the last local minimum inside the formation. For downward breakouts, protective orders are placed above the nearest price maximum. The average true range indicator helps calculate optimal stop distance accurately.
Profit target levels are calculated using the formation height measurement method for triangles. Distance from base to apex is projected from breakout point in movement direction precisely. The resulting value determines minimum price movement target after exiting consolidation phase. Partial profit taking remains possible at intermediate levels for risk reduction purposes.
Combining with Technical Indicators
Trading signal accuracy improves through application of additional analytical instruments and indicators. The relative strength indicator helps evaluate overbought or oversold market conditions before breakouts. Extreme oscillator values strengthen reversal movement probability in the opposite direction significantly.
Moving averages provide information about main trend direction across different time intervals. Triangle breakout in the direction of long-term moving average carries increased signal reliability. Divergence between price and MACD indicator may warn about potential current trend reversal.
Fibonacci levels help identify key support and resistance zones within triangle formations effectively. Coincidence of formation boundary with retracement level increases significance of that price area. Fibonacci extensions are used for determining potential movement targets after pattern breakout occurs.
Candlestick Pattern Analysis at Boundaries
Candlestick patterns at triangle boundaries provide important information about market participant intentions. Formation of reversal patterns near resistance or support levels warns about possible boundary rejection. Trend continuation models strengthen successful breakout probability in the main movement direction.
Long candle shadows at boundaries indicate opposite side activity in that particular price zone. Pin bar appearance after breakout often signals false exit from the triangle formation structure. Engulfing price patterns confirm current price movement direction strength on the market effectively.
False Breakout Characteristics
False breakouts represent serious danger for traders of all preparation levels and experience backgrounds. Price temporarily exits beyond triangle boundary then returns inside the formation unexpectedly. Such situations lead to losses with improper trading position management approaches.
Signs of potentially false breakout include low volumes during boundary exit from the formation. Quick price return inside the triangle also indicates a false signal has occurred. Absence of candle closing beyond pattern limits confirms the need for awaiting confirmation.
Filter application reduces false signal quantity in triangle trading practice considerably. Requirement of multiple candle closes beyond boundary increases breakout reliability significantly. Percentage filter usage excludes insignificant exits beyond formation limits from consideration.
Capital Management in Triangle Trading
Proper risk management determines long-term trading success with any chart patterns. Position size is calculated based on acceptable loss per single trade parameters. Standard risk equals one to two percent of total trading capital for the trader.
Potential profit to risk ratio should exceed unity for ensuring positive mathematical expectation. Optimal trades offer ratios of two to one or higher for best results. Triangles with narrow ranges provide more attractive ratios due to close stop placement.
Trading position diversification reduces overall risk of the investment portfolio effectively. Simultaneous trading of several uncorrelated instruments protects capital from adverse developments. Capital distribution between different strategies increases trading result stability over time.
Application Across Different Markets
Triangle pattern application across different markets has specific features and important nuances. Stock market is characterized by clearer formations due to high liquidity of major stocks. Forex market provides numerous trading opportunities through round-the-clock operation and deep liquidity of major currency pairs.
Cryptocurrency market differs with increased volatility affecting triangle characteristics significantly. Formations may break faster and with greater price movement amplitude than traditional markets. However, false breakout quantity also increases due to manipulative actions by large holders.
Practical Recommendations for Traders
Successful triangle trading requires patience and discipline from market participants consistently. Premature entry before confirmed breakout increases losing trade probability substantially. Waiting for clear signals improves profitable trading operation percentage on the account.
Maintaining a trading journal allows result analysis and strategy improvement on an ongoing basis. Documenting each trade with entry and exit reasons helps identify typical errors made. Regular statistics analysis improves trading decision quality for the trader significantly.
Strategy testing on historical data provides effectiveness statistics for the chosen trading approach. Demo accounts allow practicing skills without risk of losing real monetary funds. Transition to real trading occurs after achieving stable positive results consistently.
Psychological preparation plays an important role in trading chart patterns successfully. Emotional decisions often lead to trading plan violations and subsequent financial losses. Self-control development ensures action consistency for the trader in all market situations.
Conclusion
The triangle pattern remains one of the most effective technical analysis instruments for financial markets. Correct formation type identification and proper position management ensure stable long-term profits. To consolidate the material, also study trading channels. Combining chart analysis with technical indicators and candlestick patterns improves trading decision accuracy considerably.
Continuous skill improvement and adaptation to changing market conditions ensure long-term trading success. Disciplined adherence to trading plans protects capital and provides steady deposit growth. Studying additional patterns expands strategy arsenal and increases trader flexibility across various market conditions.
Frequently Asked Questions About Triangle Pattern
A triangle pattern is a technical analysis chart formation that develops when price range narrows between support and resistance lines. This pattern signals market consolidation before a potential breakout in either direction.
Technical analysis identifies three main triangle types: ascending triangle (bullish signal with horizontal resistance), descending triangle (bearish signal with horizontal support), and symmetrical triangle (neutral pattern with balanced forces).
Triangle trading involves entering positions after confirmed breakout of one formation boundary. Stop-loss is placed beyond the opposite boundary, and profit target is calculated using triangle height projected from the breakout point.
To filter false breakouts: wait for candle close beyond pattern boundary, confirm breakout with increased trading volume, use additional indicators (RSI, MACD), and apply percentage filters to exclude minor boundary violations.
Triangle patterns provide most reliable signals on medium and higher timeframes from hourly to daily charts. Weekly chart formations lead to most significant movements but require patience. Lower timeframes generate more false signals.
About the Author
Author: Igor Arapov — independent researcher in trading psychology and behavioral finance, practising trader since 2013, founder of arapov.trade, author of a trading book series (Open Library ), (ORCID: 0009-0003-0430-778X ).