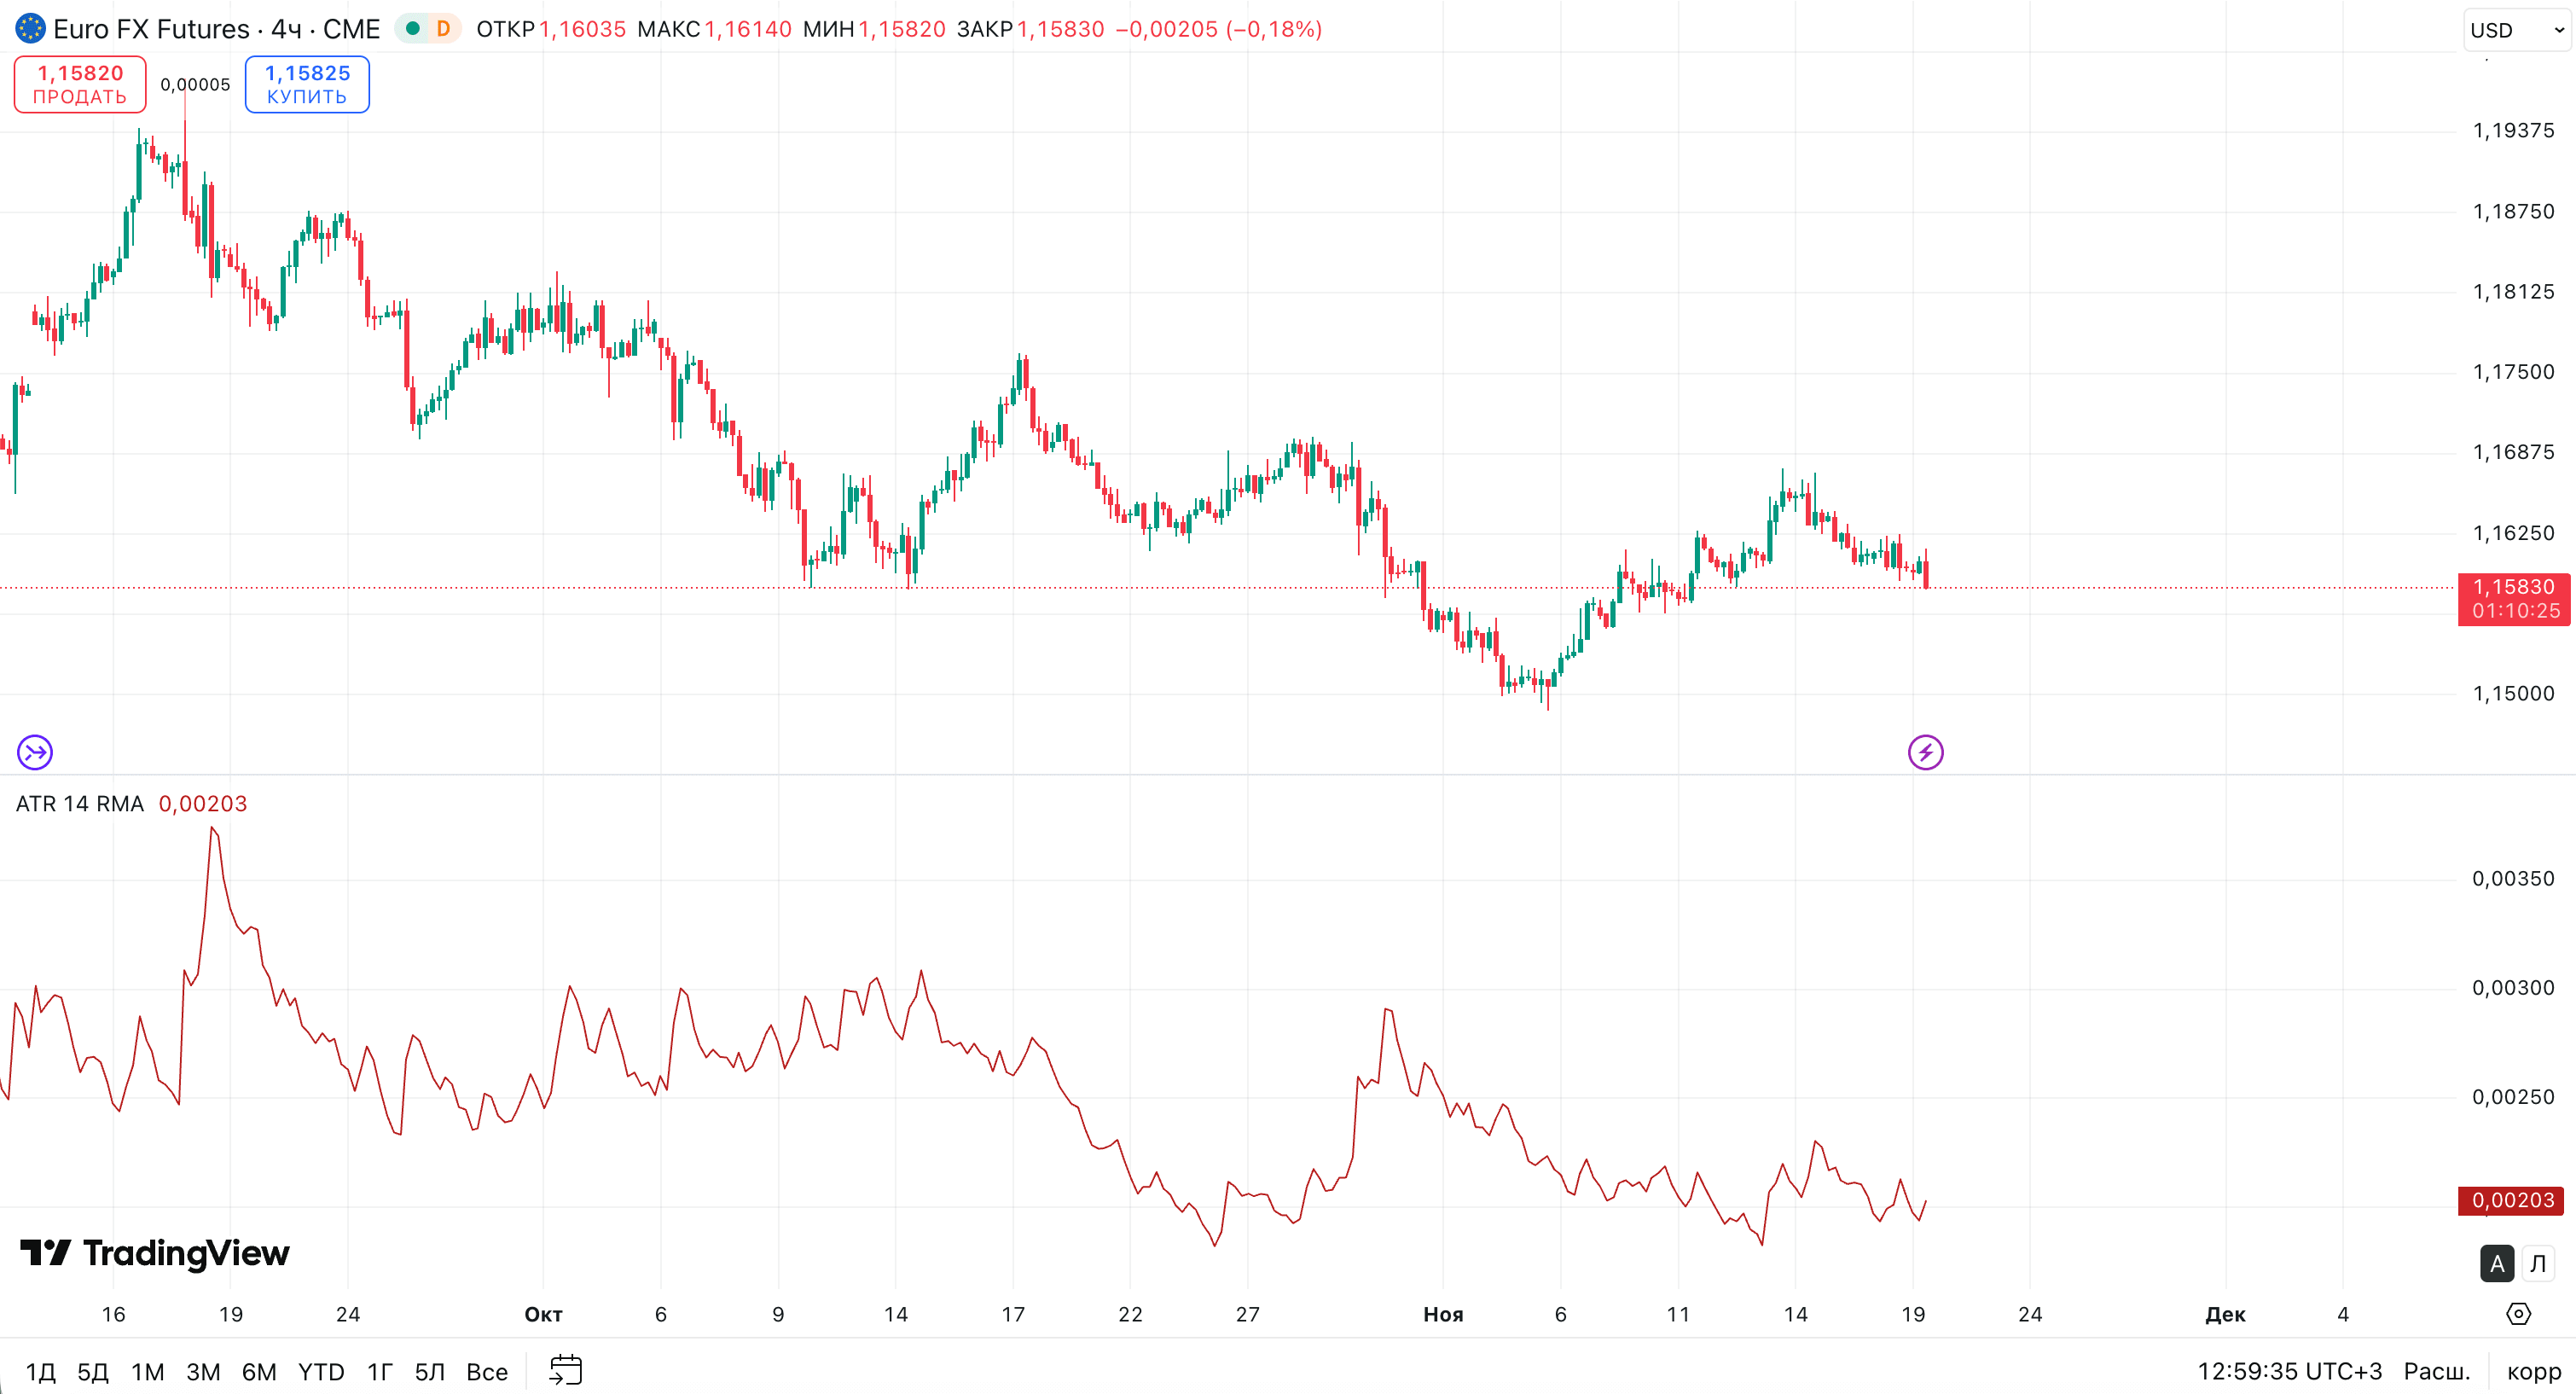
The ATR Indicator in Trading: Volatility and Locking In Profit
ATR measures one thing: how widely price travels over a chosen period. It will tell you nothing about direction, and waiting for buy-sell signals from it is pointless. What it does hand you beautifully is a stop that will not fly out on a flat patch, a rough read on position size, and a quick answer to whether the market is asleep right now or in a storm. At bottom it is a ruler for the range of a move, and in that role ATR is genuinely useful.
I have tried a mountain of indicators in my time, and for entering a trade not one gave me anything worthwhile. I trade by levels and volume, and I cleared the colourful panel under the chart long ago. Only ATR survived, and the reason is simple: it does not pose as a fortune-teller, it quietly counts the amplitude and hands back one number. That is already a working tool, not guesswork. So in my head ATR sits on the risk-management shelf, next to the stop and the position-size calculation, not among entry signals.
In this article we'll cover:
- ATR shows the average range of a candle and stays silent about the direction of the move
- its main use is a stop the market does not sweep with ordinary noise, and even risk in money terms
- at its peaks ATR hints the move's fuel is running out, and that is a reason to think about the exit
- the ATR level reads the market's phase: compression before a thrust or expansion in the thick of a trend
I'll start with what ATR actually counts and where its single number comes from.
What ATR (Average True Range) is and how it is calculated
ATR (Average True Range) is an indicator of the average true range; it shows how much, on average, price travels over a period. Welles Wilder devised it back in 1978, and at its base lies the true range of a single candle. You take the largest of three distances: the candle's own range from top to bottom, the gap from its high to the previous close, and from the low to that same close.
The arithmetic after that is dull. These ranges are averaged over several candles, fourteen by default, and out comes a single number. It rises equally in a crash and in a rally, because it counts amplitude and simply ignores the side of the move. Let me show it plainly. Say a candle ran from 1.0850 to 1.0880, that is thirty pips of visible range, but if the previous one closed lower, at 1.0840, then the true range is measured from that close, and it comes to forty pips. The averaging will take those real forty, not the visible thirty. That is why ATR is more honest than the plain height of a candle: it picks up the gaps between candles and does not understate the real range on which you will be hiding your stop. What indicators are in general and why most of them lag I cover in the piece on trading indicators.
In short: ATR is the range of price averaged over fourteen candles; it runs high both in a rise and in a fall, so the side of the move cannot be read from it.
How to set a stop-loss with ATR
Here ATR is irreplaceable, and here is why. The typical beginner's trouble with the stop-loss is that they set it by eye or right under a local low. The market sweeps such a stop with ordinary rocking and calmly goes where the trader was aiming all along. ATR shows the live range right now, so it makes sense to hide the stop beyond that range rather than inside it.
On a quiet market the stop comes out tight, on a stormy one wide, and that is the right dependency: we adapt to the market, not to our own wish to risk a little less. From the same range it is handy to work out the position size too, so that risk in money stays even whether it is a sleepy session or a news surge. In my experience that is far healthier than the same stop in pips on every instrument. The concrete risk figures are everyone's own, and this is not an instruction aimed at you but my logic: first I work out a sensible stop by volatility, and only then the size of the trade. A rough example of the logic itself, with no tie to your money. If ATR on the working timeframe shows, say, forty pips, hiding a stop ten pips under the level is pointless; the very first ordinary candle will sweep it. A buffer of at least one full ATR beyond the level already takes the stop out of the zone of ordinary noise. On a longer timeframe ATR is larger and the stop naturally comes out wider, on a shorter one tighter, and that is not a whim but a reflection of how the asset breathes right now. How to count risk per trade off such a range I show in the course section on position sizing.
In short: Hide the stop beyond the current ATR range, not under a local level: on a calm market it is tighter, on a stormy one wider, and noise stops sweeping it out.
ATR multipliers, position size, and the trailing stop
The next question is how many ATRs the stop should be. A common convention is a multiple of the current ATR: roughly one and a half for fast intraday trades, two for swing trades, three for position trades held longer, the shorter you hold, the tighter the multiple. None of these numbers is sacred; they are a starting frame, and the real point is only that the stop reflects how the asset moves, not a round figure. The same range also fixes the position size. Knowing the stop distance in ATR and the money you are prepared to lose, the size falls out: a volatile instrument earns fewer units, a calm one more, and the loss in money stays the same across both. That volatility-normalising is how a serious book keeps one wild name from quietly dominating its risk.
ATR also makes a clean trailing stop. You trail it a set number of ATRs, often three, below the highest point the move has reached, so it keeps wide room while volatility is high and tightens as it calms, and price has to genuinely turn to take you out, not just wobble. The three-ATR version has a name, the chandelier exit. I treat it like all of this: a frame for letting a winner run without sitting over it candle by candle, not a magic exit. The decision to stay or step aside still comes from price and volume at the level, while ATR only sets how much slack the stop is given. This is not a recipe for you, it is the order I keep myself: volatility first, then the stop, then the size.
In short: Set the stop at a multiple of ATR (about 1.5x intraday, 2x swing, 3x position) and let the same range fix the position size, so risk in money stays even across calm and wild instruments; trailing a few ATRs below the high (the chandelier exit) lets a winner run while volatility is wide.
ATR at its highs: a cue to take profit
One caveat straight away: reversals are not caught with ATR, the indicator is no good for that. But there is a pattern, and I use it. When ATR crawls up to its peaks, the market has already dragged hard and long in one direction. And since it does not go one way forever, at a peak of volatility it is sensible to prepare an exit or at least move the stop to break-even.
So an extreme ATR value is not a command to close, but a reminder that the move's fuel is nearly burnt, and what waits ahead is either a reversal or a slide into a flat. Locking in profit at such peaks pays better over the distance than sitting and watching the market take it back. The logic here is the same as with volume: a sharp range at a peak is most often the work of those who entered last and on emotion, and when there is almost no one left to enter, the move simply has nothing to feed itself on. So I read an ATR extreme not as an invitation to jump into the surge but as a quiet bell that profit should come off the table. This is my observation from practice, not a law of the market, but you can check it on any chart in a couple of minutes.
In short: ATR at a peak says the move has run out of breath: not a signal to close at once, but a reason to pull the stop to break-even and prepare the exit.
Volatility compression and expansion: how ATR helps a trader
The market breathes. Volatility comes in waves: compression, then expansion, then compression again, and so around the loop without end. There is no eternal impulse, and no eternal flat either. This mechanic has not changed for as long as the market has existed, and ATR simply makes it visible to the eye.
A trick from practice, on the open of the European session for instance. If ATR shows compression and price seems pulled tight like a spring, get ready for a false break past the level and work against it. Before a trend reversal there almost always comes compression first, and behind it a false break, when price is led past the level to collect other people's stops. It looks like this. The market tightens, ATR slides to its lows, the order book goes quiet, and to a beginner it seems nothing is happening. Then price sharply false breaks past the level, ATR jumps, the crowd flies in on the breakout, and at exactly that moment a large participant hands it their position while price turns back. The compression was the lull before that false break, and ATR lit it up in advance for those who knew how to look. This is the same volume logic I hold to in everything else: the market is moved not by an indicator but by a large participant, and ATR only highlights the moment when they are about to make their move. More on the nature of range itself is in the piece on market volatility, and a live breakdown of the indicator on the chart I posted in the video on the ATR indicator and market volatility.
In short: ATR compression before a session is a setup for a false break: price is led past the level to collect stops, and it pays to work against that break rather than after it.
Frequently asked questions
The average range of price over a period, that is, volatility. It does not hint at the side of the move: an equally high value appears both in a rise and in a fall. It is a gauge of amplitude, not a signal to enter.
Hide the stop beyond the current range of the move, not inside it. On a calm market it comes out tighter, on a volatile one wider. Because of that, ordinary noise sweeps it noticeably less often than a stop placed by eye.
A common frame is about 1.5 times ATR for fast intraday trades, 2 times for swing trades, and 3 times for position trades held longer: the shorter you hold, the tighter the multiple. None of these numbers is sacred; they are a starting point, and the real aim is only that the stop reflects how the asset moves rather than a round figure.
Take the money you are willing to lose on the trade and divide it by the stop distance in ATR. A volatile instrument then gets fewer units and a calm one more, so the loss in money stays the same across both. That keeps one wild instrument from dominating your risk.
Not directly; ATR is not a reversal indicator. But its high values often coincide with the climax of a move, and that is a reason to prepare to lock in or to wait for a shift into a flat, rather than a command to close this very second.
Fourteen is the default. That period gives a smoothed read of the range and covers most tasks. It is worth changing only for a specific trading style, while a beginner does better staying on the standard value.
About the Author
Author: Igor Arapov — independent researcher in the psychology of investment decisions and behavioral finance, practising trader since 2013, founder of arapov.trade, author of a trading book series (ORCID: 0009-0003-0430-778X).